

Key Insights
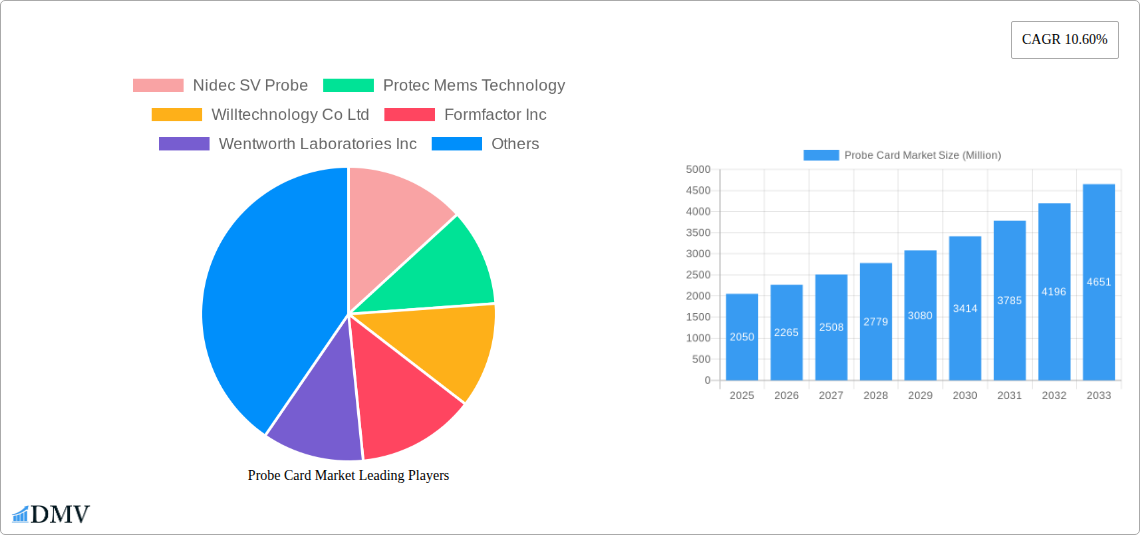
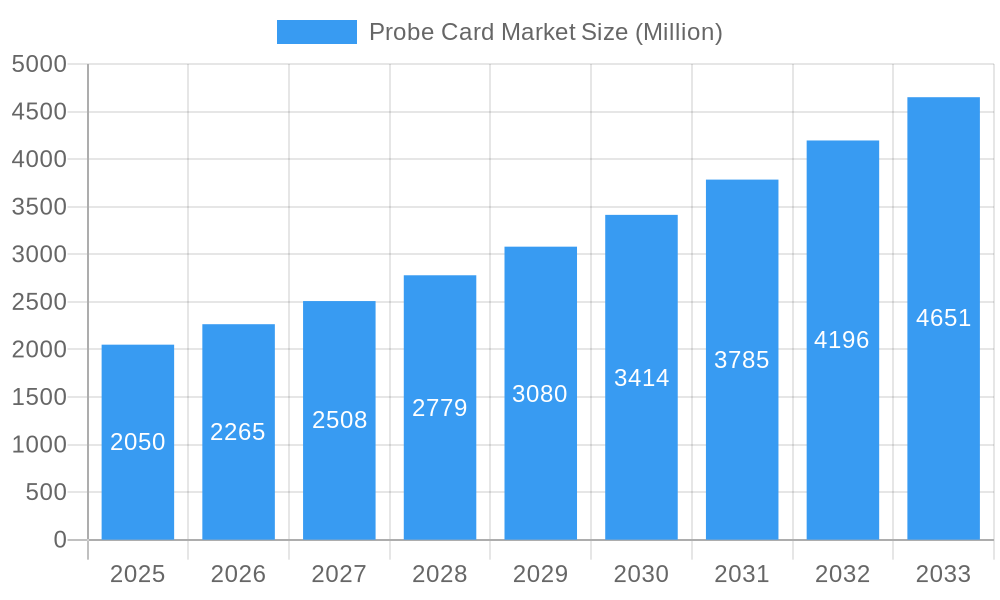
The global probe card market, valued at $2.05 billion in 2025, is projected to experience robust growth, driven by the increasing demand for advanced semiconductor devices and the miniaturization of electronic components. A Compound Annual Growth Rate (CAGR) of 10.60% from 2025 to 2033 indicates a significant expansion, largely fueled by the rising adoption of advanced technologies such as MEMS (Microelectromechanical Systems) and the increasing complexity of semiconductor designs in applications like DRAM, Flash memory, and logic chips. The market segmentation highlights the dominance of standard probe cards, yet the growing demand for advanced probe cards, capable of handling smaller and more intricate devices, is a key trend pushing market growth. This technological advancement is also driving innovation in probe card materials and designs, particularly in cantilever and specialty probe card segments. Geographic expansion, particularly in Asia-Pacific fueled by the burgeoning semiconductor manufacturing industry in regions like China, South Korea, and Taiwan, further contributes to the market's growth trajectory. However, factors such as high production costs and the requirement for specialized expertise could potentially restrain market growth to some degree.
Probe Card Market Market Size (In Billion)
The competitive landscape is characterized by a mix of established players and emerging companies. Companies like Formfactor Inc., Technoprobe S.p.A., and Nidec SV Probe hold significant market share due to their established technological capabilities and global reach. However, the market also presents opportunities for smaller players specializing in niche technologies or geographical regions. The ongoing advancements in semiconductor technology and the increasing demand for high-performance electronics are expected to continue driving innovation and expansion within the probe card market. Furthermore, collaborations between probe card manufacturers and semiconductor companies to develop customized solutions are likely to become increasingly important in the coming years. Strategic acquisitions and mergers could also reshape the competitive landscape and accelerate market consolidation.
Probe Card Market Company Market Share
Probe Card Market: A Comprehensive Market Analysis & Forecast (2019-2033)
This insightful report provides a detailed analysis of the global Probe Card market, encompassing market size, segmentation, competitive landscape, and future growth prospects. With a study period spanning from 2019 to 2033, a base year of 2025, and a forecast period from 2025 to 2033, this report offers a comprehensive overview of this dynamic industry, valued at xx Million in 2025 and projected to reach xx Million by 2033.
Probe Card Market Composition & Trends
The Probe Card market is characterized by a moderately concentrated landscape, with key players such as FormFactor Inc., Technoprobe S.p.A., and Nidec SV Probe holding significant market share. Innovation is a crucial driver, particularly in MEMS technology and advanced probe card designs, pushing the boundaries of performance and miniaturization. The regulatory landscape, while generally supportive of technological advancement, faces ongoing scrutiny regarding material usage and environmental impact. Substitute products, while limited, pose some competitive pressure, mainly from alternative testing methodologies. End-users primarily consist of semiconductor manufacturers across various segments like DRAM, Flash, and Logic. M&A activity has been moderate, with deal values averaging around xx Million in recent years, primarily focused on consolidating technological expertise and expanding market reach.
- Market Share Distribution: FormFactor Inc. (xx%), Technoprobe S.p.A. (xx%), Nidec SV Probe (xx%), Others (xx%).
- M&A Deal Values (2019-2024): Average of xx Million per deal.
- Key Innovation Catalysts: Miniaturization demands, increasing test frequencies, and the need for improved signal integrity.
- Regulatory Landscape: Focus on environmental regulations and material compliance.
Probe Card Market Industry Evolution
The Probe Card market has witnessed substantial growth over the historical period (2019-2024), driven by the expansion of the semiconductor industry and the increasing complexity of integrated circuits. The compound annual growth rate (CAGR) during this period was approximately xx%. Technological advancements, particularly in MEMS and advanced probe card technologies, have enabled higher pin counts, faster test speeds, and improved accuracy. Consumer demands for smaller, faster, and more power-efficient electronic devices are fueling the need for advanced testing solutions, further boosting market growth. The forecast period (2025-2033) anticipates continued growth, driven by advancements in 5G, AI, and IoT technologies, with an estimated CAGR of xx%. The adoption rate of advanced probe cards is expected to increase significantly, exceeding xx% by 2033. The rise of 3D packaging further fuels the need for sophisticated probe cards capable of testing complex chip architectures.
Leading Regions, Countries, or Segments in Probe Card Market
The Asia-Pacific region, particularly countries like South Korea, Taiwan, and China, dominates the Probe Card market due to the high concentration of semiconductor manufacturing facilities. Within the technological segmentation, MEMS probe cards demonstrate the fastest growth rate driven by their high pin count capacity and improved accuracy. The DRAM segment remains the largest application sector, owing to its massive scale of production.
- Key Drivers in Asia-Pacific: High concentration of semiconductor manufacturers, significant investments in R&D, and supportive government policies.
- Dominant Technology Segment: MEMS, driven by its ability to handle increasingly dense chip designs.
- Leading Application Segment: DRAM, reflecting its significant market size and demand for advanced testing solutions.
- Advanced Probe Card Growth: High growth due to demand for testing complex chips in high-end applications.
Probe Card Market Product Innovations
Recent innovations have focused on enhancing probe card performance, reliability, and cost-effectiveness. FormFactor's COMPASS presentation highlights significant advancements in achieving higher current carrying capacity (CCC) exceeding 2.5A at an 80-um minimum pitch, crucial for testing next-generation devices. These improvements incorporate innovative probe designs and architectural enhancements to maintain integrity under high-stress conditions. Further innovations include improved materials and manufacturing processes to enhance durability and reduce test time. These advancements cater to the growing need for precise and efficient testing methodologies in the semiconductor industry.
Propelling Factors for Probe Card Market Growth
The Probe Card market's growth is propelled by several factors. The increasing demand for advanced semiconductor devices in various applications like 5G, AI, and IoT is a primary driver. Continuous miniaturization of integrated circuits necessitates improved testing solutions, which are provided by advanced probe cards. Moreover, increasing investments in research and development by major players are fueling innovation and driving market expansion.
Obstacles in the Probe Card Market
Challenges include supply chain disruptions, which can lead to material shortages and increased production costs. Competitive pressures and price erosion can also impact profitability, while technological complexity necessitates high R&D investments.
Future Opportunities in Probe Card Market
The growing adoption of advanced packaging technologies and the development of new semiconductor materials present significant opportunities. Expanding into emerging markets and developing specialized probe cards for niche applications offer further potential for growth. The demand for higher accuracy and faster testing speeds will drive innovation in advanced probe card technologies.
Major Players in the Probe Card Market Ecosystem
- Nidec SV Probe
- Protec Mems Technology
- Willtechnology Co Ltd
- Formfactor Inc
- Wentworth Laboratories Inc
- Japan Electronic Materials Corporation
- Micronics Japan Co Ltd
- TSE Co Lt
- Feinmetall Gmbh
- Star Technologies Inc
- Technoprobe S.p.A
- Mpi Corporation
- GGB Industries Inc
- Korea Instruments Co Ltd
Key Developments in Probe Card Market Industry
- April 2024: FormFactor released the COMPASS presentation, focusing on maximizing CCC in probe cards and achieving "unburnable" probes, exceeding 2.5A at 80-um pitch. This significantly improves testing capabilities for high-current applications.
- January 2024: Samsung established a new research lab in the US for advanced 3D-DRAM development, signifying increased investment and technological innovation in this critical memory segment, further driving demand for sophisticated probe cards.
Strategic Probe Card Market Forecast
The Probe Card market is poised for robust growth, driven by technological advancements, increasing semiconductor demand, and the expansion of high-growth applications. The forecast period anticipates continued adoption of advanced probe card technologies, along with strategic partnerships and M&A activities, shaping the competitive landscape. The market's potential remains significant, with opportunities for innovation and expansion across various segments and regions.
Probe Card Market Segmentation
-
1. Technology
- 1.1. MEMS
- 1.2. Vertical
- 1.3. Cantilever
- 1.4. Speciality
- 1.5. Other Technologies
-
2. Application
- 2.1. DRAM
- 2.2. Flash
- 2.3. Foundry and Logic
- 2.4. Parametric
- 2.5. Other Applications
-
3. Type
- 3.1. Standard Probe Card
- 3.2. Advanced Probe Card
Probe Card Market Segmentation By Geography
- 1. North America
- 2. Europe
- 3. Asia
- 4. Australia and New Zealand
- 5. Latin America
- 6. Middle East and Africa
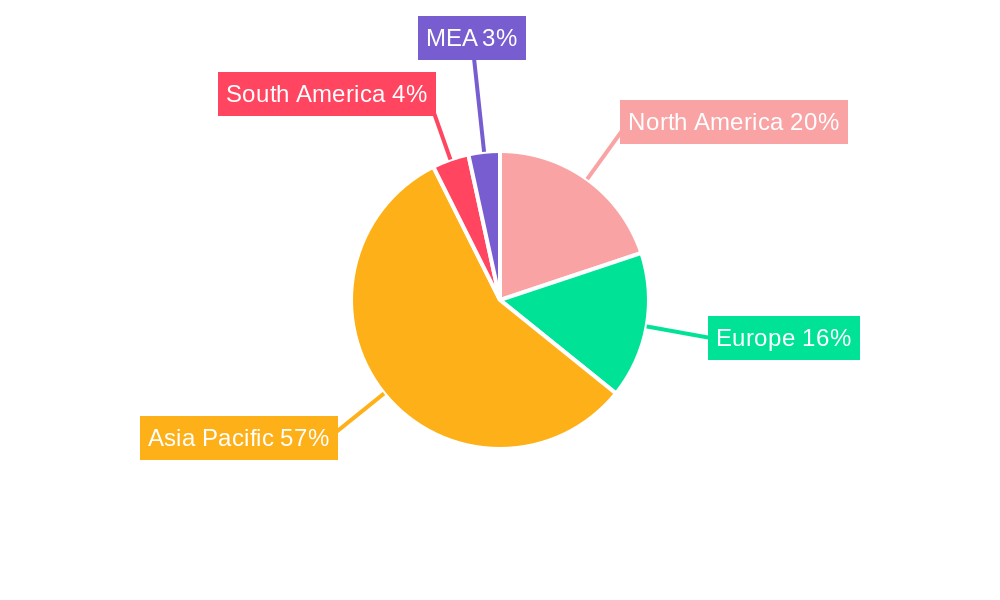
Probe Card Market Regional Market Share
Geographic Coverage of Probe Card Market
Probe Card Market REPORT HIGHLIGHTS
| Aspects | Details |
|---|---|
| Study Period | 2020-2034 |
| Base Year | 2025 |
| Estimated Year | 2026 |
| Forecast Period | 2026-2034 |
| Historical Period | 2020-2025 |
| Growth Rate | CAGR of 10.60% from 2020-2034 |
| Segmentation |
|
Table of Contents
- 1. Introduction
- 1.1. Research Scope
- 1.2. Market Segmentation
- 1.3. Research Methodology
- 1.4. Definitions and Assumptions
- 2. Executive Summary
- 2.1. Introduction
- 3. Market Dynamics
- 3.1. Introduction
- 3.2. Market Drivers
- 3.2.1. Increase in Demand for Consumer Electronics and IOT; Miniaturization of Electronic Products; Technological Advancement And Innovations in Semiconductor Industry
- 3.3. Market Restrains
- 3.3.1. High Costs Associated with Probe Cards; Lack of Awareness Among Consumers Regarding The Benefits of Probe Card Solution
- 3.4. Market Trends
- 3.4.1. MEMS to Dominate the Technology Segment
- 4. Market Factor Analysis
- 4.1. Porters Five Forces
- 4.2. Supply/Value Chain
- 4.3. PESTEL analysis
- 4.4. Market Entropy
- 4.5. Patent/Trademark Analysis
- 5. Global Probe Card Market Analysis, Insights and Forecast, 2020-2032
- 5.1. Market Analysis, Insights and Forecast - by Technology
- 5.1.1. MEMS
- 5.1.2. Vertical
- 5.1.3. Cantilever
- 5.1.4. Speciality
- 5.1.5. Other Technologies
- 5.2. Market Analysis, Insights and Forecast - by Application
- 5.2.1. DRAM
- 5.2.2. Flash
- 5.2.3. Foundry and Logic
- 5.2.4. Parametric
- 5.2.5. Other Applications
- 5.3. Market Analysis, Insights and Forecast - by Type
- 5.3.1. Standard Probe Card
- 5.3.2. Advanced Probe Card
- 5.4. Market Analysis, Insights and Forecast - by Region
- 5.4.1. North America
- 5.4.2. Europe
- 5.4.3. Asia
- 5.4.4. Australia and New Zealand
- 5.4.5. Latin America
- 5.4.6. Middle East and Africa
- 5.1. Market Analysis, Insights and Forecast - by Technology
- 6. North America Probe Card Market Analysis, Insights and Forecast, 2020-2032
- 6.1. Market Analysis, Insights and Forecast - by Technology
- 6.1.1. MEMS
- 6.1.2. Vertical
- 6.1.3. Cantilever
- 6.1.4. Speciality
- 6.1.5. Other Technologies
- 6.2. Market Analysis, Insights and Forecast - by Application
- 6.2.1. DRAM
- 6.2.2. Flash
- 6.2.3. Foundry and Logic
- 6.2.4. Parametric
- 6.2.5. Other Applications
- 6.3. Market Analysis, Insights and Forecast - by Type
- 6.3.1. Standard Probe Card
- 6.3.2. Advanced Probe Card
- 6.1. Market Analysis, Insights and Forecast - by Technology
- 7. Europe Probe Card Market Analysis, Insights and Forecast, 2020-2032
- 7.1. Market Analysis, Insights and Forecast - by Technology
- 7.1.1. MEMS
- 7.1.2. Vertical
- 7.1.3. Cantilever
- 7.1.4. Speciality
- 7.1.5. Other Technologies
- 7.2. Market Analysis, Insights and Forecast - by Application
- 7.2.1. DRAM
- 7.2.2. Flash
- 7.2.3. Foundry and Logic
- 7.2.4. Parametric
- 7.2.5. Other Applications
- 7.3. Market Analysis, Insights and Forecast - by Type
- 7.3.1. Standard Probe Card
- 7.3.2. Advanced Probe Card
- 7.1. Market Analysis, Insights and Forecast - by Technology
- 8. Asia Probe Card Market Analysis, Insights and Forecast, 2020-2032
- 8.1. Market Analysis, Insights and Forecast - by Technology
- 8.1.1. MEMS
- 8.1.2. Vertical
- 8.1.3. Cantilever
- 8.1.4. Speciality
- 8.1.5. Other Technologies
- 8.2. Market Analysis, Insights and Forecast - by Application
- 8.2.1. DRAM
- 8.2.2. Flash
- 8.2.3. Foundry and Logic
- 8.2.4. Parametric
- 8.2.5. Other Applications
- 8.3. Market Analysis, Insights and Forecast - by Type
- 8.3.1. Standard Probe Card
- 8.3.2. Advanced Probe Card
- 8.1. Market Analysis, Insights and Forecast - by Technology
- 9. Australia and New Zealand Probe Card Market Analysis, Insights and Forecast, 2020-2032
- 9.1. Market Analysis, Insights and Forecast - by Technology
- 9.1.1. MEMS
- 9.1.2. Vertical
- 9.1.3. Cantilever
- 9.1.4. Speciality
- 9.1.5. Other Technologies
- 9.2. Market Analysis, Insights and Forecast - by Application
- 9.2.1. DRAM
- 9.2.2. Flash
- 9.2.3. Foundry and Logic
- 9.2.4. Parametric
- 9.2.5. Other Applications
- 9.3. Market Analysis, Insights and Forecast - by Type
- 9.3.1. Standard Probe Card
- 9.3.2. Advanced Probe Card
- 9.1. Market Analysis, Insights and Forecast - by Technology
- 10. Latin America Probe Card Market Analysis, Insights and Forecast, 2020-2032
- 10.1. Market Analysis, Insights and Forecast - by Technology
- 10.1.1. MEMS
- 10.1.2. Vertical
- 10.1.3. Cantilever
- 10.1.4. Speciality
- 10.1.5. Other Technologies
- 10.2. Market Analysis, Insights and Forecast - by Application
- 10.2.1. DRAM
- 10.2.2. Flash
- 10.2.3. Foundry and Logic
- 10.2.4. Parametric
- 10.2.5. Other Applications
- 10.3. Market Analysis, Insights and Forecast - by Type
- 10.3.1. Standard Probe Card
- 10.3.2. Advanced Probe Card
- 10.1. Market Analysis, Insights and Forecast - by Technology
- 11. Middle East and Africa Probe Card Market Analysis, Insights and Forecast, 2020-2032
- 11.1. Market Analysis, Insights and Forecast - by Technology
- 11.1.1. MEMS
- 11.1.2. Vertical
- 11.1.3. Cantilever
- 11.1.4. Speciality
- 11.1.5. Other Technologies
- 11.2. Market Analysis, Insights and Forecast - by Application
- 11.2.1. DRAM
- 11.2.2. Flash
- 11.2.3. Foundry and Logic
- 11.2.4. Parametric
- 11.2.5. Other Applications
- 11.3. Market Analysis, Insights and Forecast - by Type
- 11.3.1. Standard Probe Card
- 11.3.2. Advanced Probe Card
- 11.1. Market Analysis, Insights and Forecast - by Technology
- 12. Competitive Analysis
- 12.1. Global Market Share Analysis 2025
- 12.2. Company Profiles
- 12.2.1 Nidec SV Probe
- 12.2.1.1. Overview
- 12.2.1.2. Products
- 12.2.1.3. SWOT Analysis
- 12.2.1.4. Recent Developments
- 12.2.1.5. Financials (Based on Availability)
- 12.2.2 Protec Mems Technology
- 12.2.2.1. Overview
- 12.2.2.2. Products
- 12.2.2.3. SWOT Analysis
- 12.2.2.4. Recent Developments
- 12.2.2.5. Financials (Based on Availability)
- 12.2.3 Willtechnology Co Ltd
- 12.2.3.1. Overview
- 12.2.3.2. Products
- 12.2.3.3. SWOT Analysis
- 12.2.3.4. Recent Developments
- 12.2.3.5. Financials (Based on Availability)
- 12.2.4 Formfactor Inc
- 12.2.4.1. Overview
- 12.2.4.2. Products
- 12.2.4.3. SWOT Analysis
- 12.2.4.4. Recent Developments
- 12.2.4.5. Financials (Based on Availability)
- 12.2.5 Wentworth Laboratories Inc
- 12.2.5.1. Overview
- 12.2.5.2. Products
- 12.2.5.3. SWOT Analysis
- 12.2.5.4. Recent Developments
- 12.2.5.5. Financials (Based on Availability)
- 12.2.6 Japan Electronic Materials Corporation
- 12.2.6.1. Overview
- 12.2.6.2. Products
- 12.2.6.3. SWOT Analysis
- 12.2.6.4. Recent Developments
- 12.2.6.5. Financials (Based on Availability)
- 12.2.7 Micronics Japan Co Ltd
- 12.2.7.1. Overview
- 12.2.7.2. Products
- 12.2.7.3. SWOT Analysis
- 12.2.7.4. Recent Developments
- 12.2.7.5. Financials (Based on Availability)
- 12.2.8 TSE Co Lt
- 12.2.8.1. Overview
- 12.2.8.2. Products
- 12.2.8.3. SWOT Analysis
- 12.2.8.4. Recent Developments
- 12.2.8.5. Financials (Based on Availability)
- 12.2.9 Feinmetall Gmbh
- 12.2.9.1. Overview
- 12.2.9.2. Products
- 12.2.9.3. SWOT Analysis
- 12.2.9.4. Recent Developments
- 12.2.9.5. Financials (Based on Availability)
- 12.2.10 Star Technologies Inc
- 12.2.10.1. Overview
- 12.2.10.2. Products
- 12.2.10.3. SWOT Analysis
- 12.2.10.4. Recent Developments
- 12.2.10.5. Financials (Based on Availability)
- 12.2.11 Technoprobe S P A
- 12.2.11.1. Overview
- 12.2.11.2. Products
- 12.2.11.3. SWOT Analysis
- 12.2.11.4. Recent Developments
- 12.2.11.5. Financials (Based on Availability)
- 12.2.12 Mpi Corporation
- 12.2.12.1. Overview
- 12.2.12.2. Products
- 12.2.12.3. SWOT Analysis
- 12.2.12.4. Recent Developments
- 12.2.12.5. Financials (Based on Availability)
- 12.2.13 GGB Industries Inc
- 12.2.13.1. Overview
- 12.2.13.2. Products
- 12.2.13.3. SWOT Analysis
- 12.2.13.4. Recent Developments
- 12.2.13.5. Financials (Based on Availability)
- 12.2.14 Korea Instruments Co Ltd
- 12.2.14.1. Overview
- 12.2.14.2. Products
- 12.2.14.3. SWOT Analysis
- 12.2.14.4. Recent Developments
- 12.2.14.5. Financials (Based on Availability)
- 12.2.1 Nidec SV Probe
List of Figures
- Figure 1: Global Probe Card Market Revenue Breakdown (Million, %) by Region 2025 & 2033
- Figure 2: Global Probe Card Market Volume Breakdown (K Unit, %) by Region 2025 & 2033
- Figure 3: North America Probe Card Market Revenue (Million), by Technology 2025 & 2033
- Figure 4: North America Probe Card Market Volume (K Unit), by Technology 2025 & 2033
- Figure 5: North America Probe Card Market Revenue Share (%), by Technology 2025 & 2033
- Figure 6: North America Probe Card Market Volume Share (%), by Technology 2025 & 2033
- Figure 7: North America Probe Card Market Revenue (Million), by Application 2025 & 2033
- Figure 8: North America Probe Card Market Volume (K Unit), by Application 2025 & 2033
- Figure 9: North America Probe Card Market Revenue Share (%), by Application 2025 & 2033
- Figure 10: North America Probe Card Market Volume Share (%), by Application 2025 & 2033
- Figure 11: North America Probe Card Market Revenue (Million), by Type 2025 & 2033
- Figure 12: North America Probe Card Market Volume (K Unit), by Type 2025 & 2033
- Figure 13: North America Probe Card Market Revenue Share (%), by Type 2025 & 2033
- Figure 14: North America Probe Card Market Volume Share (%), by Type 2025 & 2033
- Figure 15: North America Probe Card Market Revenue (Million), by Country 2025 & 2033
- Figure 16: North America Probe Card Market Volume (K Unit), by Country 2025 & 2033
- Figure 17: North America Probe Card Market Revenue Share (%), by Country 2025 & 2033
- Figure 18: North America Probe Card Market Volume Share (%), by Country 2025 & 2033
- Figure 19: Europe Probe Card Market Revenue (Million), by Technology 2025 & 2033
- Figure 20: Europe Probe Card Market Volume (K Unit), by Technology 2025 & 2033
- Figure 21: Europe Probe Card Market Revenue Share (%), by Technology 2025 & 2033
- Figure 22: Europe Probe Card Market Volume Share (%), by Technology 2025 & 2033
- Figure 23: Europe Probe Card Market Revenue (Million), by Application 2025 & 2033
- Figure 24: Europe Probe Card Market Volume (K Unit), by Application 2025 & 2033
- Figure 25: Europe Probe Card Market Revenue Share (%), by Application 2025 & 2033
- Figure 26: Europe Probe Card Market Volume Share (%), by Application 2025 & 2033
- Figure 27: Europe Probe Card Market Revenue (Million), by Type 2025 & 2033
- Figure 28: Europe Probe Card Market Volume (K Unit), by Type 2025 & 2033
- Figure 29: Europe Probe Card Market Revenue Share (%), by Type 2025 & 2033
- Figure 30: Europe Probe Card Market Volume Share (%), by Type 2025 & 2033
- Figure 31: Europe Probe Card Market Revenue (Million), by Country 2025 & 2033
- Figure 32: Europe Probe Card Market Volume (K Unit), by Country 2025 & 2033
- Figure 33: Europe Probe Card Market Revenue Share (%), by Country 2025 & 2033
- Figure 34: Europe Probe Card Market Volume Share (%), by Country 2025 & 2033
- Figure 35: Asia Probe Card Market Revenue (Million), by Technology 2025 & 2033
- Figure 36: Asia Probe Card Market Volume (K Unit), by Technology 2025 & 2033
- Figure 37: Asia Probe Card Market Revenue Share (%), by Technology 2025 & 2033
- Figure 38: Asia Probe Card Market Volume Share (%), by Technology 2025 & 2033
- Figure 39: Asia Probe Card Market Revenue (Million), by Application 2025 & 2033
- Figure 40: Asia Probe Card Market Volume (K Unit), by Application 2025 & 2033
- Figure 41: Asia Probe Card Market Revenue Share (%), by Application 2025 & 2033
- Figure 42: Asia Probe Card Market Volume Share (%), by Application 2025 & 2033
- Figure 43: Asia Probe Card Market Revenue (Million), by Type 2025 & 2033
- Figure 44: Asia Probe Card Market Volume (K Unit), by Type 2025 & 2033
- Figure 45: Asia Probe Card Market Revenue Share (%), by Type 2025 & 2033
- Figure 46: Asia Probe Card Market Volume Share (%), by Type 2025 & 2033
- Figure 47: Asia Probe Card Market Revenue (Million), by Country 2025 & 2033
- Figure 48: Asia Probe Card Market Volume (K Unit), by Country 2025 & 2033
- Figure 49: Asia Probe Card Market Revenue Share (%), by Country 2025 & 2033
- Figure 50: Asia Probe Card Market Volume Share (%), by Country 2025 & 2033
- Figure 51: Australia and New Zealand Probe Card Market Revenue (Million), by Technology 2025 & 2033
- Figure 52: Australia and New Zealand Probe Card Market Volume (K Unit), by Technology 2025 & 2033
- Figure 53: Australia and New Zealand Probe Card Market Revenue Share (%), by Technology 2025 & 2033
- Figure 54: Australia and New Zealand Probe Card Market Volume Share (%), by Technology 2025 & 2033
- Figure 55: Australia and New Zealand Probe Card Market Revenue (Million), by Application 2025 & 2033
- Figure 56: Australia and New Zealand Probe Card Market Volume (K Unit), by Application 2025 & 2033
- Figure 57: Australia and New Zealand Probe Card Market Revenue Share (%), by Application 2025 & 2033
- Figure 58: Australia and New Zealand Probe Card Market Volume Share (%), by Application 2025 & 2033
- Figure 59: Australia and New Zealand Probe Card Market Revenue (Million), by Type 2025 & 2033
- Figure 60: Australia and New Zealand Probe Card Market Volume (K Unit), by Type 2025 & 2033
- Figure 61: Australia and New Zealand Probe Card Market Revenue Share (%), by Type 2025 & 2033
- Figure 62: Australia and New Zealand Probe Card Market Volume Share (%), by Type 2025 & 2033
- Figure 63: Australia and New Zealand Probe Card Market Revenue (Million), by Country 2025 & 2033
- Figure 64: Australia and New Zealand Probe Card Market Volume (K Unit), by Country 2025 & 2033
- Figure 65: Australia and New Zealand Probe Card Market Revenue Share (%), by Country 2025 & 2033
- Figure 66: Australia and New Zealand Probe Card Market Volume Share (%), by Country 2025 & 2033
- Figure 67: Latin America Probe Card Market Revenue (Million), by Technology 2025 & 2033
- Figure 68: Latin America Probe Card Market Volume (K Unit), by Technology 2025 & 2033
- Figure 69: Latin America Probe Card Market Revenue Share (%), by Technology 2025 & 2033
- Figure 70: Latin America Probe Card Market Volume Share (%), by Technology 2025 & 2033
- Figure 71: Latin America Probe Card Market Revenue (Million), by Application 2025 & 2033
- Figure 72: Latin America Probe Card Market Volume (K Unit), by Application 2025 & 2033
- Figure 73: Latin America Probe Card Market Revenue Share (%), by Application 2025 & 2033
- Figure 74: Latin America Probe Card Market Volume Share (%), by Application 2025 & 2033
- Figure 75: Latin America Probe Card Market Revenue (Million), by Type 2025 & 2033
- Figure 76: Latin America Probe Card Market Volume (K Unit), by Type 2025 & 2033
- Figure 77: Latin America Probe Card Market Revenue Share (%), by Type 2025 & 2033
- Figure 78: Latin America Probe Card Market Volume Share (%), by Type 2025 & 2033
- Figure 79: Latin America Probe Card Market Revenue (Million), by Country 2025 & 2033
- Figure 80: Latin America Probe Card Market Volume (K Unit), by Country 2025 & 2033
- Figure 81: Latin America Probe Card Market Revenue Share (%), by Country 2025 & 2033
- Figure 82: Latin America Probe Card Market Volume Share (%), by Country 2025 & 2033
- Figure 83: Middle East and Africa Probe Card Market Revenue (Million), by Technology 2025 & 2033
- Figure 84: Middle East and Africa Probe Card Market Volume (K Unit), by Technology 2025 & 2033
- Figure 85: Middle East and Africa Probe Card Market Revenue Share (%), by Technology 2025 & 2033
- Figure 86: Middle East and Africa Probe Card Market Volume Share (%), by Technology 2025 & 2033
- Figure 87: Middle East and Africa Probe Card Market Revenue (Million), by Application 2025 & 2033
- Figure 88: Middle East and Africa Probe Card Market Volume (K Unit), by Application 2025 & 2033
- Figure 89: Middle East and Africa Probe Card Market Revenue Share (%), by Application 2025 & 2033
- Figure 90: Middle East and Africa Probe Card Market Volume Share (%), by Application 2025 & 2033
- Figure 91: Middle East and Africa Probe Card Market Revenue (Million), by Type 2025 & 2033
- Figure 92: Middle East and Africa Probe Card Market Volume (K Unit), by Type 2025 & 2033
- Figure 93: Middle East and Africa Probe Card Market Revenue Share (%), by Type 2025 & 2033
- Figure 94: Middle East and Africa Probe Card Market Volume Share (%), by Type 2025 & 2033
- Figure 95: Middle East and Africa Probe Card Market Revenue (Million), by Country 2025 & 2033
- Figure 96: Middle East and Africa Probe Card Market Volume (K Unit), by Country 2025 & 2033
- Figure 97: Middle East and Africa Probe Card Market Revenue Share (%), by Country 2025 & 2033
- Figure 98: Middle East and Africa Probe Card Market Volume Share (%), by Country 2025 & 2033
List of Tables
- Table 1: Global Probe Card Market Revenue Million Forecast, by Technology 2020 & 2033
- Table 2: Global Probe Card Market Volume K Unit Forecast, by Technology 2020 & 2033
- Table 3: Global Probe Card Market Revenue Million Forecast, by Application 2020 & 2033
- Table 4: Global Probe Card Market Volume K Unit Forecast, by Application 2020 & 2033
- Table 5: Global Probe Card Market Revenue Million Forecast, by Type 2020 & 2033
- Table 6: Global Probe Card Market Volume K Unit Forecast, by Type 2020 & 2033
- Table 7: Global Probe Card Market Revenue Million Forecast, by Region 2020 & 2033
- Table 8: Global Probe Card Market Volume K Unit Forecast, by Region 2020 & 2033
- Table 9: Global Probe Card Market Revenue Million Forecast, by Technology 2020 & 2033
- Table 10: Global Probe Card Market Volume K Unit Forecast, by Technology 2020 & 2033
- Table 11: Global Probe Card Market Revenue Million Forecast, by Application 2020 & 2033
- Table 12: Global Probe Card Market Volume K Unit Forecast, by Application 2020 & 2033
- Table 13: Global Probe Card Market Revenue Million Forecast, by Type 2020 & 2033
- Table 14: Global Probe Card Market Volume K Unit Forecast, by Type 2020 & 2033
- Table 15: Global Probe Card Market Revenue Million Forecast, by Country 2020 & 2033
- Table 16: Global Probe Card Market Volume K Unit Forecast, by Country 2020 & 2033
- Table 17: Global Probe Card Market Revenue Million Forecast, by Technology 2020 & 2033
- Table 18: Global Probe Card Market Volume K Unit Forecast, by Technology 2020 & 2033
- Table 19: Global Probe Card Market Revenue Million Forecast, by Application 2020 & 2033
- Table 20: Global Probe Card Market Volume K Unit Forecast, by Application 2020 & 2033
- Table 21: Global Probe Card Market Revenue Million Forecast, by Type 2020 & 2033
- Table 22: Global Probe Card Market Volume K Unit Forecast, by Type 2020 & 2033
- Table 23: Global Probe Card Market Revenue Million Forecast, by Country 2020 & 2033
- Table 24: Global Probe Card Market Volume K Unit Forecast, by Country 2020 & 2033
- Table 25: Global Probe Card Market Revenue Million Forecast, by Technology 2020 & 2033
- Table 26: Global Probe Card Market Volume K Unit Forecast, by Technology 2020 & 2033
- Table 27: Global Probe Card Market Revenue Million Forecast, by Application 2020 & 2033
- Table 28: Global Probe Card Market Volume K Unit Forecast, by Application 2020 & 2033
- Table 29: Global Probe Card Market Revenue Million Forecast, by Type 2020 & 2033
- Table 30: Global Probe Card Market Volume K Unit Forecast, by Type 2020 & 2033
- Table 31: Global Probe Card Market Revenue Million Forecast, by Country 2020 & 2033
- Table 32: Global Probe Card Market Volume K Unit Forecast, by Country 2020 & 2033
- Table 33: Global Probe Card Market Revenue Million Forecast, by Technology 2020 & 2033
- Table 34: Global Probe Card Market Volume K Unit Forecast, by Technology 2020 & 2033
- Table 35: Global Probe Card Market Revenue Million Forecast, by Application 2020 & 2033
- Table 36: Global Probe Card Market Volume K Unit Forecast, by Application 2020 & 2033
- Table 37: Global Probe Card Market Revenue Million Forecast, by Type 2020 & 2033
- Table 38: Global Probe Card Market Volume K Unit Forecast, by Type 2020 & 2033
- Table 39: Global Probe Card Market Revenue Million Forecast, by Country 2020 & 2033
- Table 40: Global Probe Card Market Volume K Unit Forecast, by Country 2020 & 2033
- Table 41: Global Probe Card Market Revenue Million Forecast, by Technology 2020 & 2033
- Table 42: Global Probe Card Market Volume K Unit Forecast, by Technology 2020 & 2033
- Table 43: Global Probe Card Market Revenue Million Forecast, by Application 2020 & 2033
- Table 44: Global Probe Card Market Volume K Unit Forecast, by Application 2020 & 2033
- Table 45: Global Probe Card Market Revenue Million Forecast, by Type 2020 & 2033
- Table 46: Global Probe Card Market Volume K Unit Forecast, by Type 2020 & 2033
- Table 47: Global Probe Card Market Revenue Million Forecast, by Country 2020 & 2033
- Table 48: Global Probe Card Market Volume K Unit Forecast, by Country 2020 & 2033
- Table 49: Global Probe Card Market Revenue Million Forecast, by Technology 2020 & 2033
- Table 50: Global Probe Card Market Volume K Unit Forecast, by Technology 2020 & 2033
- Table 51: Global Probe Card Market Revenue Million Forecast, by Application 2020 & 2033
- Table 52: Global Probe Card Market Volume K Unit Forecast, by Application 2020 & 2033
- Table 53: Global Probe Card Market Revenue Million Forecast, by Type 2020 & 2033
- Table 54: Global Probe Card Market Volume K Unit Forecast, by Type 2020 & 2033
- Table 55: Global Probe Card Market Revenue Million Forecast, by Country 2020 & 2033
- Table 56: Global Probe Card Market Volume K Unit Forecast, by Country 2020 & 2033
Frequently Asked Questions
1. What is the projected Compound Annual Growth Rate (CAGR) of the Probe Card Market?
The projected CAGR is approximately 10.60%.
2. Which companies are prominent players in the Probe Card Market?
Key companies in the market include Nidec SV Probe, Protec Mems Technology, Willtechnology Co Ltd, Formfactor Inc, Wentworth Laboratories Inc, Japan Electronic Materials Corporation, Micronics Japan Co Ltd, TSE Co Lt, Feinmetall Gmbh, Star Technologies Inc, Technoprobe S P A, Mpi Corporation, GGB Industries Inc, Korea Instruments Co Ltd.
3. What are the main segments of the Probe Card Market?
The market segments include Technology, Application, Type.
4. Can you provide details about the market size?
The market size is estimated to be USD 2.05 Million as of 2022.
5. What are some drivers contributing to market growth?
Increase in Demand for Consumer Electronics and IOT; Miniaturization of Electronic Products; Technological Advancement And Innovations in Semiconductor Industry.
6. What are the notable trends driving market growth?
MEMS to Dominate the Technology Segment.
7. Are there any restraints impacting market growth?
High Costs Associated with Probe Cards; Lack of Awareness Among Consumers Regarding The Benefits of Probe Card Solution.
8. Can you provide examples of recent developments in the market?
April 2024 - FormFactor released a new presentation called COMPASS, focusing on maximizing CCC in a Probe Card and the journey toward an Unburnable Probe. The presentation explores different tactics for probe card design to enhance CCC to achieve an effective CCC above 2.5A at an 80-um minimum pitch. The strategies mentioned involve implementing new probe designs and architectural improvements to maintain probe integrity in high-stress, high-current conditions.
9. What pricing options are available for accessing the report?
Pricing options include single-user, multi-user, and enterprise licenses priced at USD 4750, USD 5250, and USD 8750 respectively.
10. Is the market size provided in terms of value or volume?
The market size is provided in terms of value, measured in Million and volume, measured in K Unit.
11. Are there any specific market keywords associated with the report?
Yes, the market keyword associated with the report is "Probe Card Market," which aids in identifying and referencing the specific market segment covered.
12. How do I determine which pricing option suits my needs best?
The pricing options vary based on user requirements and access needs. Individual users may opt for single-user licenses, while businesses requiring broader access may choose multi-user or enterprise licenses for cost-effective access to the report.
13. Are there any additional resources or data provided in the Probe Card Market report?
While the report offers comprehensive insights, it's advisable to review the specific contents or supplementary materials provided to ascertain if additional resources or data are available.
14. How can I stay updated on further developments or reports in the Probe Card Market?
To stay informed about further developments, trends, and reports in the Probe Card Market, consider subscribing to industry newsletters, following relevant companies and organizations, or regularly checking reputable industry news sources and publications.
Methodology
Step 1 - Identification of Relevant Samples Size from Population Database


Step 2 - Approaches for Defining Global Market Size (Value, Volume* & Price*)

Note*: In applicable scenarios
Step 3 - Data Sources
Primary Research
- Web Analytics
- Survey Reports
- Research Institute
- Latest Research Reports
- Opinion Leaders
Secondary Research
- Annual Reports
- White Paper
- Latest Press Release
- Industry Association
- Paid Database
- Investor Presentations

Step 4 - Data Triangulation
Involves using different sources of information in order to increase the validity of a study
These sources are likely to be stakeholders in a program - participants, other researchers, program staff, other community members, and so on.
Then we put all data in single framework & apply various statistical tools to find out the dynamic on the market.
During the analysis stage, feedback from the stakeholder groups would be compared to determine areas of agreement as well as areas of divergence