

Key Insights
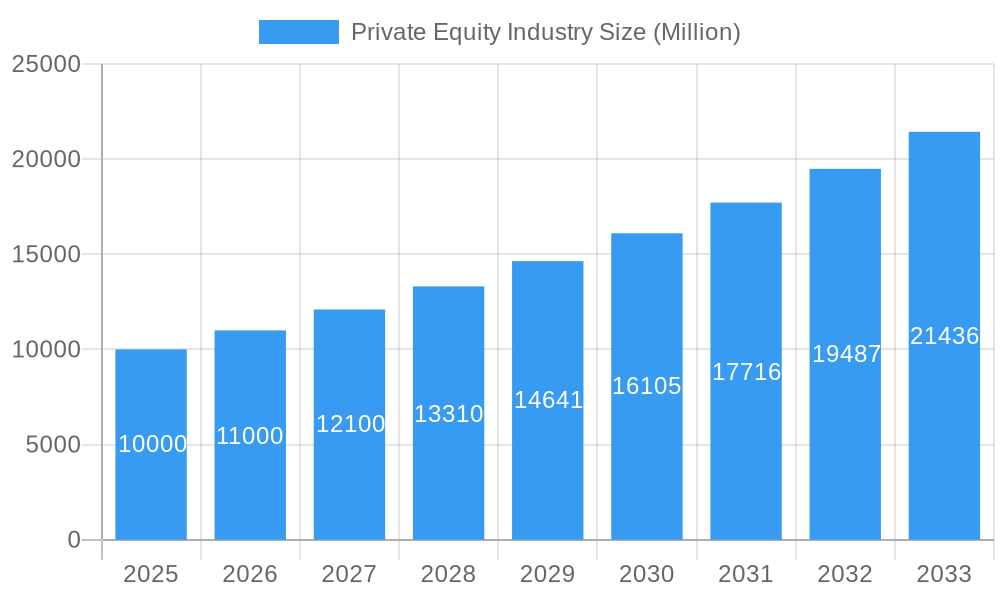
The private equity (PE) industry is experiencing robust growth, projected to maintain a compound annual growth rate (CAGR) exceeding 10% from 2025 to 2033. This expansion is driven by several key factors. Firstly, abundant capital available for investment fuels deal activity across various sectors. Technology, healthcare, and real estate remain dominant sectors attracting significant PE interest, reflecting ongoing digital transformation, aging populations, and sustained demand for property. Secondly, favorable macroeconomic conditions, although subject to cyclical fluctuations, generally support increased M&A activity and higher valuations. The trend toward larger PE funds further contributes to market growth, enabling larger investments in target companies. Finally, a rise in strategic partnerships between PE firms and corporate players is boosting deal flow and driving innovation within portfolio companies. Increased sophistication in deal structuring and operational improvements also enhances returns, making the asset class attractive to institutional investors.
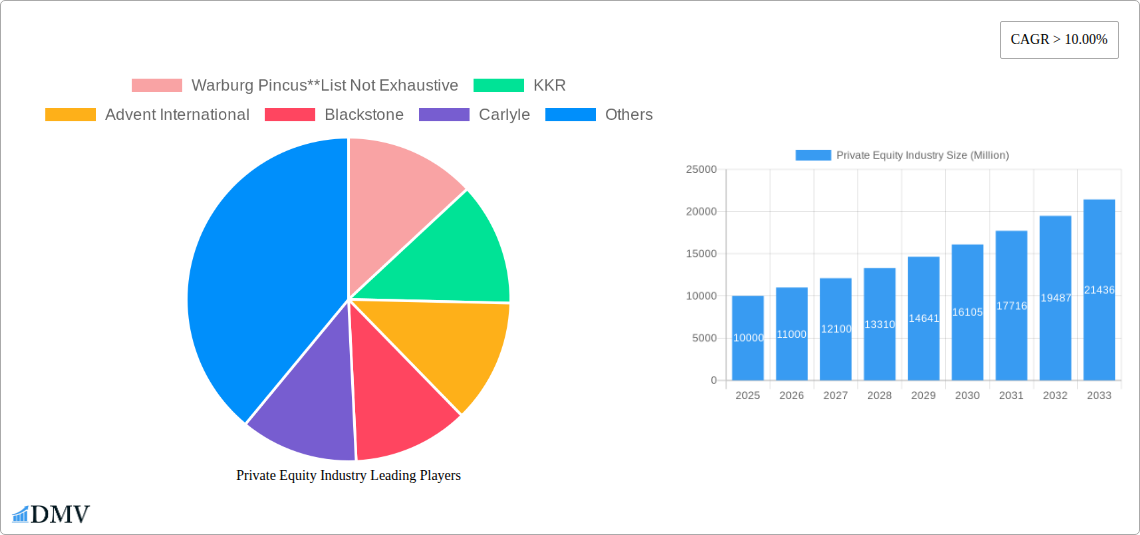
Private Equity Industry Market Size (In Billion)
However, the industry faces certain challenges. Regulatory scrutiny and increasing competition for attractive assets present headwinds. Interest rate hikes and potential economic downturns pose risks to deal valuations and investment returns. Geopolitical instability and supply chain disruptions can also affect investment decisions and portfolio company performance. Nevertheless, the long-term outlook remains positive, driven by the continued search for yield in a low-interest-rate environment and the ever-increasing demand for private market assets among institutional and high-net-worth investors. The diversification within the PE industry, encompassing buyout, venture capital, real estate, and infrastructure funds, adds further resilience and growth potential. The geographical spread of investment activity, across North America, Europe, Asia-Pacific, and other regions, demonstrates the global nature of the PE market and its capacity for sustained expansion. The focus on various market segments, from large-cap to lower middle-market investments, further illustrates the industry's adaptability and its ability to capitalize on opportunities across the investment spectrum.
Private Equity Industry Company Market Share
Private Equity Industry Market Report: 2019-2033
This comprehensive report provides a detailed analysis of the Private Equity industry, covering market trends, leading players, and future growth prospects from 2019 to 2033. With a base year of 2025 and a forecast period spanning 2025-2033, this study offers invaluable insights for stakeholders seeking to navigate the complexities of this dynamic sector. The report incorporates data from the historical period of 2019-2024, offering a complete picture of the industry's evolution. The report covers major players such as Warburg Pincus, KKR, Advent International, Blackstone, Carlyle, EnCap Investments, CVC Capital Partners, TPG Capital, Neuberger Berman, and Apollo Global Management, amongst others. Market sizing is estimated in Millions.
Private Equity Industry Market Composition & Trends
This section evaluates the market concentration, innovation drivers, regulatory landscape, substitute products, end-user profiles, and M&A activity within the Private Equity industry. The analysis examines market share distribution across different segments and analyzes the value of M&A deals, revealing key trends shaping the industry. The global private equity market witnessed significant consolidation during the study period, with the top 10 firms holding an estimated xx% market share in 2024.
- Market Concentration: High concentration among large players, with a few dominant firms controlling a substantial portion of the market.
- Innovation Catalysts: Technological advancements (e.g., AI-driven due diligence, data analytics) and evolving investment strategies drive innovation.
- Regulatory Landscape: Stringent regulations concerning investor protection and reporting requirements influence market dynamics.
- Substitute Products: Limited direct substitutes exist, but alternative investment options (e.g., hedge funds) offer competition.
- End-User Profiles: Primarily institutional investors (pension funds, endowments), high-net-worth individuals, and family offices.
- M&A Activities: Significant M&A activity, with deal values exceeding $xx Million in 2024, highlighting consolidation and expansion strategies. The average deal size increased by xx% from 2019 to 2024.
Private Equity Industry Industry Evolution
This section delves into the market's growth trajectories, technological advancements, and changing consumer demands. The analysis highlights specific data points, including growth rates and adoption metrics, providing a nuanced perspective on the industry's transformation. The private equity industry has experienced robust growth over the past decade, driven by factors such as increasing institutional investor participation and the rise of alternative asset classes. Technological advancements, such as improved data analytics and AI-driven due diligence, have streamlined processes and enhanced investment decision-making. Growth has been consistent across various segments, with the Buyout segment exhibiting the highest growth rate (xx%) from 2019 to 2024. However, regulatory changes and global economic uncertainties pose challenges to consistent growth.
Leading Regions, Countries, or Segments in Private Equity Industry
This section identifies the dominant regions, countries, and segments within the Private Equity industry, considering Fund Type (Buyout, Venture Capital, Real Estate, Infrastructure, Other), Sector (Technology, Healthcare, Real Estate & Services, Financial Services, Industrials, Consumer & Retail, Energy & Power, Media & Entertainment, Telecom, Others), and Investment Type (Large Cap, Upper Middle Market, Lower Middle Market, Real Estate). The analysis explores key drivers, such as investment trends and regulatory support, using bullet points and paragraphs. North America remains the leading region, with the United States and Canada accounting for a combined xx% of global Private Equity investments in 2024. Europe and Asia-Pacific are also important contributors, showing robust growth.
- Key Drivers (North America): Strong institutional investor base, developed financial markets, regulatory clarity, abundance of target companies.
- Key Drivers (Europe): Increasing cross-border investments, growing focus on sustainable investments, development of tech hubs.
- Key Drivers (Asia-Pacific): Rising middle class, expanding economies, government initiatives promoting private equity.
- Dominant Fund Type: Buyouts consistently hold the largest share of the market, driven by high returns and significant deal sizes.
- Dominant Sector: Technology and Healthcare are the leading investment sectors, propelled by innovation and high growth potential.
Private Equity Industry Product Innovations
Recent innovations include AI-powered due diligence tools, sophisticated risk management models, and the use of blockchain technology for increased transparency. These advancements enhance efficiency, reduce costs, and improve decision-making within the private equity industry. The focus is on developing bespoke investment strategies tailored to specific market segments and deploying advanced data analytics for better risk assessment. These technological upgrades are improving speed and accuracy and increasing the efficiency of deal-making processes.
Propelling Factors for Private Equity Industry Growth
Several factors contribute to the ongoing growth of the private equity industry. Technological advancements have improved efficiency and risk assessment. Favorable economic conditions, characterized by low interest rates and ample liquidity, have fueled investment activity. Furthermore, supportive regulatory frameworks in many jurisdictions have encouraged private equity investment. The increasing availability of data and analytical tools has further streamlined processes and improved investment decision-making.
Obstacles in the Private Equity Industry Market
The private equity industry faces several challenges. Increased regulatory scrutiny and stricter compliance requirements can increase costs and complexity. Geopolitical instability and supply chain disruptions present risks to portfolio companies. Intense competition among firms for attractive investment opportunities can lead to price wars and reduced returns. The rising cost of capital and a potential economic downturn could negatively impact the market.
Future Opportunities in Private Equity Industry
The private equity industry is poised for growth in emerging markets, particularly in Asia and Africa, where investment opportunities abound. Technological advancements, such as artificial intelligence and blockchain, will continue to revolutionize the industry. The increasing focus on ESG (Environmental, Social, and Governance) factors will create new investment opportunities in sustainable and responsible businesses. The expansion into alternative asset classes, such as infrastructure and renewable energy, presents significant potential for growth.
Major Players in the Private Equity Industry Ecosystem
- Warburg Pincus
- KKR
- Advent International
- Blackstone
- Carlyle
- EnCap Investments
- CVC Capital Partners
- TPG Capital
- Neuberger Berman
- Apollo Global Management
Key Developments in Private Equity Industry Industry
- September 2022: Nonantum Capital Partners acquired LJP Waste Solutions, reflecting increased interest in sustainable waste management solutions.
- August 2022: Prosus Ventures and PayU India's acquisition of BillDesk for USD 4.7 Billion marked a record-breaking deal in India's digital payments sector, demonstrating significant investor confidence in the Indian market.
Strategic Private Equity Industry Market Forecast
The private equity industry is expected to witness continued growth over the forecast period (2025-2033), driven by factors such as increasing institutional investor participation, technological advancements, and a focus on sustainable investments. Emerging markets and alternative asset classes represent significant growth opportunities. While regulatory challenges and economic uncertainties pose risks, the long-term outlook for the private equity industry remains positive, with the market size projected to reach $xx Million by 2033.
Private Equity Industry Segmentation
-
1. Fund Type
- 1.1. Buyout
- 1.2. Venture Capital (VCs)
- 1.3. Real Estate
- 1.4. Infrastructure
- 1.5. Other (Distressed PE, Direct Lending, etc.)
-
2. Sector
- 2.1. Technology (Software)
- 2.2. Healthcare
- 2.3. Real Estate and Services
- 2.4. Financial Services
- 2.5. Industrials
- 2.6. Consumer & Retail
- 2.7. Energy & Power
- 2.8. Media & Entertainment
- 2.9. Telecom
- 2.10. Others (Transportation, etc.)
-
3. Investments
- 3.1. Large Cap
- 3.2. Upper Middle Market
- 3.3. Lower Middle Market
- 3.4. Real Estate
Private Equity Industry Segmentation By Geography
- 1. North America
- 2. Europe
- 3. Asia Pacific
- 4. Latin America
- 5. Middle East
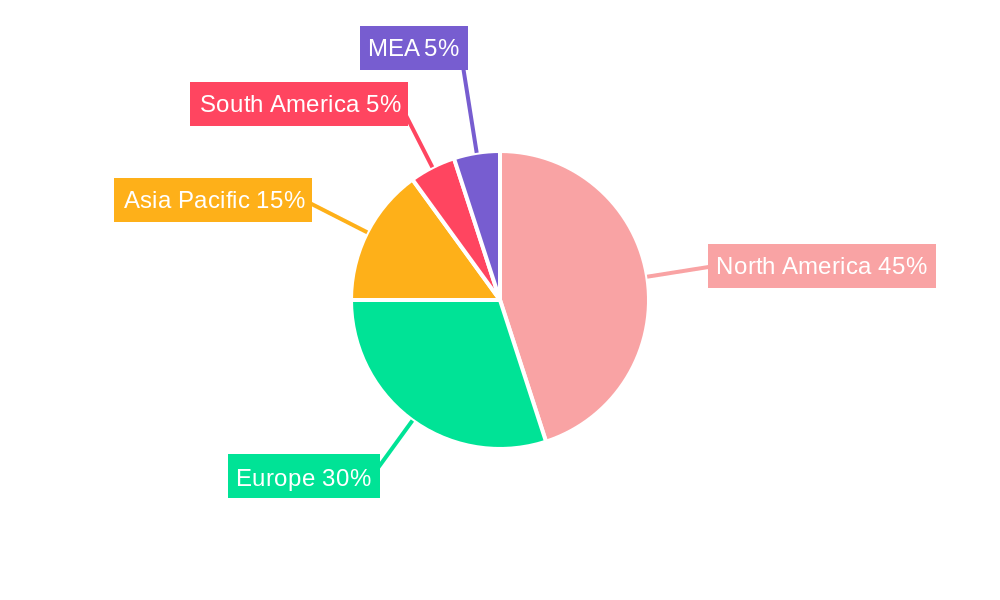
Private Equity Industry Regional Market Share
Geographic Coverage of Private Equity Industry
Private Equity Industry REPORT HIGHLIGHTS
| Aspects | Details |
|---|---|
| Study Period | 2020-2034 |
| Base Year | 2025 |
| Estimated Year | 2026 |
| Forecast Period | 2026-2034 |
| Historical Period | 2020-2025 |
| Growth Rate | CAGR of 11% from 2020-2034 |
| Segmentation |
|
Table of Contents
- 1. Introduction
- 1.1. Research Scope
- 1.2. Market Segmentation
- 1.3. Research Objective
- 1.4. Definitions and Assumptions
- 2. Executive Summary
- 2.1. Market Snapshot
- 3. Market Dynamics
- 3.1. Market Drivers
- 3.2. Market Restrains
- 3.3. Market Trends
- 3.4. Market Opportunities
- 4. Market Factor Analysis
- 4.1. Porters Five Forces
- 4.1.1. Bargaining Power of Suppliers
- 4.1.2. Bargaining Power of Buyers
- 4.1.3. Threat of New Entrants
- 4.1.4. Threat of Substitutes
- 4.1.5. Competitive Rivalry
- 4.2. PESTEL analysis
- 4.3. BCG Analysis
- 4.3.1. Stars (High Growth, High Market Share)
- 4.3.2. Cash Cows (Low Growth, High Market Share)
- 4.3.3. Question Mark (High Growth, Low Market Share)
- 4.3.4. Dogs (Low Growth, Low Market Share)
- 4.4. Ansoff Matrix Analysis
- 4.5. Supply Chain Analysis
- 4.6. Regulatory Landscape
- 4.7. Current Market Potential and Opportunity Assessment (TAM–SAM–SOM Framework)
- 4.8. DMV Analyst Note
- 4.1. Porters Five Forces
- 5. Market Analysis, Insights and Forecast 2021-2033
- 5.1. Market Analysis, Insights and Forecast - by Fund Type
- 5.1.1. Buyout
- 5.1.2. Venture Capital (VCs)
- 5.1.3. Real Estate
- 5.1.4. Infrastructure
- 5.1.5. Other (Distressed PE, Direct Lending, etc.)
- 5.2. Market Analysis, Insights and Forecast - by Sector
- 5.2.1. Technology (Software)
- 5.2.2. Healthcare
- 5.2.3. Real Estate and Services
- 5.2.4. Financial Services
- 5.2.5. Industrials
- 5.2.6. Consumer & Retail
- 5.2.7. Energy & Power
- 5.2.8. Media & Entertainment
- 5.2.9. Telecom
- 5.2.10. Others (Transportation, etc.)
- 5.3. Market Analysis, Insights and Forecast - by Investments
- 5.3.1. Large Cap
- 5.3.2. Upper Middle Market
- 5.3.3. Lower Middle Market
- 5.3.4. Real Estate
- 5.4. Market Analysis, Insights and Forecast - by Region
- 5.4.1. North America
- 5.4.2. Europe
- 5.4.3. Asia Pacific
- 5.4.4. Latin America
- 5.4.5. Middle East
- 5.1. Market Analysis, Insights and Forecast - by Fund Type
- 6. Global Private Equity Industry Analysis, Insights and Forecast, 2021-2033
- 6.1. Market Analysis, Insights and Forecast - by Fund Type
- 6.1.1. Buyout
- 6.1.2. Venture Capital (VCs)
- 6.1.3. Real Estate
- 6.1.4. Infrastructure
- 6.1.5. Other (Distressed PE, Direct Lending, etc.)
- 6.2. Market Analysis, Insights and Forecast - by Sector
- 6.2.1. Technology (Software)
- 6.2.2. Healthcare
- 6.2.3. Real Estate and Services
- 6.2.4. Financial Services
- 6.2.5. Industrials
- 6.2.6. Consumer & Retail
- 6.2.7. Energy & Power
- 6.2.8. Media & Entertainment
- 6.2.9. Telecom
- 6.2.10. Others (Transportation, etc.)
- 6.3. Market Analysis, Insights and Forecast - by Investments
- 6.3.1. Large Cap
- 6.3.2. Upper Middle Market
- 6.3.3. Lower Middle Market
- 6.3.4. Real Estate
- 6.1. Market Analysis, Insights and Forecast - by Fund Type
- 7. North America Private Equity Industry Analysis, Insights and Forecast, 2020-2032
- 7.1. Market Analysis, Insights and Forecast - by Fund Type
- 7.1.1. Buyout
- 7.1.2. Venture Capital (VCs)
- 7.1.3. Real Estate
- 7.1.4. Infrastructure
- 7.1.5. Other (Distressed PE, Direct Lending, etc.)
- 7.2. Market Analysis, Insights and Forecast - by Sector
- 7.2.1. Technology (Software)
- 7.2.2. Healthcare
- 7.2.3. Real Estate and Services
- 7.2.4. Financial Services
- 7.2.5. Industrials
- 7.2.6. Consumer & Retail
- 7.2.7. Energy & Power
- 7.2.8. Media & Entertainment
- 7.2.9. Telecom
- 7.2.10. Others (Transportation, etc.)
- 7.3. Market Analysis, Insights and Forecast - by Investments
- 7.3.1. Large Cap
- 7.3.2. Upper Middle Market
- 7.3.3. Lower Middle Market
- 7.3.4. Real Estate
- 7.1. Market Analysis, Insights and Forecast - by Fund Type
- 8. Europe Private Equity Industry Analysis, Insights and Forecast, 2020-2032
- 8.1. Market Analysis, Insights and Forecast - by Fund Type
- 8.1.1. Buyout
- 8.1.2. Venture Capital (VCs)
- 8.1.3. Real Estate
- 8.1.4. Infrastructure
- 8.1.5. Other (Distressed PE, Direct Lending, etc.)
- 8.2. Market Analysis, Insights and Forecast - by Sector
- 8.2.1. Technology (Software)
- 8.2.2. Healthcare
- 8.2.3. Real Estate and Services
- 8.2.4. Financial Services
- 8.2.5. Industrials
- 8.2.6. Consumer & Retail
- 8.2.7. Energy & Power
- 8.2.8. Media & Entertainment
- 8.2.9. Telecom
- 8.2.10. Others (Transportation, etc.)
- 8.3. Market Analysis, Insights and Forecast - by Investments
- 8.3.1. Large Cap
- 8.3.2. Upper Middle Market
- 8.3.3. Lower Middle Market
- 8.3.4. Real Estate
- 8.1. Market Analysis, Insights and Forecast - by Fund Type
- 9. Asia Pacific Private Equity Industry Analysis, Insights and Forecast, 2020-2032
- 9.1. Market Analysis, Insights and Forecast - by Fund Type
- 9.1.1. Buyout
- 9.1.2. Venture Capital (VCs)
- 9.1.3. Real Estate
- 9.1.4. Infrastructure
- 9.1.5. Other (Distressed PE, Direct Lending, etc.)
- 9.2. Market Analysis, Insights and Forecast - by Sector
- 9.2.1. Technology (Software)
- 9.2.2. Healthcare
- 9.2.3. Real Estate and Services
- 9.2.4. Financial Services
- 9.2.5. Industrials
- 9.2.6. Consumer & Retail
- 9.2.7. Energy & Power
- 9.2.8. Media & Entertainment
- 9.2.9. Telecom
- 9.2.10. Others (Transportation, etc.)
- 9.3. Market Analysis, Insights and Forecast - by Investments
- 9.3.1. Large Cap
- 9.3.2. Upper Middle Market
- 9.3.3. Lower Middle Market
- 9.3.4. Real Estate
- 9.1. Market Analysis, Insights and Forecast - by Fund Type
- 10. Latin America Private Equity Industry Analysis, Insights and Forecast, 2020-2032
- 10.1. Market Analysis, Insights and Forecast - by Fund Type
- 10.1.1. Buyout
- 10.1.2. Venture Capital (VCs)
- 10.1.3. Real Estate
- 10.1.4. Infrastructure
- 10.1.5. Other (Distressed PE, Direct Lending, etc.)
- 10.2. Market Analysis, Insights and Forecast - by Sector
- 10.2.1. Technology (Software)
- 10.2.2. Healthcare
- 10.2.3. Real Estate and Services
- 10.2.4. Financial Services
- 10.2.5. Industrials
- 10.2.6. Consumer & Retail
- 10.2.7. Energy & Power
- 10.2.8. Media & Entertainment
- 10.2.9. Telecom
- 10.2.10. Others (Transportation, etc.)
- 10.3. Market Analysis, Insights and Forecast - by Investments
- 10.3.1. Large Cap
- 10.3.2. Upper Middle Market
- 10.3.3. Lower Middle Market
- 10.3.4. Real Estate
- 10.1. Market Analysis, Insights and Forecast - by Fund Type
- 11. Middle East Private Equity Industry Analysis, Insights and Forecast, 2020-2032
- 11.1. Market Analysis, Insights and Forecast - by Fund Type
- 11.1.1. Buyout
- 11.1.2. Venture Capital (VCs)
- 11.1.3. Real Estate
- 11.1.4. Infrastructure
- 11.1.5. Other (Distressed PE, Direct Lending, etc.)
- 11.2. Market Analysis, Insights and Forecast - by Sector
- 11.2.1. Technology (Software)
- 11.2.2. Healthcare
- 11.2.3. Real Estate and Services
- 11.2.4. Financial Services
- 11.2.5. Industrials
- 11.2.6. Consumer & Retail
- 11.2.7. Energy & Power
- 11.2.8. Media & Entertainment
- 11.2.9. Telecom
- 11.2.10. Others (Transportation, etc.)
- 11.3. Market Analysis, Insights and Forecast - by Investments
- 11.3.1. Large Cap
- 11.3.2. Upper Middle Market
- 11.3.3. Lower Middle Market
- 11.3.4. Real Estate
- 11.1. Market Analysis, Insights and Forecast - by Fund Type
- 12. Competitive Analysis
- 12.1. Company Profiles
- 12.1.1 Warburg Pincus**List Not Exhaustive
- 12.1.1.1. Company Overview
- 12.1.1.2. Products
- 12.1.1.3. Company Financials
- 12.1.1.4. SWOT Analysis
- 12.1.2 KKR
- 12.1.2.1. Company Overview
- 12.1.2.2. Products
- 12.1.2.3. Company Financials
- 12.1.2.4. SWOT Analysis
- 12.1.3 Advent International
- 12.1.3.1. Company Overview
- 12.1.3.2. Products
- 12.1.3.3. Company Financials
- 12.1.3.4. SWOT Analysis
- 12.1.4 Blackstone
- 12.1.4.1. Company Overview
- 12.1.4.2. Products
- 12.1.4.3. Company Financials
- 12.1.4.4. SWOT Analysis
- 12.1.5 Carlyle
- 12.1.5.1. Company Overview
- 12.1.5.2. Products
- 12.1.5.3. Company Financials
- 12.1.5.4. SWOT Analysis
- 12.1.6 EnCap Investments
- 12.1.6.1. Company Overview
- 12.1.6.2. Products
- 12.1.6.3. Company Financials
- 12.1.6.4. SWOT Analysis
- 12.1.7 CVC Capital Partners
- 12.1.7.1. Company Overview
- 12.1.7.2. Products
- 12.1.7.3. Company Financials
- 12.1.7.4. SWOT Analysis
- 12.1.8 TPG Capital
- 12.1.8.1. Company Overview
- 12.1.8.2. Products
- 12.1.8.3. Company Financials
- 12.1.8.4. SWOT Analysis
- 12.1.9 Neuberger Berman
- 12.1.9.1. Company Overview
- 12.1.9.2. Products
- 12.1.9.3. Company Financials
- 12.1.9.4. SWOT Analysis
- 12.1.10 Apollo Global Management
- 12.1.10.1. Company Overview
- 12.1.10.2. Products
- 12.1.10.3. Company Financials
- 12.1.10.4. SWOT Analysis
- 12.1.1 Warburg Pincus**List Not Exhaustive
- 12.2. Market Entropy
- 12.2.1 Company's Key Areas Served
- 12.2.2 Recent Developments
- 12.3. Company Market Share Analysis 2025
- 12.3.1 Top 5 Companies Market Share Analysis
- 12.3.2 Top 3 Companies Market Share Analysis
- 12.4. List of Potential Customers
- 13. Research Methodology
List of Figures
- Figure 1: Global Private Equity Industry Revenue Breakdown (billion, %) by Region 2025 & 2033
- Figure 2: North America Private Equity Industry Revenue (billion), by Fund Type 2025 & 2033
- Figure 3: North America Private Equity Industry Revenue Share (%), by Fund Type 2025 & 2033
- Figure 4: North America Private Equity Industry Revenue (billion), by Sector 2025 & 2033
- Figure 5: North America Private Equity Industry Revenue Share (%), by Sector 2025 & 2033
- Figure 6: North America Private Equity Industry Revenue (billion), by Investments 2025 & 2033
- Figure 7: North America Private Equity Industry Revenue Share (%), by Investments 2025 & 2033
- Figure 8: North America Private Equity Industry Revenue (billion), by Country 2025 & 2033
- Figure 9: North America Private Equity Industry Revenue Share (%), by Country 2025 & 2033
- Figure 10: Europe Private Equity Industry Revenue (billion), by Fund Type 2025 & 2033
- Figure 11: Europe Private Equity Industry Revenue Share (%), by Fund Type 2025 & 2033
- Figure 12: Europe Private Equity Industry Revenue (billion), by Sector 2025 & 2033
- Figure 13: Europe Private Equity Industry Revenue Share (%), by Sector 2025 & 2033
- Figure 14: Europe Private Equity Industry Revenue (billion), by Investments 2025 & 2033
- Figure 15: Europe Private Equity Industry Revenue Share (%), by Investments 2025 & 2033
- Figure 16: Europe Private Equity Industry Revenue (billion), by Country 2025 & 2033
- Figure 17: Europe Private Equity Industry Revenue Share (%), by Country 2025 & 2033
- Figure 18: Asia Pacific Private Equity Industry Revenue (billion), by Fund Type 2025 & 2033
- Figure 19: Asia Pacific Private Equity Industry Revenue Share (%), by Fund Type 2025 & 2033
- Figure 20: Asia Pacific Private Equity Industry Revenue (billion), by Sector 2025 & 2033
- Figure 21: Asia Pacific Private Equity Industry Revenue Share (%), by Sector 2025 & 2033
- Figure 22: Asia Pacific Private Equity Industry Revenue (billion), by Investments 2025 & 2033
- Figure 23: Asia Pacific Private Equity Industry Revenue Share (%), by Investments 2025 & 2033
- Figure 24: Asia Pacific Private Equity Industry Revenue (billion), by Country 2025 & 2033
- Figure 25: Asia Pacific Private Equity Industry Revenue Share (%), by Country 2025 & 2033
- Figure 26: Latin America Private Equity Industry Revenue (billion), by Fund Type 2025 & 2033
- Figure 27: Latin America Private Equity Industry Revenue Share (%), by Fund Type 2025 & 2033
- Figure 28: Latin America Private Equity Industry Revenue (billion), by Sector 2025 & 2033
- Figure 29: Latin America Private Equity Industry Revenue Share (%), by Sector 2025 & 2033
- Figure 30: Latin America Private Equity Industry Revenue (billion), by Investments 2025 & 2033
- Figure 31: Latin America Private Equity Industry Revenue Share (%), by Investments 2025 & 2033
- Figure 32: Latin America Private Equity Industry Revenue (billion), by Country 2025 & 2033
- Figure 33: Latin America Private Equity Industry Revenue Share (%), by Country 2025 & 2033
- Figure 34: Middle East Private Equity Industry Revenue (billion), by Fund Type 2025 & 2033
- Figure 35: Middle East Private Equity Industry Revenue Share (%), by Fund Type 2025 & 2033
- Figure 36: Middle East Private Equity Industry Revenue (billion), by Sector 2025 & 2033
- Figure 37: Middle East Private Equity Industry Revenue Share (%), by Sector 2025 & 2033
- Figure 38: Middle East Private Equity Industry Revenue (billion), by Investments 2025 & 2033
- Figure 39: Middle East Private Equity Industry Revenue Share (%), by Investments 2025 & 2033
- Figure 40: Middle East Private Equity Industry Revenue (billion), by Country 2025 & 2033
- Figure 41: Middle East Private Equity Industry Revenue Share (%), by Country 2025 & 2033
List of Tables
- Table 1: Global Private Equity Industry Revenue billion Forecast, by Fund Type 2020 & 2033
- Table 2: Global Private Equity Industry Revenue billion Forecast, by Sector 2020 & 2033
- Table 3: Global Private Equity Industry Revenue billion Forecast, by Investments 2020 & 2033
- Table 4: Global Private Equity Industry Revenue billion Forecast, by Region 2020 & 2033
- Table 5: Global Private Equity Industry Revenue billion Forecast, by Fund Type 2020 & 2033
- Table 6: Global Private Equity Industry Revenue billion Forecast, by Sector 2020 & 2033
- Table 7: Global Private Equity Industry Revenue billion Forecast, by Investments 2020 & 2033
- Table 8: Global Private Equity Industry Revenue billion Forecast, by Country 2020 & 2033
- Table 9: Global Private Equity Industry Revenue billion Forecast, by Fund Type 2020 & 2033
- Table 10: Global Private Equity Industry Revenue billion Forecast, by Sector 2020 & 2033
- Table 11: Global Private Equity Industry Revenue billion Forecast, by Investments 2020 & 2033
- Table 12: Global Private Equity Industry Revenue billion Forecast, by Country 2020 & 2033
- Table 13: Global Private Equity Industry Revenue billion Forecast, by Fund Type 2020 & 2033
- Table 14: Global Private Equity Industry Revenue billion Forecast, by Sector 2020 & 2033
- Table 15: Global Private Equity Industry Revenue billion Forecast, by Investments 2020 & 2033
- Table 16: Global Private Equity Industry Revenue billion Forecast, by Country 2020 & 2033
- Table 17: Global Private Equity Industry Revenue billion Forecast, by Fund Type 2020 & 2033
- Table 18: Global Private Equity Industry Revenue billion Forecast, by Sector 2020 & 2033
- Table 19: Global Private Equity Industry Revenue billion Forecast, by Investments 2020 & 2033
- Table 20: Global Private Equity Industry Revenue billion Forecast, by Country 2020 & 2033
- Table 21: Global Private Equity Industry Revenue billion Forecast, by Fund Type 2020 & 2033
- Table 22: Global Private Equity Industry Revenue billion Forecast, by Sector 2020 & 2033
- Table 23: Global Private Equity Industry Revenue billion Forecast, by Investments 2020 & 2033
- Table 24: Global Private Equity Industry Revenue billion Forecast, by Country 2020 & 2033
Frequently Asked Questions
1. What is the projected Compound Annual Growth Rate (CAGR) of the Private Equity Industry?
The projected CAGR is approximately 11%.
2. Which companies are prominent players in the Private Equity Industry?
Key companies in the market include Warburg Pincus**List Not Exhaustive, KKR, Advent International, Blackstone, Carlyle, EnCap Investments, CVC Capital Partners, TPG Capital, Neuberger Berman, Apollo Global Management.
3. What are the main segments of the Private Equity Industry?
The market segments include Fund Type, Sector, Investments.
4. Can you provide details about the market size?
The market size is estimated to be USD 460 billion as of 2022.
5. What are some drivers contributing to market growth?
Increasing Adoption of Innovative Tracking Technologies.
6. What are the notable trends driving market growth?
Growth Investments Have Become Larger and More Complex.
7. Are there any restraints impacting market growth?
Rising Competition of Banks with Fintech and Financial Services.
8. Can you provide examples of recent developments in the market?
September 2022: Nonantum Capital Partners, a middle-market private equity firm, today announced the acquisition of LJP Waste Solutions ("LJP") from Aperion Management. LJP is a leading regional provider of non-hazardous solid waste and recycling services specializing in zero landfill and waste-to-energy solutions.
9. What pricing options are available for accessing the report?
Pricing options include single-user, multi-user, and enterprise licenses priced at USD 4750, USD 5250, and USD 8750 respectively.
10. Is the market size provided in terms of value or volume?
The market size is provided in terms of value, measured in billion.
11. Are there any specific market keywords associated with the report?
Yes, the market keyword associated with the report is "Private Equity Industry," which aids in identifying and referencing the specific market segment covered.
12. How do I determine which pricing option suits my needs best?
The pricing options vary based on user requirements and access needs. Individual users may opt for single-user licenses, while businesses requiring broader access may choose multi-user or enterprise licenses for cost-effective access to the report.
13. Are there any additional resources or data provided in the Private Equity Industry report?
While the report offers comprehensive insights, it's advisable to review the specific contents or supplementary materials provided to ascertain if additional resources or data are available.
14. How can I stay updated on further developments or reports in the Private Equity Industry?
To stay informed about further developments, trends, and reports in the Private Equity Industry, consider subscribing to industry newsletters, following relevant companies and organizations, or regularly checking reputable industry news sources and publications.
Methodology
Step 1 - Identification of Relevant Samples Size from Population Database


Step 2 - Approaches for Defining Global Market Size (Value, Volume* & Price*)

Note*: In applicable scenarios
Step 3 - Data Sources
Primary Research
- Web Analytics
- Survey Reports
- Research Institute
- Latest Research Reports
- Opinion Leaders
Secondary Research
- Annual Reports
- White Paper
- Latest Press Release
- Industry Association
- Paid Database
- Investor Presentations

Step 4 - Data Triangulation
Involves using different sources of information in order to increase the validity of a study
These sources are likely to be stakeholders in a program - participants, other researchers, program staff, other community members, and so on.
Then we put all data in single framework & apply various statistical tools to find out the dynamic on the market.
During the analysis stage, feedback from the stakeholder groups would be compared to determine areas of agreement as well as areas of divergence