

Key Insights
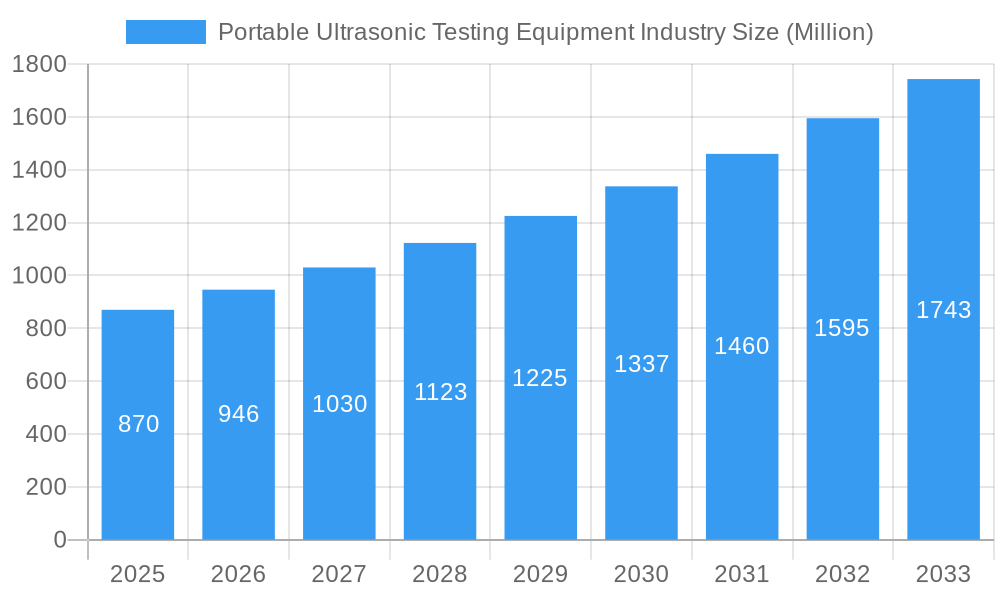
The portable ultrasonic testing (UT) equipment market, valued at $0.87 billion in 2025, is projected to experience robust growth, driven by increasing demand across diverse sectors. A compound annual growth rate (CAGR) of 8.79% from 2025 to 2033 signifies a significant expansion, fueled by several key factors. The rising adoption of non-destructive testing (NDT) methods in industries like aerospace, automotive, and energy for quality control and preventative maintenance is a primary driver. Stringent safety regulations and the need to minimize downtime are also contributing to market growth. Technological advancements, such as the development of more portable, user-friendly, and sophisticated UT equipment with improved accuracy and faster data processing, are further enhancing market appeal. The market segmentation reveals a strong demand for both manual and automated UT equipment, with handheld devices gaining popularity due to their ease of use and portability in various field applications. While the North American and European markets currently hold significant shares, the Asia-Pacific region is poised for rapid expansion driven by industrialization and infrastructure development.
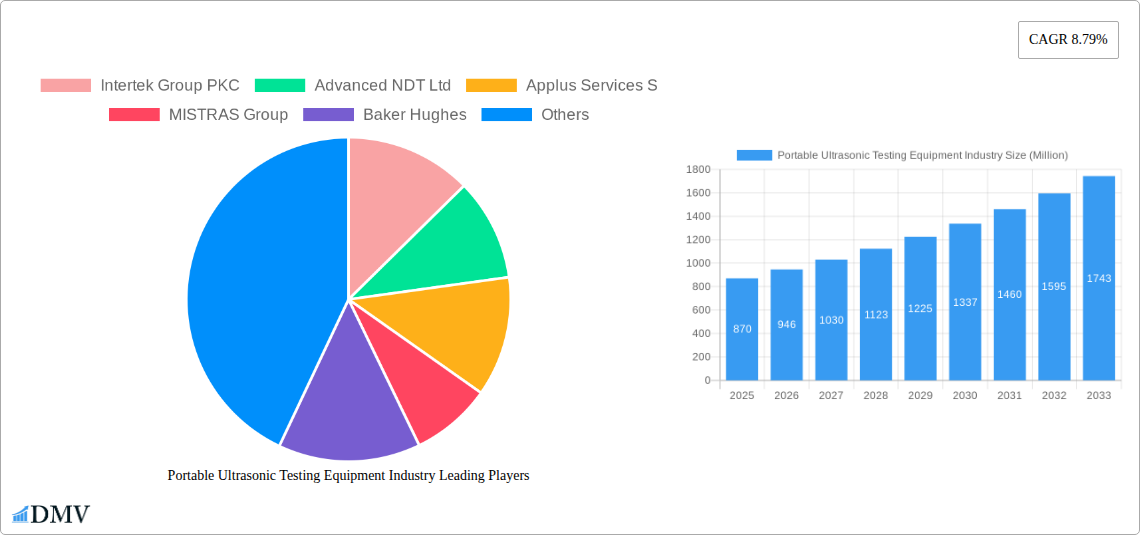
Portable Ultrasonic Testing Equipment Industry Market Size (In Million)
Growth within the portable ultrasonic testing equipment market is expected to remain steady throughout the forecast period (2025-2033). While the automotive and manufacturing sectors are significant contributors, the expanding renewable energy sector, particularly wind turbine inspection and maintenance, presents a lucrative opportunity. However, factors such as the high initial investment cost of advanced UT equipment and the need for skilled personnel to operate these systems could act as potential restraints. Nonetheless, the overall market outlook remains positive, with the continuous development of cost-effective solutions and training programs addressing these challenges. Competitive landscape analysis shows that the market comprises both large multinational corporations and specialized NDT service providers, fostering innovation and competition, ultimately benefitting end-users with improved product availability and enhanced technological capabilities.
Portable Ultrasonic Testing Equipment Industry Company Market Share
Portable Ultrasonic Testing Equipment Industry Market Report: 2019-2033
This comprehensive report provides a detailed analysis of the Portable Ultrasonic Testing Equipment industry, covering market size, growth drivers, key players, and future trends. The study period spans from 2019 to 2033, with 2025 serving as both the base and estimated year. The report projects robust growth, with the market expected to reach xx Million by 2033.
Portable Ultrasonic Testing Equipment Industry Market Composition & Trends
The global portable ultrasonic testing equipment market is characterized by moderate concentration, with key players holding significant market share. However, the entry of smaller, specialized firms with innovative solutions is increasing competition. Market share distribution is currently estimated as follows:
- Top 5 players: 55%
- Next 10 players: 30%
- Remaining players: 15%
Innovation in areas like phased array technology and advanced data analysis is driving market growth. Regulatory frameworks, particularly regarding safety and quality control in various industries, significantly impact market dynamics. Substitute technologies, while available, often lack the precision and portability of ultrasonic testing. The primary end-users are across the aerospace, automotive, energy, and manufacturing sectors, with increasing adoption in construction and infrastructure. M&A activity has been moderate, with deal values averaging approximately xx Million in recent years. Notable transactions include [Insert specific examples of M&A deals if available, otherwise state "data unavailable"].
Portable Ultrasonic Testing Equipment Industry Industry Evolution
The portable ultrasonic testing (PUT) equipment market is on a robust growth trajectory, fueled by an escalating need for effective non-destructive testing (NDT) solutions across a multitude of industries. Between 2019 and 2024, the market experienced a significant Compound Annual Growth Rate (CAGR) of [Insert 2019-2024 CAGR Here]%. This upward momentum is projected to continue, with a forecasted CAGR of [Insert 2025-2033 CAGR Here]% from 2025 to 2033, propelling the market value to an estimated [Insert Market Value in Million Here] Million. The driving forces behind this expansion are continuous technological advancements, particularly the integration of artificial intelligence (AI) for enhanced data analysis and interpretation, and the development of more sensitive and reliable sensor technologies. These innovations are collectively contributing to increased accuracy, improved efficiency, and greater portability of PUT devices.
The market is also witnessing a pronounced shift towards the adoption of automated and intuitive handheld equipment. This preference is driven by their inherent ease of use, streamlined data acquisition capabilities, and the growing demand for real-time data analysis, enabling swift decision-making. Furthermore, the increasing emphasis on remote monitoring capabilities and the desire for user-friendly interfaces are shaping product development. Developed economies, with their higher awareness of NDT benefits and stringent quality control regulations, continue to lead adoption rates. The pervasive influence of Industry 4.0 principles is further accelerating market growth, evidenced by substantial investments in the digitalization and automation of NDT processes.
Leading Regions, Countries, or Segments in Portable Ultrasonic Testing Equipment Industry
Dominant Region: North America currently holds the largest market share due to high technological advancements, stringent quality control regulations, and significant investments in infrastructure projects. Europe follows closely, driven by similar factors. The Asia-Pacific region is witnessing significant growth potential, fueled by rapid industrialization and infrastructure development.
Dominant Product Type: Handheld ultrasonic testing equipment currently dominates the market due to its versatility, ease of use, and affordability. However, the Automated Ultrasonic Testing Equipment segment is exhibiting the highest growth rate due to increasing demand for efficient and precise testing in high-volume manufacturing.
Dominant Application: The manufacturing sector, including automotive and aerospace, represents the largest application segment due to the high demand for quality control in production processes. The energy sector is also a significant growth driver, driven by the need for inspection and maintenance of pipelines, power plants, and other critical infrastructure.
Key Drivers:
- North America: Stringent regulations, high adoption of advanced technologies, and substantial investment in infrastructure projects.
- Europe: Growing awareness of safety standards, emphasis on preventative maintenance, and increasing investments in research and development.
- Asia-Pacific: Rapid industrialization, expanding manufacturing sector, and growing infrastructure development.
Portable Ultrasonic Testing Equipment Industry Product Innovations
Recent product innovations focus on improving portability, accuracy, and data analysis capabilities. Miniaturized sensors, advanced signal processing algorithms, and integrated data logging features are enhancing the efficiency and user-friendliness of portable ultrasonic testing equipment. The incorporation of phased array technology enables faster and more comprehensive inspections, while cloud-based data management systems facilitate remote monitoring and collaboration. Unique selling propositions include improved image resolution, enhanced defect detection capabilities, and user-friendly software interfaces.
Propelling Factors for Portable Ultrasonic Testing Equipment Industry Growth
The market is driven by a confluence of factors: increasing demand for non-destructive testing in various industries; stringent regulatory standards emphasizing safety and quality control; technological advancements leading to improved accuracy and portability of testing equipment; and rising investments in infrastructure projects globally. The development and adoption of advanced materials, such as composites and high-strength alloys, necessitate robust NDT methods, further fueling the demand.
Obstacles in the Portable Ultrasonic Testing Equipment Industry Market
Despite the promising growth, several key barriers temper the progress of the portable ultrasonic testing equipment market. A significant hurdle is the substantial initial investment required for acquiring advanced and sophisticated equipment. Furthermore, potential disruptions in global supply chains can impact the availability of critical components, leading to production delays and cost fluctuations. The market also faces intense competition from both well-established manufacturers and agile emerging players, necessitating continuous innovation and competitive pricing strategies. A crucial challenge remains the availability of highly skilled personnel capable of operating complex PUT systems and accurately interpreting the acquired data. Additionally, prevailing global economic uncertainties may exert a restraining influence on market expansion.
Future Opportunities in Portable Ultrasonic Testing Equipment Industry
The future landscape for portable ultrasonic testing equipment is rich with opportunity. A primary focus for growth lies in the development of even more portable, user-friendly, and cost-effective solutions that cater to a broader range of applications and user skill levels. Significant potential exists in expanding market penetration into emerging economies that are experiencing robust industrial growth and substantial infrastructure development. The ongoing integration of cutting-edge technologies, including advanced AI algorithms and machine learning models, promises to revolutionize the accuracy, efficiency, and analytical capabilities of these devices, enabling predictive maintenance and proactive asset management.
Major Players in the Portable Ultrasonic Testing Equipment Industry Ecosystem
- Intertek Group PLC
- Advanced NDT Ltd
- Applus Services S.A.
- MISTRAS Group
- Baker Hughes
- Russell Fraser Sales Pty Ltd
- OkoNDT group
- ROSEN Group
- Bureau Veritas SA
- Johnson and Allen Ltd
- Olympus Corporation
Key Developments in Portable Ultrasonic Testing Equipment Industry Industry
- July 2022: Applus+ secured a significant contract for non-destructive testing services on critical maritime assets. This strategic win underscores the escalating demand for advanced ultrasonic testing solutions in safeguarding the integrity and operational safety of vital infrastructure.
- [Add another key development with date and brief description]
- [Add another key development with date and brief description]
Strategic Portable Ultrasonic Testing Equipment Industry Market Forecast
The portable ultrasonic testing equipment market is poised for continued growth, driven by increasing demand across various industries and the ongoing development of innovative technologies. The market's future potential is considerable, with strong growth anticipated in emerging economies and expanding application areas. The integration of AI and automation will further enhance the efficiency and accuracy of testing, unlocking new opportunities in both product development and market expansion.
Portable Ultrasonic Testing Equipment Industry Segmentation
-
1. Product Type
- 1.1. Manual Ultrasonic Testing Equipment
- 1.2. Automated Ultrasonic Testing Equipment
- 1.3. Handheld Ultrasonic Testing Equipment
-
2. Application
- 2.1. Aerospace
- 2.2. Manufacturing
- 2.3. Automotive
- 2.4. Energy
- 2.5. Construction
Portable Ultrasonic Testing Equipment Industry Segmentation By Geography
-
1. North America
- 1.1. United States
- 1.2. Canada
-
2. Europe
- 2.1. Germany
- 2.2. United Kingdom
- 2.3. France
- 2.4. Spain
- 2.5. Rest of Europe
-
3. Asia Pacific
- 3.1. China
- 3.2. Japan
- 3.3. India
- 3.4. South Korea
- 3.5. Rest of Asia Pacific
-
4. Latin America
- 4.1. Brazil
- 4.2. Argentina
- 4.3. Rest of Latin America
-
5. Middle East and Africa
- 5.1. United Arab Emirates
- 5.2. Saudi Arabia
- 5.3. Rest of Middle East and Africa
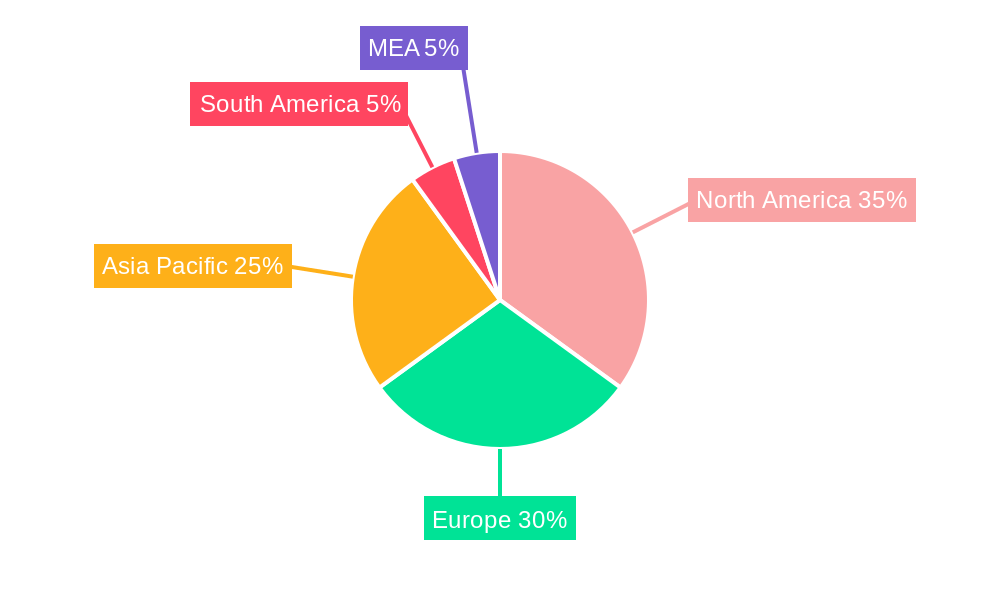
Portable Ultrasonic Testing Equipment Industry Regional Market Share
Geographic Coverage of Portable Ultrasonic Testing Equipment Industry
Portable Ultrasonic Testing Equipment Industry REPORT HIGHLIGHTS
| Aspects | Details |
|---|---|
| Study Period | 2020-2034 |
| Base Year | 2025 |
| Estimated Year | 2026 |
| Forecast Period | 2026-2034 |
| Historical Period | 2020-2025 |
| Growth Rate | CAGR of 8.79% from 2020-2034 |
| Segmentation |
|
Table of Contents
- 1. Introduction
- 1.1. Research Scope
- 1.2. Market Segmentation
- 1.3. Research Objective
- 1.4. Definitions and Assumptions
- 2. Executive Summary
- 2.1. Market Snapshot
- 3. Market Dynamics
- 3.1. Market Drivers
- 3.2. Market Restrains
- 3.3. Market Trends
- 3.4. Market Opportunities
- 4. Market Factor Analysis
- 4.1. Porters Five Forces
- 4.1.1. Bargaining Power of Suppliers
- 4.1.2. Bargaining Power of Buyers
- 4.1.3. Threat of New Entrants
- 4.1.4. Threat of Substitutes
- 4.1.5. Competitive Rivalry
- 4.2. PESTEL analysis
- 4.3. BCG Analysis
- 4.3.1. Stars (High Growth, High Market Share)
- 4.3.2. Cash Cows (Low Growth, High Market Share)
- 4.3.3. Question Mark (High Growth, Low Market Share)
- 4.3.4. Dogs (Low Growth, Low Market Share)
- 4.4. Ansoff Matrix Analysis
- 4.5. Supply Chain Analysis
- 4.6. Regulatory Landscape
- 4.7. Current Market Potential and Opportunity Assessment (TAM–SAM–SOM Framework)
- 4.8. DMV Analyst Note
- 4.1. Porters Five Forces
- 5. Market Analysis, Insights and Forecast 2021-2033
- 5.1. Market Analysis, Insights and Forecast - by Product Type
- 5.1.1. Manual Ultrasonic Testing Equipment
- 5.1.2. Automated Ultrasonic Testing Equipment
- 5.1.3. Handheld Ultrasonic Testing Equipment
- 5.2. Market Analysis, Insights and Forecast - by Application
- 5.2.1. Aerospace
- 5.2.2. Manufacturing
- 5.2.3. Automotive
- 5.2.4. Energy
- 5.2.5. Construction
- 5.3. Market Analysis, Insights and Forecast - by Region
- 5.3.1. North America
- 5.3.2. Europe
- 5.3.3. Asia Pacific
- 5.3.4. Latin America
- 5.3.5. Middle East and Africa
- 5.1. Market Analysis, Insights and Forecast - by Product Type
- 6. Global Portable Ultrasonic Testing Equipment Industry Analysis, Insights and Forecast, 2021-2033
- 6.1. Market Analysis, Insights and Forecast - by Product Type
- 6.1.1. Manual Ultrasonic Testing Equipment
- 6.1.2. Automated Ultrasonic Testing Equipment
- 6.1.3. Handheld Ultrasonic Testing Equipment
- 6.2. Market Analysis, Insights and Forecast - by Application
- 6.2.1. Aerospace
- 6.2.2. Manufacturing
- 6.2.3. Automotive
- 6.2.4. Energy
- 6.2.5. Construction
- 6.1. Market Analysis, Insights and Forecast - by Product Type
- 7. North America Portable Ultrasonic Testing Equipment Industry Analysis, Insights and Forecast, 2020-2032
- 7.1. Market Analysis, Insights and Forecast - by Product Type
- 7.1.1. Manual Ultrasonic Testing Equipment
- 7.1.2. Automated Ultrasonic Testing Equipment
- 7.1.3. Handheld Ultrasonic Testing Equipment
- 7.2. Market Analysis, Insights and Forecast - by Application
- 7.2.1. Aerospace
- 7.2.2. Manufacturing
- 7.2.3. Automotive
- 7.2.4. Energy
- 7.2.5. Construction
- 7.1. Market Analysis, Insights and Forecast - by Product Type
- 8. Europe Portable Ultrasonic Testing Equipment Industry Analysis, Insights and Forecast, 2020-2032
- 8.1. Market Analysis, Insights and Forecast - by Product Type
- 8.1.1. Manual Ultrasonic Testing Equipment
- 8.1.2. Automated Ultrasonic Testing Equipment
- 8.1.3. Handheld Ultrasonic Testing Equipment
- 8.2. Market Analysis, Insights and Forecast - by Application
- 8.2.1. Aerospace
- 8.2.2. Manufacturing
- 8.2.3. Automotive
- 8.2.4. Energy
- 8.2.5. Construction
- 8.1. Market Analysis, Insights and Forecast - by Product Type
- 9. Asia Pacific Portable Ultrasonic Testing Equipment Industry Analysis, Insights and Forecast, 2020-2032
- 9.1. Market Analysis, Insights and Forecast - by Product Type
- 9.1.1. Manual Ultrasonic Testing Equipment
- 9.1.2. Automated Ultrasonic Testing Equipment
- 9.1.3. Handheld Ultrasonic Testing Equipment
- 9.2. Market Analysis, Insights and Forecast - by Application
- 9.2.1. Aerospace
- 9.2.2. Manufacturing
- 9.2.3. Automotive
- 9.2.4. Energy
- 9.2.5. Construction
- 9.1. Market Analysis, Insights and Forecast - by Product Type
- 10. Latin America Portable Ultrasonic Testing Equipment Industry Analysis, Insights and Forecast, 2020-2032
- 10.1. Market Analysis, Insights and Forecast - by Product Type
- 10.1.1. Manual Ultrasonic Testing Equipment
- 10.1.2. Automated Ultrasonic Testing Equipment
- 10.1.3. Handheld Ultrasonic Testing Equipment
- 10.2. Market Analysis, Insights and Forecast - by Application
- 10.2.1. Aerospace
- 10.2.2. Manufacturing
- 10.2.3. Automotive
- 10.2.4. Energy
- 10.2.5. Construction
- 10.1. Market Analysis, Insights and Forecast - by Product Type
- 11. Middle East and Africa Portable Ultrasonic Testing Equipment Industry Analysis, Insights and Forecast, 2020-2032
- 11.1. Market Analysis, Insights and Forecast - by Product Type
- 11.1.1. Manual Ultrasonic Testing Equipment
- 11.1.2. Automated Ultrasonic Testing Equipment
- 11.1.3. Handheld Ultrasonic Testing Equipment
- 11.2. Market Analysis, Insights and Forecast - by Application
- 11.2.1. Aerospace
- 11.2.2. Manufacturing
- 11.2.3. Automotive
- 11.2.4. Energy
- 11.2.5. Construction
- 11.1. Market Analysis, Insights and Forecast - by Product Type
- 12. Competitive Analysis
- 12.1. Company Profiles
- 12.1.1 Intertek Group PKC
- 12.1.1.1. Company Overview
- 12.1.1.2. Products
- 12.1.1.3. Company Financials
- 12.1.1.4. SWOT Analysis
- 12.1.2 Advanced NDT Ltd
- 12.1.2.1. Company Overview
- 12.1.2.2. Products
- 12.1.2.3. Company Financials
- 12.1.2.4. SWOT Analysis
- 12.1.3 Applus Services S
- 12.1.3.1. Company Overview
- 12.1.3.2. Products
- 12.1.3.3. Company Financials
- 12.1.3.4. SWOT Analysis
- 12.1.4 MISTRAS Group
- 12.1.4.1. Company Overview
- 12.1.4.2. Products
- 12.1.4.3. Company Financials
- 12.1.4.4. SWOT Analysis
- 12.1.5 Baker Hughes
- 12.1.5.1. Company Overview
- 12.1.5.2. Products
- 12.1.5.3. Company Financials
- 12.1.5.4. SWOT Analysis
- 12.1.6 Russell Fraser Sales Pty Ltd
- 12.1.6.1. Company Overview
- 12.1.6.2. Products
- 12.1.6.3. Company Financials
- 12.1.6.4. SWOT Analysis
- 12.1.7 OkoNDT group
- 12.1.7.1. Company Overview
- 12.1.7.2. Products
- 12.1.7.3. Company Financials
- 12.1.7.4. SWOT Analysis
- 12.1.8 ROSEN Group
- 12.1.8.1. Company Overview
- 12.1.8.2. Products
- 12.1.8.3. Company Financials
- 12.1.8.4. SWOT Analysis
- 12.1.9 Bureau Veritas SA
- 12.1.9.1. Company Overview
- 12.1.9.2. Products
- 12.1.9.3. Company Financials
- 12.1.9.4. SWOT Analysis
- 12.1.10 Johnson and Allen Ltd
- 12.1.10.1. Company Overview
- 12.1.10.2. Products
- 12.1.10.3. Company Financials
- 12.1.10.4. SWOT Analysis
- 12.1.11 Olympus Corporation
- 12.1.11.1. Company Overview
- 12.1.11.2. Products
- 12.1.11.3. Company Financials
- 12.1.11.4. SWOT Analysis
- 12.1.1 Intertek Group PKC
- 12.2. Market Entropy
- 12.2.1 Company's Key Areas Served
- 12.2.2 Recent Developments
- 12.3. Company Market Share Analysis 2025
- 12.3.1 Top 5 Companies Market Share Analysis
- 12.3.2 Top 3 Companies Market Share Analysis
- 12.4. List of Potential Customers
- 13. Research Methodology
List of Figures
- Figure 1: Global Portable Ultrasonic Testing Equipment Industry Revenue Breakdown (Million, %) by Region 2025 & 2033
- Figure 2: Global Portable Ultrasonic Testing Equipment Industry Volume Breakdown (K Unit, %) by Region 2025 & 2033
- Figure 3: North America Portable Ultrasonic Testing Equipment Industry Revenue (Million), by Product Type 2025 & 2033
- Figure 4: North America Portable Ultrasonic Testing Equipment Industry Volume (K Unit), by Product Type 2025 & 2033
- Figure 5: North America Portable Ultrasonic Testing Equipment Industry Revenue Share (%), by Product Type 2025 & 2033
- Figure 6: North America Portable Ultrasonic Testing Equipment Industry Volume Share (%), by Product Type 2025 & 2033
- Figure 7: North America Portable Ultrasonic Testing Equipment Industry Revenue (Million), by Application 2025 & 2033
- Figure 8: North America Portable Ultrasonic Testing Equipment Industry Volume (K Unit), by Application 2025 & 2033
- Figure 9: North America Portable Ultrasonic Testing Equipment Industry Revenue Share (%), by Application 2025 & 2033
- Figure 10: North America Portable Ultrasonic Testing Equipment Industry Volume Share (%), by Application 2025 & 2033
- Figure 11: North America Portable Ultrasonic Testing Equipment Industry Revenue (Million), by Country 2025 & 2033
- Figure 12: North America Portable Ultrasonic Testing Equipment Industry Volume (K Unit), by Country 2025 & 2033
- Figure 13: North America Portable Ultrasonic Testing Equipment Industry Revenue Share (%), by Country 2025 & 2033
- Figure 14: North America Portable Ultrasonic Testing Equipment Industry Volume Share (%), by Country 2025 & 2033
- Figure 15: Europe Portable Ultrasonic Testing Equipment Industry Revenue (Million), by Product Type 2025 & 2033
- Figure 16: Europe Portable Ultrasonic Testing Equipment Industry Volume (K Unit), by Product Type 2025 & 2033
- Figure 17: Europe Portable Ultrasonic Testing Equipment Industry Revenue Share (%), by Product Type 2025 & 2033
- Figure 18: Europe Portable Ultrasonic Testing Equipment Industry Volume Share (%), by Product Type 2025 & 2033
- Figure 19: Europe Portable Ultrasonic Testing Equipment Industry Revenue (Million), by Application 2025 & 2033
- Figure 20: Europe Portable Ultrasonic Testing Equipment Industry Volume (K Unit), by Application 2025 & 2033
- Figure 21: Europe Portable Ultrasonic Testing Equipment Industry Revenue Share (%), by Application 2025 & 2033
- Figure 22: Europe Portable Ultrasonic Testing Equipment Industry Volume Share (%), by Application 2025 & 2033
- Figure 23: Europe Portable Ultrasonic Testing Equipment Industry Revenue (Million), by Country 2025 & 2033
- Figure 24: Europe Portable Ultrasonic Testing Equipment Industry Volume (K Unit), by Country 2025 & 2033
- Figure 25: Europe Portable Ultrasonic Testing Equipment Industry Revenue Share (%), by Country 2025 & 2033
- Figure 26: Europe Portable Ultrasonic Testing Equipment Industry Volume Share (%), by Country 2025 & 2033
- Figure 27: Asia Pacific Portable Ultrasonic Testing Equipment Industry Revenue (Million), by Product Type 2025 & 2033
- Figure 28: Asia Pacific Portable Ultrasonic Testing Equipment Industry Volume (K Unit), by Product Type 2025 & 2033
- Figure 29: Asia Pacific Portable Ultrasonic Testing Equipment Industry Revenue Share (%), by Product Type 2025 & 2033
- Figure 30: Asia Pacific Portable Ultrasonic Testing Equipment Industry Volume Share (%), by Product Type 2025 & 2033
- Figure 31: Asia Pacific Portable Ultrasonic Testing Equipment Industry Revenue (Million), by Application 2025 & 2033
- Figure 32: Asia Pacific Portable Ultrasonic Testing Equipment Industry Volume (K Unit), by Application 2025 & 2033
- Figure 33: Asia Pacific Portable Ultrasonic Testing Equipment Industry Revenue Share (%), by Application 2025 & 2033
- Figure 34: Asia Pacific Portable Ultrasonic Testing Equipment Industry Volume Share (%), by Application 2025 & 2033
- Figure 35: Asia Pacific Portable Ultrasonic Testing Equipment Industry Revenue (Million), by Country 2025 & 2033
- Figure 36: Asia Pacific Portable Ultrasonic Testing Equipment Industry Volume (K Unit), by Country 2025 & 2033
- Figure 37: Asia Pacific Portable Ultrasonic Testing Equipment Industry Revenue Share (%), by Country 2025 & 2033
- Figure 38: Asia Pacific Portable Ultrasonic Testing Equipment Industry Volume Share (%), by Country 2025 & 2033
- Figure 39: Latin America Portable Ultrasonic Testing Equipment Industry Revenue (Million), by Product Type 2025 & 2033
- Figure 40: Latin America Portable Ultrasonic Testing Equipment Industry Volume (K Unit), by Product Type 2025 & 2033
- Figure 41: Latin America Portable Ultrasonic Testing Equipment Industry Revenue Share (%), by Product Type 2025 & 2033
- Figure 42: Latin America Portable Ultrasonic Testing Equipment Industry Volume Share (%), by Product Type 2025 & 2033
- Figure 43: Latin America Portable Ultrasonic Testing Equipment Industry Revenue (Million), by Application 2025 & 2033
- Figure 44: Latin America Portable Ultrasonic Testing Equipment Industry Volume (K Unit), by Application 2025 & 2033
- Figure 45: Latin America Portable Ultrasonic Testing Equipment Industry Revenue Share (%), by Application 2025 & 2033
- Figure 46: Latin America Portable Ultrasonic Testing Equipment Industry Volume Share (%), by Application 2025 & 2033
- Figure 47: Latin America Portable Ultrasonic Testing Equipment Industry Revenue (Million), by Country 2025 & 2033
- Figure 48: Latin America Portable Ultrasonic Testing Equipment Industry Volume (K Unit), by Country 2025 & 2033
- Figure 49: Latin America Portable Ultrasonic Testing Equipment Industry Revenue Share (%), by Country 2025 & 2033
- Figure 50: Latin America Portable Ultrasonic Testing Equipment Industry Volume Share (%), by Country 2025 & 2033
- Figure 51: Middle East and Africa Portable Ultrasonic Testing Equipment Industry Revenue (Million), by Product Type 2025 & 2033
- Figure 52: Middle East and Africa Portable Ultrasonic Testing Equipment Industry Volume (K Unit), by Product Type 2025 & 2033
- Figure 53: Middle East and Africa Portable Ultrasonic Testing Equipment Industry Revenue Share (%), by Product Type 2025 & 2033
- Figure 54: Middle East and Africa Portable Ultrasonic Testing Equipment Industry Volume Share (%), by Product Type 2025 & 2033
- Figure 55: Middle East and Africa Portable Ultrasonic Testing Equipment Industry Revenue (Million), by Application 2025 & 2033
- Figure 56: Middle East and Africa Portable Ultrasonic Testing Equipment Industry Volume (K Unit), by Application 2025 & 2033
- Figure 57: Middle East and Africa Portable Ultrasonic Testing Equipment Industry Revenue Share (%), by Application 2025 & 2033
- Figure 58: Middle East and Africa Portable Ultrasonic Testing Equipment Industry Volume Share (%), by Application 2025 & 2033
- Figure 59: Middle East and Africa Portable Ultrasonic Testing Equipment Industry Revenue (Million), by Country 2025 & 2033
- Figure 60: Middle East and Africa Portable Ultrasonic Testing Equipment Industry Volume (K Unit), by Country 2025 & 2033
- Figure 61: Middle East and Africa Portable Ultrasonic Testing Equipment Industry Revenue Share (%), by Country 2025 & 2033
- Figure 62: Middle East and Africa Portable Ultrasonic Testing Equipment Industry Volume Share (%), by Country 2025 & 2033
List of Tables
- Table 1: Global Portable Ultrasonic Testing Equipment Industry Revenue Million Forecast, by Product Type 2020 & 2033
- Table 2: Global Portable Ultrasonic Testing Equipment Industry Volume K Unit Forecast, by Product Type 2020 & 2033
- Table 3: Global Portable Ultrasonic Testing Equipment Industry Revenue Million Forecast, by Application 2020 & 2033
- Table 4: Global Portable Ultrasonic Testing Equipment Industry Volume K Unit Forecast, by Application 2020 & 2033
- Table 5: Global Portable Ultrasonic Testing Equipment Industry Revenue Million Forecast, by Region 2020 & 2033
- Table 6: Global Portable Ultrasonic Testing Equipment Industry Volume K Unit Forecast, by Region 2020 & 2033
- Table 7: Global Portable Ultrasonic Testing Equipment Industry Revenue Million Forecast, by Product Type 2020 & 2033
- Table 8: Global Portable Ultrasonic Testing Equipment Industry Volume K Unit Forecast, by Product Type 2020 & 2033
- Table 9: Global Portable Ultrasonic Testing Equipment Industry Revenue Million Forecast, by Application 2020 & 2033
- Table 10: Global Portable Ultrasonic Testing Equipment Industry Volume K Unit Forecast, by Application 2020 & 2033
- Table 11: Global Portable Ultrasonic Testing Equipment Industry Revenue Million Forecast, by Country 2020 & 2033
- Table 12: Global Portable Ultrasonic Testing Equipment Industry Volume K Unit Forecast, by Country 2020 & 2033
- Table 13: United States Portable Ultrasonic Testing Equipment Industry Revenue (Million) Forecast, by Application 2020 & 2033
- Table 14: United States Portable Ultrasonic Testing Equipment Industry Volume (K Unit) Forecast, by Application 2020 & 2033
- Table 15: Canada Portable Ultrasonic Testing Equipment Industry Revenue (Million) Forecast, by Application 2020 & 2033
- Table 16: Canada Portable Ultrasonic Testing Equipment Industry Volume (K Unit) Forecast, by Application 2020 & 2033
- Table 17: Global Portable Ultrasonic Testing Equipment Industry Revenue Million Forecast, by Product Type 2020 & 2033
- Table 18: Global Portable Ultrasonic Testing Equipment Industry Volume K Unit Forecast, by Product Type 2020 & 2033
- Table 19: Global Portable Ultrasonic Testing Equipment Industry Revenue Million Forecast, by Application 2020 & 2033
- Table 20: Global Portable Ultrasonic Testing Equipment Industry Volume K Unit Forecast, by Application 2020 & 2033
- Table 21: Global Portable Ultrasonic Testing Equipment Industry Revenue Million Forecast, by Country 2020 & 2033
- Table 22: Global Portable Ultrasonic Testing Equipment Industry Volume K Unit Forecast, by Country 2020 & 2033
- Table 23: Germany Portable Ultrasonic Testing Equipment Industry Revenue (Million) Forecast, by Application 2020 & 2033
- Table 24: Germany Portable Ultrasonic Testing Equipment Industry Volume (K Unit) Forecast, by Application 2020 & 2033
- Table 25: United Kingdom Portable Ultrasonic Testing Equipment Industry Revenue (Million) Forecast, by Application 2020 & 2033
- Table 26: United Kingdom Portable Ultrasonic Testing Equipment Industry Volume (K Unit) Forecast, by Application 2020 & 2033
- Table 27: France Portable Ultrasonic Testing Equipment Industry Revenue (Million) Forecast, by Application 2020 & 2033
- Table 28: France Portable Ultrasonic Testing Equipment Industry Volume (K Unit) Forecast, by Application 2020 & 2033
- Table 29: Spain Portable Ultrasonic Testing Equipment Industry Revenue (Million) Forecast, by Application 2020 & 2033
- Table 30: Spain Portable Ultrasonic Testing Equipment Industry Volume (K Unit) Forecast, by Application 2020 & 2033
- Table 31: Rest of Europe Portable Ultrasonic Testing Equipment Industry Revenue (Million) Forecast, by Application 2020 & 2033
- Table 32: Rest of Europe Portable Ultrasonic Testing Equipment Industry Volume (K Unit) Forecast, by Application 2020 & 2033
- Table 33: Global Portable Ultrasonic Testing Equipment Industry Revenue Million Forecast, by Product Type 2020 & 2033
- Table 34: Global Portable Ultrasonic Testing Equipment Industry Volume K Unit Forecast, by Product Type 2020 & 2033
- Table 35: Global Portable Ultrasonic Testing Equipment Industry Revenue Million Forecast, by Application 2020 & 2033
- Table 36: Global Portable Ultrasonic Testing Equipment Industry Volume K Unit Forecast, by Application 2020 & 2033
- Table 37: Global Portable Ultrasonic Testing Equipment Industry Revenue Million Forecast, by Country 2020 & 2033
- Table 38: Global Portable Ultrasonic Testing Equipment Industry Volume K Unit Forecast, by Country 2020 & 2033
- Table 39: China Portable Ultrasonic Testing Equipment Industry Revenue (Million) Forecast, by Application 2020 & 2033
- Table 40: China Portable Ultrasonic Testing Equipment Industry Volume (K Unit) Forecast, by Application 2020 & 2033
- Table 41: Japan Portable Ultrasonic Testing Equipment Industry Revenue (Million) Forecast, by Application 2020 & 2033
- Table 42: Japan Portable Ultrasonic Testing Equipment Industry Volume (K Unit) Forecast, by Application 2020 & 2033
- Table 43: India Portable Ultrasonic Testing Equipment Industry Revenue (Million) Forecast, by Application 2020 & 2033
- Table 44: India Portable Ultrasonic Testing Equipment Industry Volume (K Unit) Forecast, by Application 2020 & 2033
- Table 45: South Korea Portable Ultrasonic Testing Equipment Industry Revenue (Million) Forecast, by Application 2020 & 2033
- Table 46: South Korea Portable Ultrasonic Testing Equipment Industry Volume (K Unit) Forecast, by Application 2020 & 2033
- Table 47: Rest of Asia Pacific Portable Ultrasonic Testing Equipment Industry Revenue (Million) Forecast, by Application 2020 & 2033
- Table 48: Rest of Asia Pacific Portable Ultrasonic Testing Equipment Industry Volume (K Unit) Forecast, by Application 2020 & 2033
- Table 49: Global Portable Ultrasonic Testing Equipment Industry Revenue Million Forecast, by Product Type 2020 & 2033
- Table 50: Global Portable Ultrasonic Testing Equipment Industry Volume K Unit Forecast, by Product Type 2020 & 2033
- Table 51: Global Portable Ultrasonic Testing Equipment Industry Revenue Million Forecast, by Application 2020 & 2033
- Table 52: Global Portable Ultrasonic Testing Equipment Industry Volume K Unit Forecast, by Application 2020 & 2033
- Table 53: Global Portable Ultrasonic Testing Equipment Industry Revenue Million Forecast, by Country 2020 & 2033
- Table 54: Global Portable Ultrasonic Testing Equipment Industry Volume K Unit Forecast, by Country 2020 & 2033
- Table 55: Brazil Portable Ultrasonic Testing Equipment Industry Revenue (Million) Forecast, by Application 2020 & 2033
- Table 56: Brazil Portable Ultrasonic Testing Equipment Industry Volume (K Unit) Forecast, by Application 2020 & 2033
- Table 57: Argentina Portable Ultrasonic Testing Equipment Industry Revenue (Million) Forecast, by Application 2020 & 2033
- Table 58: Argentina Portable Ultrasonic Testing Equipment Industry Volume (K Unit) Forecast, by Application 2020 & 2033
- Table 59: Rest of Latin America Portable Ultrasonic Testing Equipment Industry Revenue (Million) Forecast, by Application 2020 & 2033
- Table 60: Rest of Latin America Portable Ultrasonic Testing Equipment Industry Volume (K Unit) Forecast, by Application 2020 & 2033
- Table 61: Global Portable Ultrasonic Testing Equipment Industry Revenue Million Forecast, by Product Type 2020 & 2033
- Table 62: Global Portable Ultrasonic Testing Equipment Industry Volume K Unit Forecast, by Product Type 2020 & 2033
- Table 63: Global Portable Ultrasonic Testing Equipment Industry Revenue Million Forecast, by Application 2020 & 2033
- Table 64: Global Portable Ultrasonic Testing Equipment Industry Volume K Unit Forecast, by Application 2020 & 2033
- Table 65: Global Portable Ultrasonic Testing Equipment Industry Revenue Million Forecast, by Country 2020 & 2033
- Table 66: Global Portable Ultrasonic Testing Equipment Industry Volume K Unit Forecast, by Country 2020 & 2033
- Table 67: United Arab Emirates Portable Ultrasonic Testing Equipment Industry Revenue (Million) Forecast, by Application 2020 & 2033
- Table 68: United Arab Emirates Portable Ultrasonic Testing Equipment Industry Volume (K Unit) Forecast, by Application 2020 & 2033
- Table 69: Saudi Arabia Portable Ultrasonic Testing Equipment Industry Revenue (Million) Forecast, by Application 2020 & 2033
- Table 70: Saudi Arabia Portable Ultrasonic Testing Equipment Industry Volume (K Unit) Forecast, by Application 2020 & 2033
- Table 71: Rest of Middle East and Africa Portable Ultrasonic Testing Equipment Industry Revenue (Million) Forecast, by Application 2020 & 2033
- Table 72: Rest of Middle East and Africa Portable Ultrasonic Testing Equipment Industry Volume (K Unit) Forecast, by Application 2020 & 2033
Frequently Asked Questions
1. What is the projected Compound Annual Growth Rate (CAGR) of the Portable Ultrasonic Testing Equipment Industry?
The projected CAGR is approximately 8.79%.
2. Which companies are prominent players in the Portable Ultrasonic Testing Equipment Industry?
Key companies in the market include Intertek Group PKC, Advanced NDT Ltd, Applus Services S, MISTRAS Group, Baker Hughes, Russell Fraser Sales Pty Ltd, OkoNDT group, ROSEN Group, Bureau Veritas SA, Johnson and Allen Ltd, Olympus Corporation.
3. What are the main segments of the Portable Ultrasonic Testing Equipment Industry?
The market segments include Product Type , Application .
4. Can you provide details about the market size?
The market size is estimated to be USD 0.87 Million as of 2022.
5. What are some drivers contributing to market growth?
Increased Safety Regulation; More Emphasis Toward Continuous Monitoring to Prevent Sudden Failure; Availability of Portable and Connected Devices for Real-time Data.
6. What are the notable trends driving market growth?
Availability of Portable and Connected Devices for Real-time Data is Expected to Drive the Market's Growth.
7. Are there any restraints impacting market growth?
Lack of Skilled Labor Required to Implement and Carry Out Inspection Service.
8. Can you provide examples of recent developments in the market?
July 2022 - Applus+ was awarded a major contract to execute non-destructive testing on critical maritime assets. Applus+ provides a significant range of marine Non-destructive testing services like materials, corrosion monitoring and testing, and electrical safety and functionality testing. The two-year project entails the execution of radiographic and ultrasonic testing on diverse maritime assets, including watercraft.
9. What pricing options are available for accessing the report?
Pricing options include single-user, multi-user, and enterprise licenses priced at USD 4750, USD 5250, and USD 8750 respectively.
10. Is the market size provided in terms of value or volume?
The market size is provided in terms of value, measured in Million and volume, measured in K Unit.
11. Are there any specific market keywords associated with the report?
Yes, the market keyword associated with the report is "Portable Ultrasonic Testing Equipment Industry," which aids in identifying and referencing the specific market segment covered.
12. How do I determine which pricing option suits my needs best?
The pricing options vary based on user requirements and access needs. Individual users may opt for single-user licenses, while businesses requiring broader access may choose multi-user or enterprise licenses for cost-effective access to the report.
13. Are there any additional resources or data provided in the Portable Ultrasonic Testing Equipment Industry report?
While the report offers comprehensive insights, it's advisable to review the specific contents or supplementary materials provided to ascertain if additional resources or data are available.
14. How can I stay updated on further developments or reports in the Portable Ultrasonic Testing Equipment Industry?
To stay informed about further developments, trends, and reports in the Portable Ultrasonic Testing Equipment Industry, consider subscribing to industry newsletters, following relevant companies and organizations, or regularly checking reputable industry news sources and publications.
Methodology
Step 1 - Identification of Relevant Samples Size from Population Database


Step 2 - Approaches for Defining Global Market Size (Value, Volume* & Price*)

Note*: In applicable scenarios
Step 3 - Data Sources
Primary Research
- Web Analytics
- Survey Reports
- Research Institute
- Latest Research Reports
- Opinion Leaders
Secondary Research
- Annual Reports
- White Paper
- Latest Press Release
- Industry Association
- Paid Database
- Investor Presentations

Step 4 - Data Triangulation
Involves using different sources of information in order to increase the validity of a study
These sources are likely to be stakeholders in a program - participants, other researchers, program staff, other community members, and so on.
Then we put all data in single framework & apply various statistical tools to find out the dynamic on the market.
During the analysis stage, feedback from the stakeholder groups would be compared to determine areas of agreement as well as areas of divergence