

Key Insights
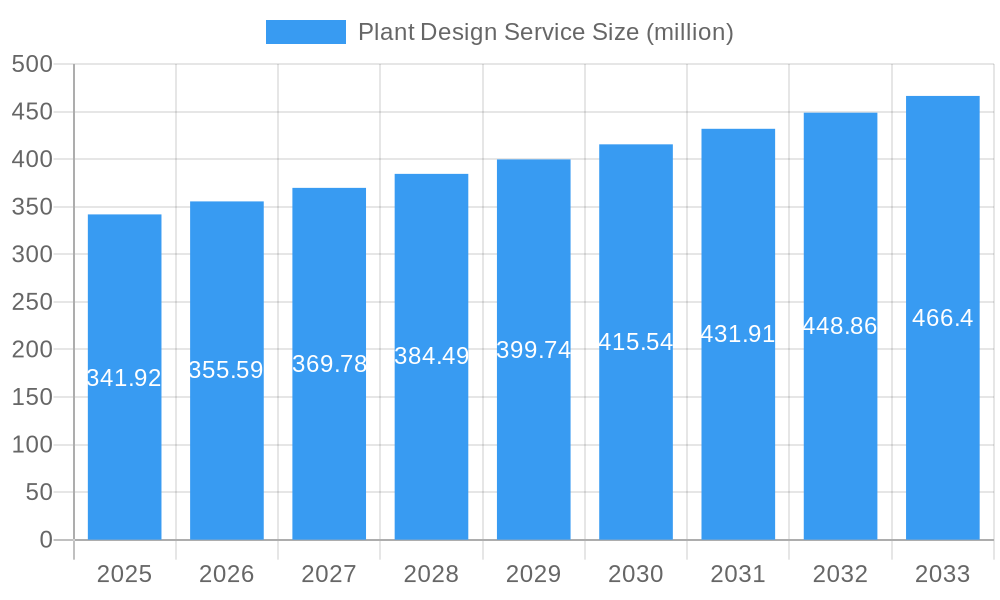
The global Plant Design Service market, valued at $341.92 million in 2025, is projected to experience steady growth, driven by increasing investments in industrial infrastructure, particularly in emerging economies experiencing rapid industrialization. A Compound Annual Growth Rate (CAGR) of 4% from 2025 to 2033 suggests a market size exceeding $470 million by 2033. This growth is fueled by several factors including the rising demand for energy-efficient and sustainable plant designs, the adoption of advanced technologies like Building Information Modeling (BIM) and digital twins for improved design and collaboration, and a growing need for specialized engineering expertise across diverse industrial sectors like chemicals, oil & gas, and pharmaceuticals. Stringent environmental regulations are also impacting design choices, necessitating the engagement of specialized plant design services to ensure compliance.
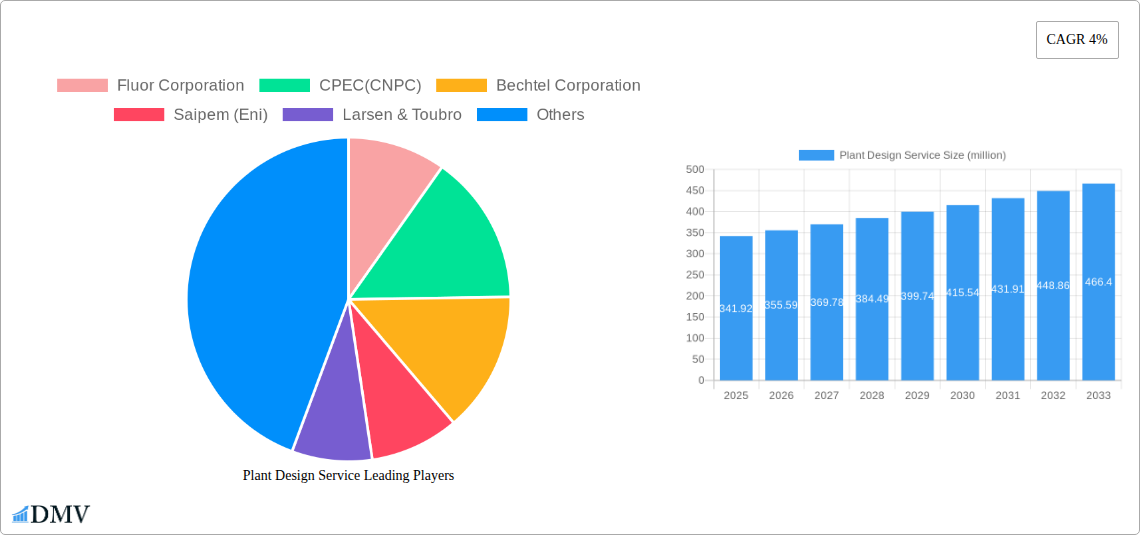
Plant Design Service Market Size (In Million)
Major players like Fluor Corporation, Bechtel Corporation, and Technip Energies are leveraging their experience and technological capabilities to secure a significant market share. However, increased competition from smaller, specialized firms offering niche services and innovative solutions presents a dynamic market landscape. The market faces challenges such as fluctuating commodity prices and potential project delays due to geopolitical uncertainties or supply chain disruptions, which can affect overall market expansion. Nevertheless, the long-term outlook remains positive, underpinned by continuous industrial development globally and the ongoing adoption of innovative technologies within the plant design sector.
Plant Design Service Company Market Share
Plant Design Service Market Report: A Comprehensive Analysis of a Multi-Million Dollar Industry (2019-2033)
This insightful report provides a comprehensive analysis of the global Plant Design Service market, projecting a market valuation exceeding $XX million by 2033. It covers the period from 2019 to 2033, with a base year of 2025 and a forecast period spanning 2025-2033. The report leverages historical data from 2019-2024 to create a robust and accurate forecast, invaluable for stakeholders seeking to navigate this dynamic market.
Plant Design Service Market Composition & Trends
This section evaluates the competitive landscape, encompassing market concentration, innovation drivers, regulatory factors, substitute products, end-user profiles, and mergers & acquisitions (M&A) activity within the $XX million plant design services market. We analyze the market share distribution among key players like Fluor Corporation, Bechtel Corporation, and others, revealing the extent of market consolidation. The impact of regulatory changes and technological advancements on market dynamics is also thoroughly examined.
- Market Concentration: The market exhibits a moderately concentrated structure, with the top 5 players holding approximately XX% of the market share in 2025.
- Innovation Catalysts: Digitalization, sustainable design practices, and advancements in 3D modeling are driving innovation.
- Regulatory Landscape: Stringent environmental regulations and safety standards influence design practices and project timelines.
- Substitute Products: Limited viable substitutes exist, strengthening market demand.
- End-User Profiles: The report categorizes end-users based on industry (e.g., oil & gas, chemicals, power) and project size.
- M&A Activities: Analysis of significant M&A deals (totaling $XX million in value during the historical period) reveals strategic consolidation trends within the industry. Specific deal values and their implications are discussed.
Plant Design Service Industry Evolution
This section delves into the evolutionary trajectory of the plant design services market, detailing market growth trajectories, technological advancements, and evolving consumer preferences. We analyze the historical growth rates (XX% CAGR from 2019-2024) and project future growth (XX% CAGR from 2025-2033). The impact of technological shifts (e.g., BIM adoption, AI integration) on design processes and efficiency are thoroughly explored, along with the changing demands from clients seeking sustainable and cost-effective solutions. Specific data points illustrating growth rates, technology adoption rates, and changes in client demand are included.
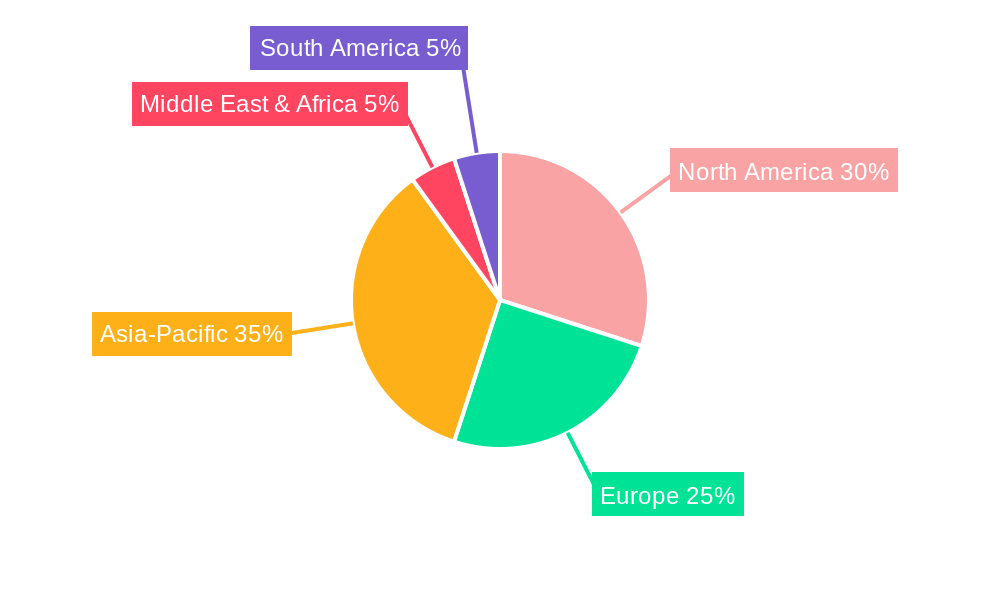
Leading Regions, Countries, or Segments in Plant Design Service
This section identifies the dominant regions and segments within the global plant design services market. We analyze the factors driving market leadership in specific geographic locations or sectors.
- Key Drivers (Examples):
- North America: Strong domestic investments in infrastructure and energy projects.
- Asia-Pacific: Rapid industrialization and significant government investment in infrastructure.
- Oil & Gas Segment: Consistent demand due to the global energy landscape.
- In-depth Analysis: The report provides a comprehensive evaluation of the key factors, including regulatory support, investment patterns, and technological advancements, that contribute to the dominance of specific regions and sectors. Market size data and detailed explanations supporting regional leadership are provided.
Plant Design Service Product Innovations
Recent innovations in plant design services include the integration of advanced simulation tools, the increased use of Building Information Modeling (BIM) for improved collaboration and efficiency, and the development of sustainable design methodologies. These innovations enhance the accuracy, speed, and cost-effectiveness of design processes. Unique selling propositions and detailed performance metrics for these new design tools and methodologies are highlighted.
Propelling Factors for Plant Design Service Growth
Several factors contribute to the growth of the plant design services market. These include increasing global investments in infrastructure projects, rising demand for energy and chemical plants, technological advancements such as Building Information Modeling (BIM) and Artificial Intelligence (AI), and the growing focus on sustainability. The report quantifies the impact of these drivers on market expansion.
Obstacles in the Plant Design Service Market
The plant design services market faces several challenges. These include fluctuations in global economic conditions impacting project financing, supply chain disruptions leading to material shortages and delays, intense competition among leading players, and the complexity and regulatory challenges associated with large-scale projects. The quantifiable impacts of these obstacles on project costs and timelines are evaluated.
Future Opportunities in Plant Design Service
Future opportunities in the plant design services market stem from the growing adoption of digital twins, the expansion into renewable energy sectors, and increasing demand for energy-efficient and sustainable plant designs. The report explores these and other emerging market segments with significant growth potential.
Major Players in the Plant Design Service Ecosystem
- Fluor Corporation
- CPEC(CNPC)
- Bechtel Corporation
- Saipem (Eni)
- Larsen & Toubro
- AtkinsRealis
- McDermott International
- Samsung E&A
- Technip Energies
- John Wood Group
- Hyundai E&C
- Maire Tecnimont
- JGC Corporation
- Chiyoda Corporation
- GS E&C
- Petrofac
- NMDC Energy
- KBR
- Doosan Enerbility
- Toyo Engineering Corporation
- Hitachi Plant Construction
- Nuberg EPC
Key Developments in Plant Design Service Industry
- 2022 Q4: Fluor Corporation announces a major contract for a new petrochemical plant.
- 2023 Q1: Bechtel Corporation launches a new sustainable design initiative.
- 2023 Q3: Significant M&A activity involving smaller design firms strengthens market consolidation. (Specific details on these developments, including companies and impacts, will be added in the final report)
Strategic Plant Design Service Market Forecast
The plant design services market is poised for robust growth driven by sustained investment in infrastructure, renewable energy, and technological advancements. The market is expected to expand significantly over the forecast period, creating considerable opportunities for established players and new entrants alike. The report provides detailed forecasts for key market segments and regional breakdowns.
Plant Design Service Segmentation
-
1. Application
- 1.1. Oil and Gas
- 1.2. Chemical
- 1.3. Steel
- 1.4. Automotive
- 1.5. Power Generation
- 1.6. Mineral and Metal
- 1.7. Consumer Goods
- 1.8. Pharmaceutical
- 1.9. Water Treatment
- 1.10. Renewable Energy
- 1.11. Others
-
2. Types
- 2.1. Engineering
- 2.2. Procurement
- 2.3. Construction
- 2.4. Others
Plant Design Service Segmentation By Geography
-
1. North America
- 1.1. United States
- 1.2. Canada
- 1.3. Mexico
-
2. South America
- 2.1. Brazil
- 2.2. Argentina
- 2.3. Rest of South America
-
3. Europe
- 3.1. United Kingdom
- 3.2. Germany
- 3.3. France
- 3.4. Italy
- 3.5. Spain
- 3.6. Russia
- 3.7. Benelux
- 3.8. Nordics
- 3.9. Rest of Europe
-
4. Middle East & Africa
- 4.1. Turkey
- 4.2. Israel
- 4.3. GCC
- 4.4. North Africa
- 4.5. South Africa
- 4.6. Rest of Middle East & Africa
-
5. Asia Pacific
- 5.1. China
- 5.2. India
- 5.3. Japan
- 5.4. South Korea
- 5.5. ASEAN
- 5.6. Oceania
- 5.7. Rest of Asia Pacific
Plant Design Service Regional Market Share
Geographic Coverage of Plant Design Service
Plant Design Service REPORT HIGHLIGHTS
| Aspects | Details |
|---|---|
| Study Period | 2020-2034 |
| Base Year | 2025 |
| Estimated Year | 2026 |
| Forecast Period | 2026-2034 |
| Historical Period | 2020-2025 |
| Growth Rate | CAGR of 4% from 2020-2034 |
| Segmentation |
|
Table of Contents
- 1. Introduction
- 1.1. Research Scope
- 1.2. Market Segmentation
- 1.3. Research Methodology
- 1.4. Definitions and Assumptions
- 2. Executive Summary
- 2.1. Introduction
- 3. Market Dynamics
- 3.1. Introduction
- 3.2. Market Drivers
- 3.3. Market Restrains
- 3.4. Market Trends
- 4. Market Factor Analysis
- 4.1. Porters Five Forces
- 4.2. Supply/Value Chain
- 4.3. PESTEL analysis
- 4.4. Market Entropy
- 4.5. Patent/Trademark Analysis
- 5. Global Plant Design Service Analysis, Insights and Forecast, 2020-2032
- 5.1. Market Analysis, Insights and Forecast - by Application
- 5.1.1. Oil and Gas
- 5.1.2. Chemical
- 5.1.3. Steel
- 5.1.4. Automotive
- 5.1.5. Power Generation
- 5.1.6. Mineral and Metal
- 5.1.7. Consumer Goods
- 5.1.8. Pharmaceutical
- 5.1.9. Water Treatment
- 5.1.10. Renewable Energy
- 5.1.11. Others
- 5.2. Market Analysis, Insights and Forecast - by Types
- 5.2.1. Engineering
- 5.2.2. Procurement
- 5.2.3. Construction
- 5.2.4. Others
- 5.3. Market Analysis, Insights and Forecast - by Region
- 5.3.1. North America
- 5.3.2. South America
- 5.3.3. Europe
- 5.3.4. Middle East & Africa
- 5.3.5. Asia Pacific
- 5.1. Market Analysis, Insights and Forecast - by Application
- 6. North America Plant Design Service Analysis, Insights and Forecast, 2020-2032
- 6.1. Market Analysis, Insights and Forecast - by Application
- 6.1.1. Oil and Gas
- 6.1.2. Chemical
- 6.1.3. Steel
- 6.1.4. Automotive
- 6.1.5. Power Generation
- 6.1.6. Mineral and Metal
- 6.1.7. Consumer Goods
- 6.1.8. Pharmaceutical
- 6.1.9. Water Treatment
- 6.1.10. Renewable Energy
- 6.1.11. Others
- 6.2. Market Analysis, Insights and Forecast - by Types
- 6.2.1. Engineering
- 6.2.2. Procurement
- 6.2.3. Construction
- 6.2.4. Others
- 6.1. Market Analysis, Insights and Forecast - by Application
- 7. South America Plant Design Service Analysis, Insights and Forecast, 2020-2032
- 7.1. Market Analysis, Insights and Forecast - by Application
- 7.1.1. Oil and Gas
- 7.1.2. Chemical
- 7.1.3. Steel
- 7.1.4. Automotive
- 7.1.5. Power Generation
- 7.1.6. Mineral and Metal
- 7.1.7. Consumer Goods
- 7.1.8. Pharmaceutical
- 7.1.9. Water Treatment
- 7.1.10. Renewable Energy
- 7.1.11. Others
- 7.2. Market Analysis, Insights and Forecast - by Types
- 7.2.1. Engineering
- 7.2.2. Procurement
- 7.2.3. Construction
- 7.2.4. Others
- 7.1. Market Analysis, Insights and Forecast - by Application
- 8. Europe Plant Design Service Analysis, Insights and Forecast, 2020-2032
- 8.1. Market Analysis, Insights and Forecast - by Application
- 8.1.1. Oil and Gas
- 8.1.2. Chemical
- 8.1.3. Steel
- 8.1.4. Automotive
- 8.1.5. Power Generation
- 8.1.6. Mineral and Metal
- 8.1.7. Consumer Goods
- 8.1.8. Pharmaceutical
- 8.1.9. Water Treatment
- 8.1.10. Renewable Energy
- 8.1.11. Others
- 8.2. Market Analysis, Insights and Forecast - by Types
- 8.2.1. Engineering
- 8.2.2. Procurement
- 8.2.3. Construction
- 8.2.4. Others
- 8.1. Market Analysis, Insights and Forecast - by Application
- 9. Middle East & Africa Plant Design Service Analysis, Insights and Forecast, 2020-2032
- 9.1. Market Analysis, Insights and Forecast - by Application
- 9.1.1. Oil and Gas
- 9.1.2. Chemical
- 9.1.3. Steel
- 9.1.4. Automotive
- 9.1.5. Power Generation
- 9.1.6. Mineral and Metal
- 9.1.7. Consumer Goods
- 9.1.8. Pharmaceutical
- 9.1.9. Water Treatment
- 9.1.10. Renewable Energy
- 9.1.11. Others
- 9.2. Market Analysis, Insights and Forecast - by Types
- 9.2.1. Engineering
- 9.2.2. Procurement
- 9.2.3. Construction
- 9.2.4. Others
- 9.1. Market Analysis, Insights and Forecast - by Application
- 10. Asia Pacific Plant Design Service Analysis, Insights and Forecast, 2020-2032
- 10.1. Market Analysis, Insights and Forecast - by Application
- 10.1.1. Oil and Gas
- 10.1.2. Chemical
- 10.1.3. Steel
- 10.1.4. Automotive
- 10.1.5. Power Generation
- 10.1.6. Mineral and Metal
- 10.1.7. Consumer Goods
- 10.1.8. Pharmaceutical
- 10.1.9. Water Treatment
- 10.1.10. Renewable Energy
- 10.1.11. Others
- 10.2. Market Analysis, Insights and Forecast - by Types
- 10.2.1. Engineering
- 10.2.2. Procurement
- 10.2.3. Construction
- 10.2.4. Others
- 10.1. Market Analysis, Insights and Forecast - by Application
- 11. Competitive Analysis
- 11.1. Global Market Share Analysis 2025
- 11.2. Company Profiles
- 11.2.1 Fluor Corporation
- 11.2.1.1. Overview
- 11.2.1.2. Products
- 11.2.1.3. SWOT Analysis
- 11.2.1.4. Recent Developments
- 11.2.1.5. Financials (Based on Availability)
- 11.2.2 CPEC(CNPC)
- 11.2.2.1. Overview
- 11.2.2.2. Products
- 11.2.2.3. SWOT Analysis
- 11.2.2.4. Recent Developments
- 11.2.2.5. Financials (Based on Availability)
- 11.2.3 Bechtel Corporation
- 11.2.3.1. Overview
- 11.2.3.2. Products
- 11.2.3.3. SWOT Analysis
- 11.2.3.4. Recent Developments
- 11.2.3.5. Financials (Based on Availability)
- 11.2.4 Saipem (Eni)
- 11.2.4.1. Overview
- 11.2.4.2. Products
- 11.2.4.3. SWOT Analysis
- 11.2.4.4. Recent Developments
- 11.2.4.5. Financials (Based on Availability)
- 11.2.5 Larsen & Toubro
- 11.2.5.1. Overview
- 11.2.5.2. Products
- 11.2.5.3. SWOT Analysis
- 11.2.5.4. Recent Developments
- 11.2.5.5. Financials (Based on Availability)
- 11.2.6 AtkinsRealis
- 11.2.6.1. Overview
- 11.2.6.2. Products
- 11.2.6.3. SWOT Analysis
- 11.2.6.4. Recent Developments
- 11.2.6.5. Financials (Based on Availability)
- 11.2.7 McDermott International
- 11.2.7.1. Overview
- 11.2.7.2. Products
- 11.2.7.3. SWOT Analysis
- 11.2.7.4. Recent Developments
- 11.2.7.5. Financials (Based on Availability)
- 11.2.8 Samsung E&A
- 11.2.8.1. Overview
- 11.2.8.2. Products
- 11.2.8.3. SWOT Analysis
- 11.2.8.4. Recent Developments
- 11.2.8.5. Financials (Based on Availability)
- 11.2.9 Technip Energies
- 11.2.9.1. Overview
- 11.2.9.2. Products
- 11.2.9.3. SWOT Analysis
- 11.2.9.4. Recent Developments
- 11.2.9.5. Financials (Based on Availability)
- 11.2.10 John Wood Group
- 11.2.10.1. Overview
- 11.2.10.2. Products
- 11.2.10.3. SWOT Analysis
- 11.2.10.4. Recent Developments
- 11.2.10.5. Financials (Based on Availability)
- 11.2.11 Hyundai E&C
- 11.2.11.1. Overview
- 11.2.11.2. Products
- 11.2.11.3. SWOT Analysis
- 11.2.11.4. Recent Developments
- 11.2.11.5. Financials (Based on Availability)
- 11.2.12 Maire Tecnimont
- 11.2.12.1. Overview
- 11.2.12.2. Products
- 11.2.12.3. SWOT Analysis
- 11.2.12.4. Recent Developments
- 11.2.12.5. Financials (Based on Availability)
- 11.2.13 JGC Corporation
- 11.2.13.1. Overview
- 11.2.13.2. Products
- 11.2.13.3. SWOT Analysis
- 11.2.13.4. Recent Developments
- 11.2.13.5. Financials (Based on Availability)
- 11.2.14 Chiyoda Corporation
- 11.2.14.1. Overview
- 11.2.14.2. Products
- 11.2.14.3. SWOT Analysis
- 11.2.14.4. Recent Developments
- 11.2.14.5. Financials (Based on Availability)
- 11.2.15 GS E&C
- 11.2.15.1. Overview
- 11.2.15.2. Products
- 11.2.15.3. SWOT Analysis
- 11.2.15.4. Recent Developments
- 11.2.15.5. Financials (Based on Availability)
- 11.2.16 Petrofac
- 11.2.16.1. Overview
- 11.2.16.2. Products
- 11.2.16.3. SWOT Analysis
- 11.2.16.4. Recent Developments
- 11.2.16.5. Financials (Based on Availability)
- 11.2.17 NMDC Energy
- 11.2.17.1. Overview
- 11.2.17.2. Products
- 11.2.17.3. SWOT Analysis
- 11.2.17.4. Recent Developments
- 11.2.17.5. Financials (Based on Availability)
- 11.2.18 KBR
- 11.2.18.1. Overview
- 11.2.18.2. Products
- 11.2.18.3. SWOT Analysis
- 11.2.18.4. Recent Developments
- 11.2.18.5. Financials (Based on Availability)
- 11.2.19 Doosan Enerbility
- 11.2.19.1. Overview
- 11.2.19.2. Products
- 11.2.19.3. SWOT Analysis
- 11.2.19.4. Recent Developments
- 11.2.19.5. Financials (Based on Availability)
- 11.2.20 Toyo Engineering Corporation
- 11.2.20.1. Overview
- 11.2.20.2. Products
- 11.2.20.3. SWOT Analysis
- 11.2.20.4. Recent Developments
- 11.2.20.5. Financials (Based on Availability)
- 11.2.21 Hitachi Plant Construction
- 11.2.21.1. Overview
- 11.2.21.2. Products
- 11.2.21.3. SWOT Analysis
- 11.2.21.4. Recent Developments
- 11.2.21.5. Financials (Based on Availability)
- 11.2.22 Nuberg EPC
- 11.2.22.1. Overview
- 11.2.22.2. Products
- 11.2.22.3. SWOT Analysis
- 11.2.22.4. Recent Developments
- 11.2.22.5. Financials (Based on Availability)
- 11.2.1 Fluor Corporation
List of Figures
- Figure 1: Global Plant Design Service Revenue Breakdown (million, %) by Region 2025 & 2033
- Figure 2: North America Plant Design Service Revenue (million), by Application 2025 & 2033
- Figure 3: North America Plant Design Service Revenue Share (%), by Application 2025 & 2033
- Figure 4: North America Plant Design Service Revenue (million), by Types 2025 & 2033
- Figure 5: North America Plant Design Service Revenue Share (%), by Types 2025 & 2033
- Figure 6: North America Plant Design Service Revenue (million), by Country 2025 & 2033
- Figure 7: North America Plant Design Service Revenue Share (%), by Country 2025 & 2033
- Figure 8: South America Plant Design Service Revenue (million), by Application 2025 & 2033
- Figure 9: South America Plant Design Service Revenue Share (%), by Application 2025 & 2033
- Figure 10: South America Plant Design Service Revenue (million), by Types 2025 & 2033
- Figure 11: South America Plant Design Service Revenue Share (%), by Types 2025 & 2033
- Figure 12: South America Plant Design Service Revenue (million), by Country 2025 & 2033
- Figure 13: South America Plant Design Service Revenue Share (%), by Country 2025 & 2033
- Figure 14: Europe Plant Design Service Revenue (million), by Application 2025 & 2033
- Figure 15: Europe Plant Design Service Revenue Share (%), by Application 2025 & 2033
- Figure 16: Europe Plant Design Service Revenue (million), by Types 2025 & 2033
- Figure 17: Europe Plant Design Service Revenue Share (%), by Types 2025 & 2033
- Figure 18: Europe Plant Design Service Revenue (million), by Country 2025 & 2033
- Figure 19: Europe Plant Design Service Revenue Share (%), by Country 2025 & 2033
- Figure 20: Middle East & Africa Plant Design Service Revenue (million), by Application 2025 & 2033
- Figure 21: Middle East & Africa Plant Design Service Revenue Share (%), by Application 2025 & 2033
- Figure 22: Middle East & Africa Plant Design Service Revenue (million), by Types 2025 & 2033
- Figure 23: Middle East & Africa Plant Design Service Revenue Share (%), by Types 2025 & 2033
- Figure 24: Middle East & Africa Plant Design Service Revenue (million), by Country 2025 & 2033
- Figure 25: Middle East & Africa Plant Design Service Revenue Share (%), by Country 2025 & 2033
- Figure 26: Asia Pacific Plant Design Service Revenue (million), by Application 2025 & 2033
- Figure 27: Asia Pacific Plant Design Service Revenue Share (%), by Application 2025 & 2033
- Figure 28: Asia Pacific Plant Design Service Revenue (million), by Types 2025 & 2033
- Figure 29: Asia Pacific Plant Design Service Revenue Share (%), by Types 2025 & 2033
- Figure 30: Asia Pacific Plant Design Service Revenue (million), by Country 2025 & 2033
- Figure 31: Asia Pacific Plant Design Service Revenue Share (%), by Country 2025 & 2033
List of Tables
- Table 1: Global Plant Design Service Revenue million Forecast, by Application 2020 & 2033
- Table 2: Global Plant Design Service Revenue million Forecast, by Types 2020 & 2033
- Table 3: Global Plant Design Service Revenue million Forecast, by Region 2020 & 2033
- Table 4: Global Plant Design Service Revenue million Forecast, by Application 2020 & 2033
- Table 5: Global Plant Design Service Revenue million Forecast, by Types 2020 & 2033
- Table 6: Global Plant Design Service Revenue million Forecast, by Country 2020 & 2033
- Table 7: United States Plant Design Service Revenue (million) Forecast, by Application 2020 & 2033
- Table 8: Canada Plant Design Service Revenue (million) Forecast, by Application 2020 & 2033
- Table 9: Mexico Plant Design Service Revenue (million) Forecast, by Application 2020 & 2033
- Table 10: Global Plant Design Service Revenue million Forecast, by Application 2020 & 2033
- Table 11: Global Plant Design Service Revenue million Forecast, by Types 2020 & 2033
- Table 12: Global Plant Design Service Revenue million Forecast, by Country 2020 & 2033
- Table 13: Brazil Plant Design Service Revenue (million) Forecast, by Application 2020 & 2033
- Table 14: Argentina Plant Design Service Revenue (million) Forecast, by Application 2020 & 2033
- Table 15: Rest of South America Plant Design Service Revenue (million) Forecast, by Application 2020 & 2033
- Table 16: Global Plant Design Service Revenue million Forecast, by Application 2020 & 2033
- Table 17: Global Plant Design Service Revenue million Forecast, by Types 2020 & 2033
- Table 18: Global Plant Design Service Revenue million Forecast, by Country 2020 & 2033
- Table 19: United Kingdom Plant Design Service Revenue (million) Forecast, by Application 2020 & 2033
- Table 20: Germany Plant Design Service Revenue (million) Forecast, by Application 2020 & 2033
- Table 21: France Plant Design Service Revenue (million) Forecast, by Application 2020 & 2033
- Table 22: Italy Plant Design Service Revenue (million) Forecast, by Application 2020 & 2033
- Table 23: Spain Plant Design Service Revenue (million) Forecast, by Application 2020 & 2033
- Table 24: Russia Plant Design Service Revenue (million) Forecast, by Application 2020 & 2033
- Table 25: Benelux Plant Design Service Revenue (million) Forecast, by Application 2020 & 2033
- Table 26: Nordics Plant Design Service Revenue (million) Forecast, by Application 2020 & 2033
- Table 27: Rest of Europe Plant Design Service Revenue (million) Forecast, by Application 2020 & 2033
- Table 28: Global Plant Design Service Revenue million Forecast, by Application 2020 & 2033
- Table 29: Global Plant Design Service Revenue million Forecast, by Types 2020 & 2033
- Table 30: Global Plant Design Service Revenue million Forecast, by Country 2020 & 2033
- Table 31: Turkey Plant Design Service Revenue (million) Forecast, by Application 2020 & 2033
- Table 32: Israel Plant Design Service Revenue (million) Forecast, by Application 2020 & 2033
- Table 33: GCC Plant Design Service Revenue (million) Forecast, by Application 2020 & 2033
- Table 34: North Africa Plant Design Service Revenue (million) Forecast, by Application 2020 & 2033
- Table 35: South Africa Plant Design Service Revenue (million) Forecast, by Application 2020 & 2033
- Table 36: Rest of Middle East & Africa Plant Design Service Revenue (million) Forecast, by Application 2020 & 2033
- Table 37: Global Plant Design Service Revenue million Forecast, by Application 2020 & 2033
- Table 38: Global Plant Design Service Revenue million Forecast, by Types 2020 & 2033
- Table 39: Global Plant Design Service Revenue million Forecast, by Country 2020 & 2033
- Table 40: China Plant Design Service Revenue (million) Forecast, by Application 2020 & 2033
- Table 41: India Plant Design Service Revenue (million) Forecast, by Application 2020 & 2033
- Table 42: Japan Plant Design Service Revenue (million) Forecast, by Application 2020 & 2033
- Table 43: South Korea Plant Design Service Revenue (million) Forecast, by Application 2020 & 2033
- Table 44: ASEAN Plant Design Service Revenue (million) Forecast, by Application 2020 & 2033
- Table 45: Oceania Plant Design Service Revenue (million) Forecast, by Application 2020 & 2033
- Table 46: Rest of Asia Pacific Plant Design Service Revenue (million) Forecast, by Application 2020 & 2033
Frequently Asked Questions
1. What is the projected Compound Annual Growth Rate (CAGR) of the Plant Design Service?
The projected CAGR is approximately 4%.
2. Which companies are prominent players in the Plant Design Service?
Key companies in the market include Fluor Corporation, CPEC(CNPC), Bechtel Corporation, Saipem (Eni), Larsen & Toubro, AtkinsRealis, McDermott International, Samsung E&A, Technip Energies, John Wood Group, Hyundai E&C, Maire Tecnimont, JGC Corporation, Chiyoda Corporation, GS E&C, Petrofac, NMDC Energy, KBR, Doosan Enerbility, Toyo Engineering Corporation, Hitachi Plant Construction, Nuberg EPC.
3. What are the main segments of the Plant Design Service?
The market segments include Application, Types.
4. Can you provide details about the market size?
The market size is estimated to be USD 341920 million as of 2022.
5. What are some drivers contributing to market growth?
N/A
6. What are the notable trends driving market growth?
N/A
7. Are there any restraints impacting market growth?
N/A
8. Can you provide examples of recent developments in the market?
N/A
9. What pricing options are available for accessing the report?
Pricing options include single-user, multi-user, and enterprise licenses priced at USD 3950.00, USD 5925.00, and USD 7900.00 respectively.
10. Is the market size provided in terms of value or volume?
The market size is provided in terms of value, measured in million.
11. Are there any specific market keywords associated with the report?
Yes, the market keyword associated with the report is "Plant Design Service," which aids in identifying and referencing the specific market segment covered.
12. How do I determine which pricing option suits my needs best?
The pricing options vary based on user requirements and access needs. Individual users may opt for single-user licenses, while businesses requiring broader access may choose multi-user or enterprise licenses for cost-effective access to the report.
13. Are there any additional resources or data provided in the Plant Design Service report?
While the report offers comprehensive insights, it's advisable to review the specific contents or supplementary materials provided to ascertain if additional resources or data are available.
14. How can I stay updated on further developments or reports in the Plant Design Service?
To stay informed about further developments, trends, and reports in the Plant Design Service, consider subscribing to industry newsletters, following relevant companies and organizations, or regularly checking reputable industry news sources and publications.
Methodology
Step 1 - Identification of Relevant Samples Size from Population Database


Step 2 - Approaches for Defining Global Market Size (Value, Volume* & Price*)

Note*: In applicable scenarios
Step 3 - Data Sources
Primary Research
- Web Analytics
- Survey Reports
- Research Institute
- Latest Research Reports
- Opinion Leaders
Secondary Research
- Annual Reports
- White Paper
- Latest Press Release
- Industry Association
- Paid Database
- Investor Presentations

Step 4 - Data Triangulation
Involves using different sources of information in order to increase the validity of a study
These sources are likely to be stakeholders in a program - participants, other researchers, program staff, other community members, and so on.
Then we put all data in single framework & apply various statistical tools to find out the dynamic on the market.
During the analysis stage, feedback from the stakeholder groups would be compared to determine areas of agreement as well as areas of divergence