

Key Insights
The Middle East and Africa (MEA) payments market is poised for significant expansion, fueled by escalating smartphone adoption, growing e-commerce penetration, and the rapid development of a digital economy. The market, valued at approximately $20672.1 million in 2024, is projected to achieve a Compound Annual Growth Rate (CAGR) of 7.1% over the forecast period of 2024-2033. Key growth drivers include the widespread adoption of mobile money services, particularly in Sub-Saharan Africa, the increasing preference for contactless transactions, and government-led financial inclusion initiatives across the region. The diverse payment ecosystem, encompassing point-of-sale (POS) terminals, online platforms, and mobile wallets, effectively addresses the varied demands and technological capacities of different market segments within MEA. Furthermore, the emergence of innovative fintech companies and strategic collaborations between established financial institutions and technology providers are accelerating innovation, fostering competition, and enhancing both customer experience and payment accessibility.
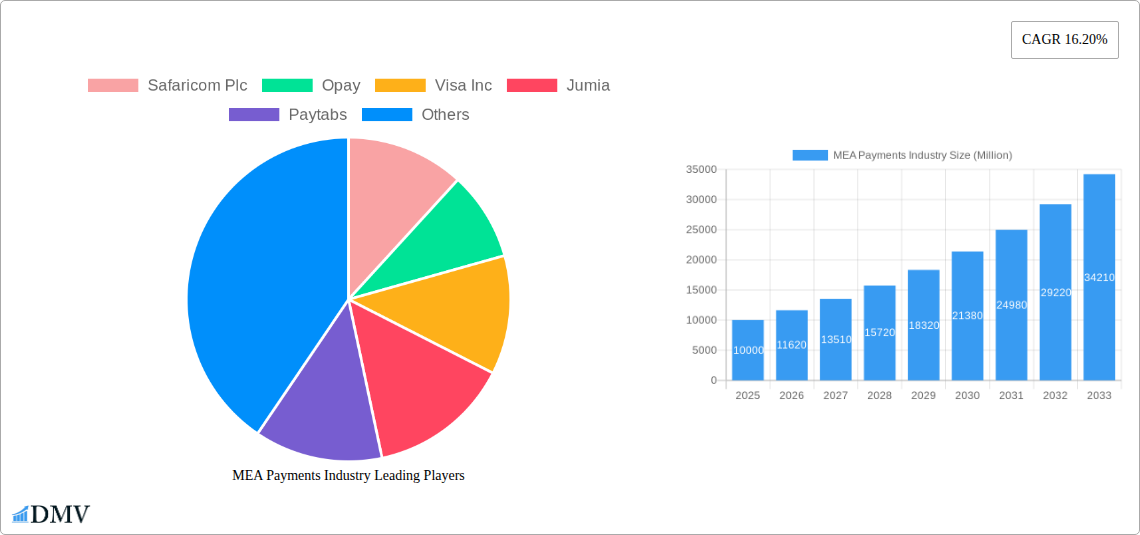
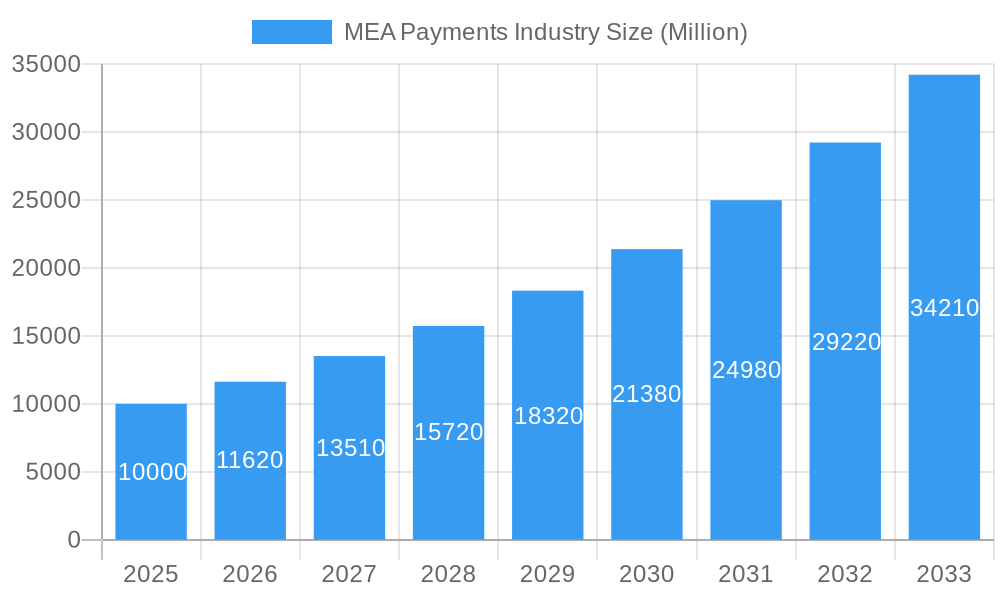
MEA Payments Industry Market Size (In Billion)
Regional disparities are evident within the MEA payments landscape. While nations such as South Africa, the United Arab Emirates, and Saudi Arabia are at the forefront of digital payment adoption, other MEA sub-regions are also experiencing substantial growth, albeit at a potentially more gradual pace. The retail, entertainment, and healthcare sectors are primary contributors to market expansion, with notable growth also anticipated in the hospitality industry. Nevertheless, persistent challenges, including infrastructure limitations in select areas, cybersecurity vulnerabilities, and varying levels of financial literacy among the populace, require strategic attention. Overcoming these obstacles is paramount to ensuring the sustained and inclusive advancement of the MEA payments sector. Continued investment in infrastructure, regulatory clarity, and comprehensive consumer education programs will be instrumental in realizing the full potential of this dynamic market.
MEA Payments Industry Company Market Share
MEA Payments Market Analysis: Trends, Opportunities, and Forecast (2024-2033)
This comprehensive report delivers an in-depth analysis of the Middle East and Africa (MEA) payments industry, examining key market trends, leading stakeholders, and future growth projections. The analysis encompasses the period from 2024 to 2033, with 2024 designated as the base and estimated year. The MEA payments market is forecasted to reach substantial valuations by 2033, exhibiting robust growth propelled by increasing smartphone penetration, expanding e-commerce activities, and supportive governmental policies. This report is essential for stakeholders aiming to comprehend the intricate dynamics of this rapidly evolving sector and to identify and leverage emerging opportunities.
MEA Payments Industry Market Composition & Trends
This section delves into the competitive landscape of the MEA payments industry, analyzing market concentration, innovation drivers, regulatory frameworks, substitute payment methods, end-user profiles, and merger & acquisition (M&A) activities. The MEA payments market is characterized by a blend of established international players and rapidly growing regional fintech companies. Market share is distributed among these players, with Safaricom Plc, Visa Inc, and Interswitch Ltd holding significant positions. However, the market is witnessing increased competition from companies like Opay, Jumia, Paytabs, and PalmPay Technology Co Ltd, reflecting the dynamism of the region’s fintech landscape.
- Market Concentration: Moderately concentrated, with a few major players alongside numerous smaller competitors. xx% market share held by top 5 players in 2024.
- Innovation Catalysts: Rapid technological advancements, increasing mobile penetration, and a burgeoning e-commerce sector are major catalysts.
- Regulatory Landscape: Varies significantly across MEA countries, impacting market entry and operation. Harmonization efforts are underway but face challenges.
- Substitute Products: Cash remains a significant competitor, particularly in less developed areas. However, digital payment solutions are progressively gaining traction.
- End-user Profiles: Vary widely based on demographics, location, and technological literacy, necessitating tailored payment solutions.
- M&A Activities: The MEA region witnessed xx Million in M&A deal value in the payments industry during 2019-2024. Consolidation is expected to continue, driving growth and innovation.
MEA Payments Industry Industry Evolution
This section analyzes the evolutionary trajectory of the MEA payments market, focusing on growth rates, technological advancements, and shifting consumer preferences. The industry is experiencing a significant shift from traditional payment methods to digital solutions. The growth has been propelled by rising smartphone adoption, increased internet penetration, and the rapid expansion of e-commerce. The adoption of mobile money has been particularly strong in several MEA countries, largely driven by the success of platforms like M-Pesa. The market has witnessed a substantial increase in the adoption of digital wallets, online banking, and mobile payment apps.
The historical period (2019-2024) showed an average annual growth rate (AAGR) of xx%, while the forecast period (2025-2033) is projected to maintain a healthy AAGR of xx%, primarily driven by increased financial inclusion initiatives, improvements in digital infrastructure, and evolving consumer behavior. The integration of new technologies, such as artificial intelligence (AI) and blockchain, will further enhance the efficiency and security of payment systems. By 2033, the penetration of digital payments is expected to reach xx% across the MEA region.
Leading Regions, Countries, or Segments in MEA Payments Industry
This section identifies and analyzes the dominant regions, countries, and segments within the MEA payments market.
Dominant Segments:
- By Country: The United Arab Emirates (UAE) and South Africa currently lead the market, fueled by robust digital infrastructure and high levels of financial inclusion. Saudi Arabia is also a rapidly growing market.
- By End-user Industry: Retail and e-commerce are the most significant segments, contributing to a substantial portion of transaction volume. Hospitality and online sales are also showing significant growth.
- By Mode of Payment: Mobile money and digital wallets are experiencing the most rapid growth, surpassing the use of traditional methods like point-of-sale (POS) systems in several markets.
Key Drivers:
- High Smartphone Penetration: MEA boasts a rapidly increasing smartphone user base, creating a fertile ground for mobile payment adoption.
- Government Support: Many MEA governments are actively promoting financial inclusion and digitalization through supportive regulations and initiatives.
- Increased E-commerce Adoption: The booming e-commerce industry is driving demand for secure and convenient online payment solutions.
The dominance of these segments is attributed to factors such as supportive government regulations, investment in digital infrastructure, and a high rate of smartphone penetration and the rise of e-commerce in the region.
MEA Payments Industry Product Innovations
The MEA payments industry is witnessing a wave of innovative products and services. Mobile money platforms like M-Pesa continue to evolve, offering a wider range of financial services beyond basic payments. New payment gateways are emerging, simplifying online transactions and supporting diverse payment methods. Biometric authentication and AI-powered fraud detection systems are enhancing security and trust. The adoption of blockchain technology is also gaining traction, promising greater transparency and efficiency in cross-border payments. These innovations are aimed at addressing the specific needs of the MEA market, promoting financial inclusion, and enhancing the overall user experience.
Propelling Factors for MEA Payments Industry Growth
Several key factors are driving the growth of the MEA payments industry. Technological advancements such as the rise of mobile money and digital wallets are transforming the way people make payments. The expanding e-commerce sector fuels the demand for secure and convenient online payment options. Supportive government regulations and initiatives promoting financial inclusion are creating a conducive environment for growth. Economic factors such as increasing disposable incomes and rising consumer spending also contribute significantly to the industry's expansion. The ongoing investments in digital infrastructure are further facilitating the transition towards a cashless society.
Obstacles in the MEA Payments Industry Market
Despite its potential, the MEA payments industry faces several obstacles. Regulatory inconsistencies across different countries can create hurdles for companies operating in multiple markets. Supply chain disruptions can impact the availability of payment equipment and services. Intense competition among established players and new entrants exerts pressure on margins and profitability. Addressing these challenges is critical for sustaining the industry’s growth trajectory. The lack of financial literacy among some population segments also limits the adoption of digital payment solutions.
Future Opportunities in MEA Payments Industry
The MEA payments industry presents numerous future opportunities. The expansion of payment services into underserved rural areas offers significant potential. The integration of innovative technologies such as AI, machine learning, and blockchain can enhance efficiency, security, and the overall user experience. The growing adoption of super apps offering a range of financial and non-financial services creates new avenues for growth. Targeting specific demographic segments with tailored payment solutions will further unlock growth opportunities. Focusing on cross-border payments will facilitate trade and commerce within the MEA region.
Major Players in the MEA Payments Industry Ecosystem
- Safaricom Plc
- Opay
- Visa Inc
- Jumia
- Paytabs
- PalmPay Technology Co Ltd
- Interswitch Ltd
- Amazon com Inc
- Apple Inc
- Network International Holdings Plc
- List Not Exhaustive
Key Developments in MEA Payments Industry Industry
- August 2021: Visa was the first firm in Sudan to introduce digital payments, collaborating with eight licensed partners to expand access to payment technology.
- June 2022: The London Internet Exchange (LINX) partnered with IXAfrica to establish a new interconnection facility in Nairobi, enhancing digital infrastructure in Africa.
Strategic MEA Payments Industry Market Forecast
The MEA payments industry is poised for significant growth in the coming years, driven by continued technological advancements, expanding e-commerce, and supportive government policies. The increasing adoption of digital payment solutions, particularly mobile money and digital wallets, will be a key driver of market expansion. The forecast period will see increased competition, consolidation through mergers and acquisitions, and a focus on innovation to meet the evolving needs of consumers and businesses. The market is expected to demonstrate significant growth and maturity, creating lucrative opportunities for both established players and new entrants.
MEA Payments Industry Segmentation
-
1. Mode of Payment
-
1.1. Point of Sale
- 1.1.1. Card Pay
- 1.1.2. Digital Wallet (Includes Mobile Wallets)
- 1.1.3. Cash
- 1.1.4. Others
-
1.2. Online Sale
- 1.2.1. Others (
-
1.1. Point of Sale
-
2. End-user Industry
- 2.1. Retail
- 2.2. Entertainment
- 2.3. Healthcare
- 2.4. Hospitality
- 2.5. Other End-user Industries
MEA Payments Industry Segmentation By Geography
-
1. North America
- 1.1. United States
- 1.2. Canada
- 1.3. Mexico
-
2. South America
- 2.1. Brazil
- 2.2. Argentina
- 2.3. Rest of South America
-
3. Europe
- 3.1. United Kingdom
- 3.2. Germany
- 3.3. France
- 3.4. Italy
- 3.5. Spain
- 3.6. Russia
- 3.7. Benelux
- 3.8. Nordics
- 3.9. Rest of Europe
-
4. Middle East & Africa
- 4.1. Turkey
- 4.2. Israel
- 4.3. GCC
- 4.4. North Africa
- 4.5. South Africa
- 4.6. Rest of Middle East & Africa
-
5. Asia Pacific
- 5.1. China
- 5.2. India
- 5.3. Japan
- 5.4. South Korea
- 5.5. ASEAN
- 5.6. Oceania
- 5.7. Rest of Asia Pacific
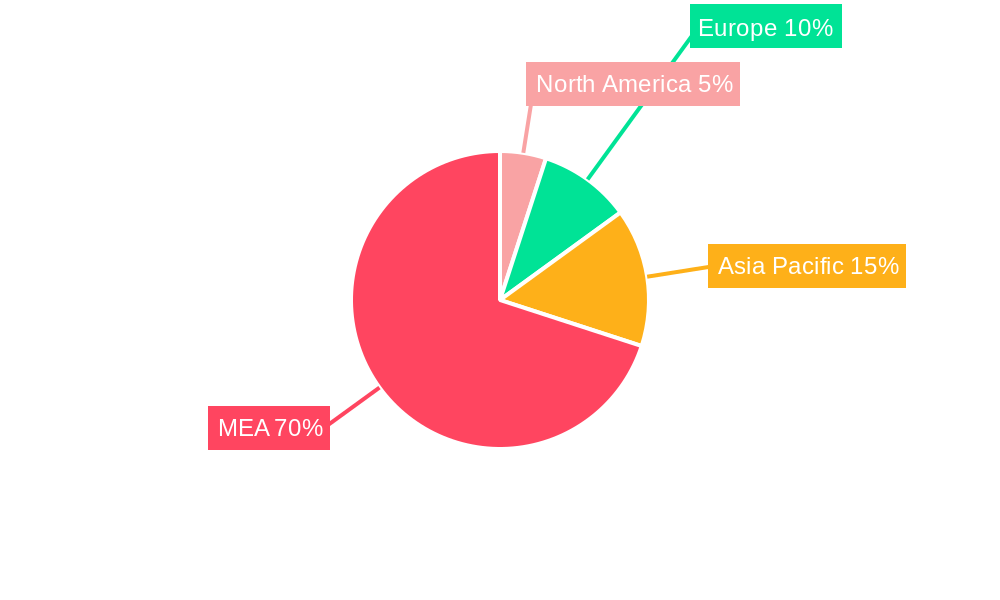
MEA Payments Industry Regional Market Share
Geographic Coverage of MEA Payments Industry
MEA Payments Industry REPORT HIGHLIGHTS
| Aspects | Details |
|---|---|
| Study Period | 2020-2034 |
| Base Year | 2025 |
| Estimated Year | 2026 |
| Forecast Period | 2026-2034 |
| Historical Period | 2020-2025 |
| Growth Rate | CAGR of 7.1% from 2020-2034 |
| Segmentation |
|
Table of Contents
- 1. Introduction
- 1.1. Research Scope
- 1.2. Market Segmentation
- 1.3. Research Methodology
- 1.4. Definitions and Assumptions
- 2. Executive Summary
- 2.1. Introduction
- 3. Market Dynamics
- 3.1. Introduction
- 3.2. Market Drivers
- 3.2.1 Digital adoption is Accelerating the Payments Market in Middle East and Africa; Key Retailers and the Government are Promoting Market Digitization Through Activation Programs; Increase in Real-Time Payments
- 3.2.2 Particularly Buy Now Pay Later
- 3.3. Market Restrains
- 3.3.1. Lack of Standards in Applications and Initial Costs
- 3.4. Market Trends
- 3.4.1. Digital adoption is Accelerating the Payments Market in Middle East and Africa
- 4. Market Factor Analysis
- 4.1. Porters Five Forces
- 4.2. Supply/Value Chain
- 4.3. PESTEL analysis
- 4.4. Market Entropy
- 4.5. Patent/Trademark Analysis
- 5. Global MEA Payments Industry Analysis, Insights and Forecast, 2020-2032
- 5.1. Market Analysis, Insights and Forecast - by Mode of Payment
- 5.1.1. Point of Sale
- 5.1.1.1. Card Pay
- 5.1.1.2. Digital Wallet (Includes Mobile Wallets)
- 5.1.1.3. Cash
- 5.1.1.4. Others
- 5.1.2. Online Sale
- 5.1.2.1. Others (
- 5.1.1. Point of Sale
- 5.2. Market Analysis, Insights and Forecast - by End-user Industry
- 5.2.1. Retail
- 5.2.2. Entertainment
- 5.2.3. Healthcare
- 5.2.4. Hospitality
- 5.2.5. Other End-user Industries
- 5.3. Market Analysis, Insights and Forecast - by Region
- 5.3.1. North America
- 5.3.2. South America
- 5.3.3. Europe
- 5.3.4. Middle East & Africa
- 5.3.5. Asia Pacific
- 5.1. Market Analysis, Insights and Forecast - by Mode of Payment
- 6. North America MEA Payments Industry Analysis, Insights and Forecast, 2020-2032
- 6.1. Market Analysis, Insights and Forecast - by Mode of Payment
- 6.1.1. Point of Sale
- 6.1.1.1. Card Pay
- 6.1.1.2. Digital Wallet (Includes Mobile Wallets)
- 6.1.1.3. Cash
- 6.1.1.4. Others
- 6.1.2. Online Sale
- 6.1.2.1. Others (
- 6.1.1. Point of Sale
- 6.2. Market Analysis, Insights and Forecast - by End-user Industry
- 6.2.1. Retail
- 6.2.2. Entertainment
- 6.2.3. Healthcare
- 6.2.4. Hospitality
- 6.2.5. Other End-user Industries
- 6.1. Market Analysis, Insights and Forecast - by Mode of Payment
- 7. South America MEA Payments Industry Analysis, Insights and Forecast, 2020-2032
- 7.1. Market Analysis, Insights and Forecast - by Mode of Payment
- 7.1.1. Point of Sale
- 7.1.1.1. Card Pay
- 7.1.1.2. Digital Wallet (Includes Mobile Wallets)
- 7.1.1.3. Cash
- 7.1.1.4. Others
- 7.1.2. Online Sale
- 7.1.2.1. Others (
- 7.1.1. Point of Sale
- 7.2. Market Analysis, Insights and Forecast - by End-user Industry
- 7.2.1. Retail
- 7.2.2. Entertainment
- 7.2.3. Healthcare
- 7.2.4. Hospitality
- 7.2.5. Other End-user Industries
- 7.1. Market Analysis, Insights and Forecast - by Mode of Payment
- 8. Europe MEA Payments Industry Analysis, Insights and Forecast, 2020-2032
- 8.1. Market Analysis, Insights and Forecast - by Mode of Payment
- 8.1.1. Point of Sale
- 8.1.1.1. Card Pay
- 8.1.1.2. Digital Wallet (Includes Mobile Wallets)
- 8.1.1.3. Cash
- 8.1.1.4. Others
- 8.1.2. Online Sale
- 8.1.2.1. Others (
- 8.1.1. Point of Sale
- 8.2. Market Analysis, Insights and Forecast - by End-user Industry
- 8.2.1. Retail
- 8.2.2. Entertainment
- 8.2.3. Healthcare
- 8.2.4. Hospitality
- 8.2.5. Other End-user Industries
- 8.1. Market Analysis, Insights and Forecast - by Mode of Payment
- 9. Middle East & Africa MEA Payments Industry Analysis, Insights and Forecast, 2020-2032
- 9.1. Market Analysis, Insights and Forecast - by Mode of Payment
- 9.1.1. Point of Sale
- 9.1.1.1. Card Pay
- 9.1.1.2. Digital Wallet (Includes Mobile Wallets)
- 9.1.1.3. Cash
- 9.1.1.4. Others
- 9.1.2. Online Sale
- 9.1.2.1. Others (
- 9.1.1. Point of Sale
- 9.2. Market Analysis, Insights and Forecast - by End-user Industry
- 9.2.1. Retail
- 9.2.2. Entertainment
- 9.2.3. Healthcare
- 9.2.4. Hospitality
- 9.2.5. Other End-user Industries
- 9.1. Market Analysis, Insights and Forecast - by Mode of Payment
- 10. Asia Pacific MEA Payments Industry Analysis, Insights and Forecast, 2020-2032
- 10.1. Market Analysis, Insights and Forecast - by Mode of Payment
- 10.1.1. Point of Sale
- 10.1.1.1. Card Pay
- 10.1.1.2. Digital Wallet (Includes Mobile Wallets)
- 10.1.1.3. Cash
- 10.1.1.4. Others
- 10.1.2. Online Sale
- 10.1.2.1. Others (
- 10.1.1. Point of Sale
- 10.2. Market Analysis, Insights and Forecast - by End-user Industry
- 10.2.1. Retail
- 10.2.2. Entertainment
- 10.2.3. Healthcare
- 10.2.4. Hospitality
- 10.2.5. Other End-user Industries
- 10.1. Market Analysis, Insights and Forecast - by Mode of Payment
- 11. Competitive Analysis
- 11.1. Global Market Share Analysis 2025
- 11.2. Company Profiles
- 11.2.1 Safaricom Plc
- 11.2.1.1. Overview
- 11.2.1.2. Products
- 11.2.1.3. SWOT Analysis
- 11.2.1.4. Recent Developments
- 11.2.1.5. Financials (Based on Availability)
- 11.2.2 Opay
- 11.2.2.1. Overview
- 11.2.2.2. Products
- 11.2.2.3. SWOT Analysis
- 11.2.2.4. Recent Developments
- 11.2.2.5. Financials (Based on Availability)
- 11.2.3 Visa Inc
- 11.2.3.1. Overview
- 11.2.3.2. Products
- 11.2.3.3. SWOT Analysis
- 11.2.3.4. Recent Developments
- 11.2.3.5. Financials (Based on Availability)
- 11.2.4 Jumia
- 11.2.4.1. Overview
- 11.2.4.2. Products
- 11.2.4.3. SWOT Analysis
- 11.2.4.4. Recent Developments
- 11.2.4.5. Financials (Based on Availability)
- 11.2.5 Paytabs
- 11.2.5.1. Overview
- 11.2.5.2. Products
- 11.2.5.3. SWOT Analysis
- 11.2.5.4. Recent Developments
- 11.2.5.5. Financials (Based on Availability)
- 11.2.6 PalmPay Technology Co Ltd
- 11.2.6.1. Overview
- 11.2.6.2. Products
- 11.2.6.3. SWOT Analysis
- 11.2.6.4. Recent Developments
- 11.2.6.5. Financials (Based on Availability)
- 11.2.7 Interswitch Ltd
- 11.2.7.1. Overview
- 11.2.7.2. Products
- 11.2.7.3. SWOT Analysis
- 11.2.7.4. Recent Developments
- 11.2.7.5. Financials (Based on Availability)
- 11.2.8 Amazon com Inc *List Not Exhaustive
- 11.2.8.1. Overview
- 11.2.8.2. Products
- 11.2.8.3. SWOT Analysis
- 11.2.8.4. Recent Developments
- 11.2.8.5. Financials (Based on Availability)
- 11.2.9 Apple Inc
- 11.2.9.1. Overview
- 11.2.9.2. Products
- 11.2.9.3. SWOT Analysis
- 11.2.9.4. Recent Developments
- 11.2.9.5. Financials (Based on Availability)
- 11.2.10 Network International Holdings Plc
- 11.2.10.1. Overview
- 11.2.10.2. Products
- 11.2.10.3. SWOT Analysis
- 11.2.10.4. Recent Developments
- 11.2.10.5. Financials (Based on Availability)
- 11.2.1 Safaricom Plc
List of Figures
- Figure 1: Global MEA Payments Industry Revenue Breakdown (million, %) by Region 2025 & 2033
- Figure 2: North America MEA Payments Industry Revenue (million), by Mode of Payment 2025 & 2033
- Figure 3: North America MEA Payments Industry Revenue Share (%), by Mode of Payment 2025 & 2033
- Figure 4: North America MEA Payments Industry Revenue (million), by End-user Industry 2025 & 2033
- Figure 5: North America MEA Payments Industry Revenue Share (%), by End-user Industry 2025 & 2033
- Figure 6: North America MEA Payments Industry Revenue (million), by Country 2025 & 2033
- Figure 7: North America MEA Payments Industry Revenue Share (%), by Country 2025 & 2033
- Figure 8: South America MEA Payments Industry Revenue (million), by Mode of Payment 2025 & 2033
- Figure 9: South America MEA Payments Industry Revenue Share (%), by Mode of Payment 2025 & 2033
- Figure 10: South America MEA Payments Industry Revenue (million), by End-user Industry 2025 & 2033
- Figure 11: South America MEA Payments Industry Revenue Share (%), by End-user Industry 2025 & 2033
- Figure 12: South America MEA Payments Industry Revenue (million), by Country 2025 & 2033
- Figure 13: South America MEA Payments Industry Revenue Share (%), by Country 2025 & 2033
- Figure 14: Europe MEA Payments Industry Revenue (million), by Mode of Payment 2025 & 2033
- Figure 15: Europe MEA Payments Industry Revenue Share (%), by Mode of Payment 2025 & 2033
- Figure 16: Europe MEA Payments Industry Revenue (million), by End-user Industry 2025 & 2033
- Figure 17: Europe MEA Payments Industry Revenue Share (%), by End-user Industry 2025 & 2033
- Figure 18: Europe MEA Payments Industry Revenue (million), by Country 2025 & 2033
- Figure 19: Europe MEA Payments Industry Revenue Share (%), by Country 2025 & 2033
- Figure 20: Middle East & Africa MEA Payments Industry Revenue (million), by Mode of Payment 2025 & 2033
- Figure 21: Middle East & Africa MEA Payments Industry Revenue Share (%), by Mode of Payment 2025 & 2033
- Figure 22: Middle East & Africa MEA Payments Industry Revenue (million), by End-user Industry 2025 & 2033
- Figure 23: Middle East & Africa MEA Payments Industry Revenue Share (%), by End-user Industry 2025 & 2033
- Figure 24: Middle East & Africa MEA Payments Industry Revenue (million), by Country 2025 & 2033
- Figure 25: Middle East & Africa MEA Payments Industry Revenue Share (%), by Country 2025 & 2033
- Figure 26: Asia Pacific MEA Payments Industry Revenue (million), by Mode of Payment 2025 & 2033
- Figure 27: Asia Pacific MEA Payments Industry Revenue Share (%), by Mode of Payment 2025 & 2033
- Figure 28: Asia Pacific MEA Payments Industry Revenue (million), by End-user Industry 2025 & 2033
- Figure 29: Asia Pacific MEA Payments Industry Revenue Share (%), by End-user Industry 2025 & 2033
- Figure 30: Asia Pacific MEA Payments Industry Revenue (million), by Country 2025 & 2033
- Figure 31: Asia Pacific MEA Payments Industry Revenue Share (%), by Country 2025 & 2033
List of Tables
- Table 1: Global MEA Payments Industry Revenue million Forecast, by Mode of Payment 2020 & 2033
- Table 2: Global MEA Payments Industry Revenue million Forecast, by End-user Industry 2020 & 2033
- Table 3: Global MEA Payments Industry Revenue million Forecast, by Region 2020 & 2033
- Table 4: Global MEA Payments Industry Revenue million Forecast, by Mode of Payment 2020 & 2033
- Table 5: Global MEA Payments Industry Revenue million Forecast, by End-user Industry 2020 & 2033
- Table 6: Global MEA Payments Industry Revenue million Forecast, by Country 2020 & 2033
- Table 7: United States MEA Payments Industry Revenue (million) Forecast, by Application 2020 & 2033
- Table 8: Canada MEA Payments Industry Revenue (million) Forecast, by Application 2020 & 2033
- Table 9: Mexico MEA Payments Industry Revenue (million) Forecast, by Application 2020 & 2033
- Table 10: Global MEA Payments Industry Revenue million Forecast, by Mode of Payment 2020 & 2033
- Table 11: Global MEA Payments Industry Revenue million Forecast, by End-user Industry 2020 & 2033
- Table 12: Global MEA Payments Industry Revenue million Forecast, by Country 2020 & 2033
- Table 13: Brazil MEA Payments Industry Revenue (million) Forecast, by Application 2020 & 2033
- Table 14: Argentina MEA Payments Industry Revenue (million) Forecast, by Application 2020 & 2033
- Table 15: Rest of South America MEA Payments Industry Revenue (million) Forecast, by Application 2020 & 2033
- Table 16: Global MEA Payments Industry Revenue million Forecast, by Mode of Payment 2020 & 2033
- Table 17: Global MEA Payments Industry Revenue million Forecast, by End-user Industry 2020 & 2033
- Table 18: Global MEA Payments Industry Revenue million Forecast, by Country 2020 & 2033
- Table 19: United Kingdom MEA Payments Industry Revenue (million) Forecast, by Application 2020 & 2033
- Table 20: Germany MEA Payments Industry Revenue (million) Forecast, by Application 2020 & 2033
- Table 21: France MEA Payments Industry Revenue (million) Forecast, by Application 2020 & 2033
- Table 22: Italy MEA Payments Industry Revenue (million) Forecast, by Application 2020 & 2033
- Table 23: Spain MEA Payments Industry Revenue (million) Forecast, by Application 2020 & 2033
- Table 24: Russia MEA Payments Industry Revenue (million) Forecast, by Application 2020 & 2033
- Table 25: Benelux MEA Payments Industry Revenue (million) Forecast, by Application 2020 & 2033
- Table 26: Nordics MEA Payments Industry Revenue (million) Forecast, by Application 2020 & 2033
- Table 27: Rest of Europe MEA Payments Industry Revenue (million) Forecast, by Application 2020 & 2033
- Table 28: Global MEA Payments Industry Revenue million Forecast, by Mode of Payment 2020 & 2033
- Table 29: Global MEA Payments Industry Revenue million Forecast, by End-user Industry 2020 & 2033
- Table 30: Global MEA Payments Industry Revenue million Forecast, by Country 2020 & 2033
- Table 31: Turkey MEA Payments Industry Revenue (million) Forecast, by Application 2020 & 2033
- Table 32: Israel MEA Payments Industry Revenue (million) Forecast, by Application 2020 & 2033
- Table 33: GCC MEA Payments Industry Revenue (million) Forecast, by Application 2020 & 2033
- Table 34: North Africa MEA Payments Industry Revenue (million) Forecast, by Application 2020 & 2033
- Table 35: South Africa MEA Payments Industry Revenue (million) Forecast, by Application 2020 & 2033
- Table 36: Rest of Middle East & Africa MEA Payments Industry Revenue (million) Forecast, by Application 2020 & 2033
- Table 37: Global MEA Payments Industry Revenue million Forecast, by Mode of Payment 2020 & 2033
- Table 38: Global MEA Payments Industry Revenue million Forecast, by End-user Industry 2020 & 2033
- Table 39: Global MEA Payments Industry Revenue million Forecast, by Country 2020 & 2033
- Table 40: China MEA Payments Industry Revenue (million) Forecast, by Application 2020 & 2033
- Table 41: India MEA Payments Industry Revenue (million) Forecast, by Application 2020 & 2033
- Table 42: Japan MEA Payments Industry Revenue (million) Forecast, by Application 2020 & 2033
- Table 43: South Korea MEA Payments Industry Revenue (million) Forecast, by Application 2020 & 2033
- Table 44: ASEAN MEA Payments Industry Revenue (million) Forecast, by Application 2020 & 2033
- Table 45: Oceania MEA Payments Industry Revenue (million) Forecast, by Application 2020 & 2033
- Table 46: Rest of Asia Pacific MEA Payments Industry Revenue (million) Forecast, by Application 2020 & 2033
Frequently Asked Questions
1. What is the projected Compound Annual Growth Rate (CAGR) of the MEA Payments Industry?
The projected CAGR is approximately 7.1%.
2. Which companies are prominent players in the MEA Payments Industry?
Key companies in the market include Safaricom Plc, Opay, Visa Inc, Jumia, Paytabs, PalmPay Technology Co Ltd, Interswitch Ltd, Amazon com Inc *List Not Exhaustive, Apple Inc, Network International Holdings Plc.
3. What are the main segments of the MEA Payments Industry?
The market segments include Mode of Payment, End-user Industry.
4. Can you provide details about the market size?
The market size is estimated to be USD 20672.1 million as of 2022.
5. What are some drivers contributing to market growth?
Digital adoption is Accelerating the Payments Market in Middle East and Africa; Key Retailers and the Government are Promoting Market Digitization Through Activation Programs; Increase in Real-Time Payments. Particularly Buy Now Pay Later.
6. What are the notable trends driving market growth?
Digital adoption is Accelerating the Payments Market in Middle East and Africa.
7. Are there any restraints impacting market growth?
Lack of Standards in Applications and Initial Costs.
8. Can you provide examples of recent developments in the market?
June 2022 - The London Internet Exchange (LINX), one of the world's largest internet exchange points (IXPs), has announced a strategic partnership with IXAfrica, a Nairobi-based hyperscale data center provider. As part of the agreement, LINX will open a new interconnection facility in Nairobi, marking the company's first physical presence on the African continent.
9. What pricing options are available for accessing the report?
Pricing options include single-user, multi-user, and enterprise licenses priced at USD 4750, USD 4950, and USD 6800 respectively.
10. Is the market size provided in terms of value or volume?
The market size is provided in terms of value, measured in million.
11. Are there any specific market keywords associated with the report?
Yes, the market keyword associated with the report is "MEA Payments Industry," which aids in identifying and referencing the specific market segment covered.
12. How do I determine which pricing option suits my needs best?
The pricing options vary based on user requirements and access needs. Individual users may opt for single-user licenses, while businesses requiring broader access may choose multi-user or enterprise licenses for cost-effective access to the report.
13. Are there any additional resources or data provided in the MEA Payments Industry report?
While the report offers comprehensive insights, it's advisable to review the specific contents or supplementary materials provided to ascertain if additional resources or data are available.
14. How can I stay updated on further developments or reports in the MEA Payments Industry?
To stay informed about further developments, trends, and reports in the MEA Payments Industry, consider subscribing to industry newsletters, following relevant companies and organizations, or regularly checking reputable industry news sources and publications.
Methodology
Step 1 - Identification of Relevant Samples Size from Population Database


Step 2 - Approaches for Defining Global Market Size (Value, Volume* & Price*)

Note*: In applicable scenarios
Step 3 - Data Sources
Primary Research
- Web Analytics
- Survey Reports
- Research Institute
- Latest Research Reports
- Opinion Leaders
Secondary Research
- Annual Reports
- White Paper
- Latest Press Release
- Industry Association
- Paid Database
- Investor Presentations

Step 4 - Data Triangulation
Involves using different sources of information in order to increase the validity of a study
These sources are likely to be stakeholders in a program - participants, other researchers, program staff, other community members, and so on.
Then we put all data in single framework & apply various statistical tools to find out the dynamic on the market.
During the analysis stage, feedback from the stakeholder groups would be compared to determine areas of agreement as well as areas of divergence