

Key Insights
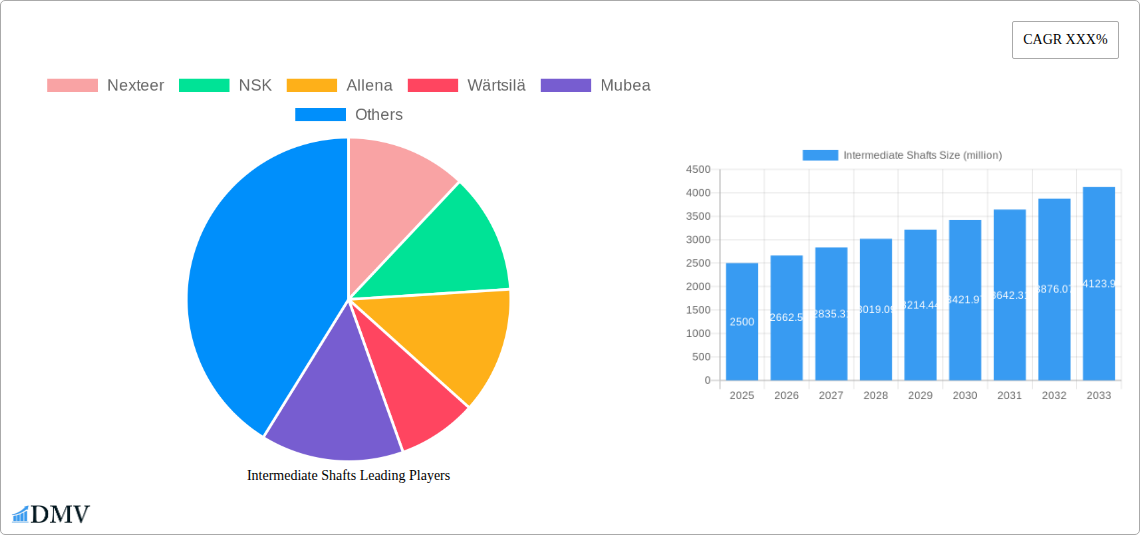
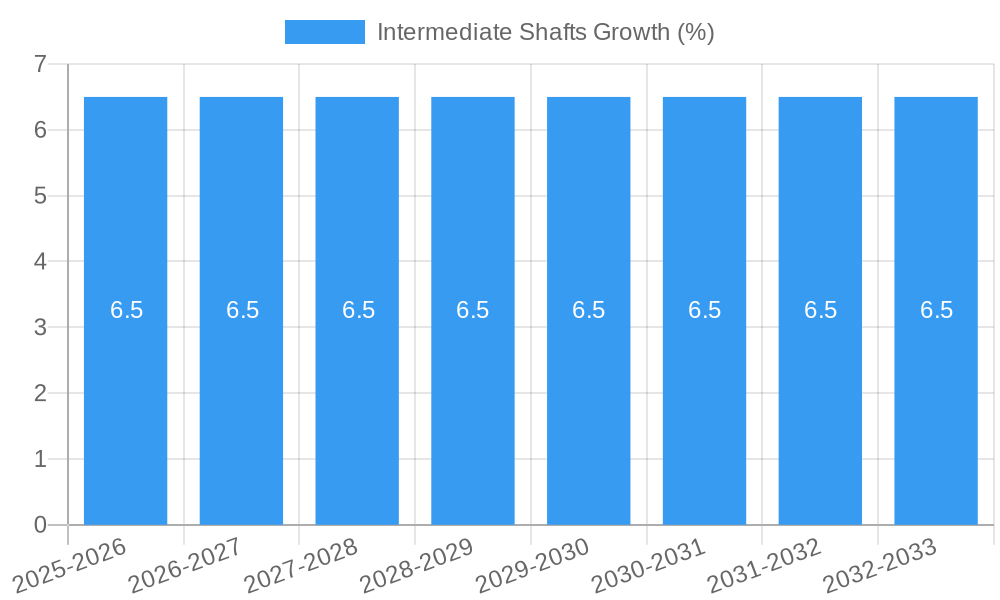
The global intermediate shaft market is experiencing robust growth, projected to reach approximately $2,500 million by 2025, with a substantial Compound Annual Growth Rate (CAGR) estimated at around 6.5% through 2033. This expansion is primarily fueled by the increasing demand for vehicles, particularly passenger cars, and the growing adoption of advanced automotive technologies that necessitate more sophisticated driveline components. The market is segmented into slidable and collapsible types, with both applications serving critical functions in transmitting torque efficiently. Passenger vehicles represent the largest application segment, driven by rising global vehicle production and the trend towards improved vehicle performance and comfort. Commercial vehicles, while a smaller segment, also contribute significantly to market growth due to the expanding logistics and transportation industries, requiring durable and reliable components.
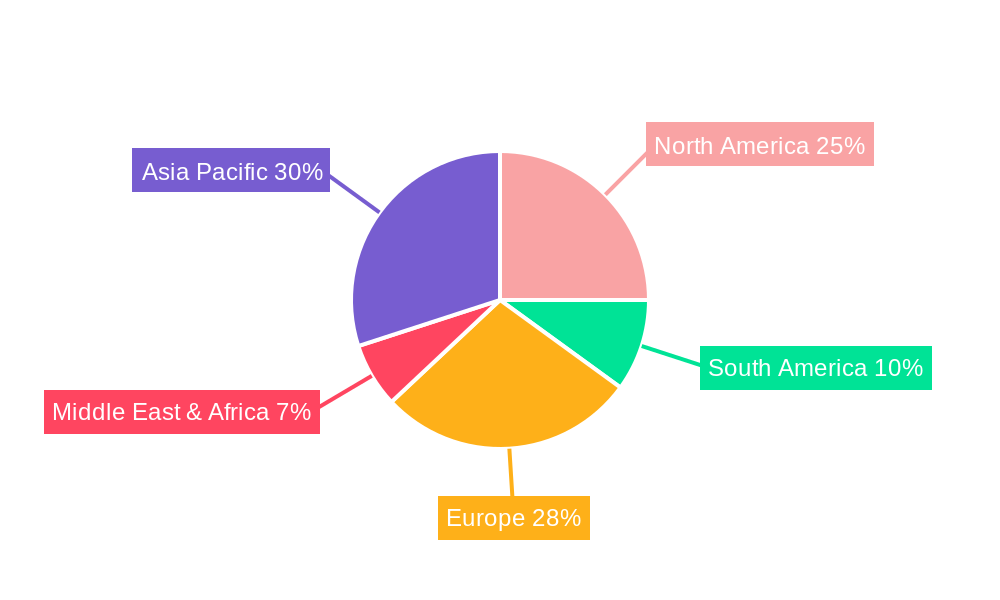
Key market drivers include advancements in vehicle manufacturing technologies, the continuous innovation in automotive powertrains, and the rising disposable incomes in developing economies, which are leading to increased vehicle ownership. Furthermore, the growing emphasis on fuel efficiency and emissions reduction is prompting automakers to integrate lighter and more efficient driveline systems, including advanced intermediate shafts. While the market presents significant opportunities, certain restraints such as the fluctuating raw material prices and the high cost of advanced manufacturing processes could pose challenges. Geographically, the Asia Pacific region is expected to lead market growth, owing to its burgeoning automotive industry, particularly in China and India. North America and Europe, with their established automotive sectors and focus on technological advancements, will also remain crucial markets. Companies like Nexteer, NSK, and Mubea are at the forefront of this market, innovating to meet evolving industry demands.
Intermediate Shafts Market Composition & Trends
The global intermediate shafts market is characterized by a moderate concentration, with key players like Nexteer, NSK, Allena, Wärtsilä, Mubea, Dorman Products, GMB, and Rane holding significant market share. Innovation is primarily driven by the increasing demand for improved fuel efficiency, reduced emissions, and enhanced vehicle performance across both Passenger Vehicle and Commercial Vehicle segments. The regulatory landscape, particularly in developed economies, is pushing for stricter emission standards and safety protocols, indirectly influencing the design and material choices for intermediate shafts. Substitute products, such as integrated drive shafts, are present but the cost-effectiveness and established manufacturing processes for traditional intermediate shafts maintain their market dominance. End-user profiles are diverse, ranging from Tier-1 automotive manufacturers to aftermarket service providers. Mergers and acquisitions (M&A) are a notable trend, with a significant volume of XXX million in M&A deal values observed historically. The market share distribution indicates that Passenger Vehicles account for approximately 70% of the demand, with Commercial Vehicles representing the remaining 30%. Investment trends in the automotive sector directly correlate with R&D spending on driveline components like intermediate shafts.
Intermediate Shafts Industry Evolution
The intermediate shafts industry has witnessed consistent growth trajectories over the historical period (2019–2024), with an anticipated Compound Annual Growth Rate (CAGR) of approximately 4.5% during the forecast period (2025–2033). This evolution is largely propelled by technological advancements focused on lightweight materials, advanced manufacturing techniques like precision forging and heat treatment, and the integration of sophisticated lubrication systems to minimize friction and wear. The demand for intermediate shafts is intrinsically linked to the global automotive production volume. As global vehicle production is projected to reach xx million units by the base year 2025, the demand for these critical driveline components is expected to rise in tandem. Shifting consumer demands, particularly the crescente preference for Sports Utility Vehicles (SUVs) and electric vehicles (EVs), have also influenced the industry. While EVs traditionally feature simpler drivetrain configurations, the evolving modularity of EV platforms is creating new opportunities for specialized intermediate shaft designs. The adoption of advanced simulation and testing methodologies has accelerated product development cycles, allowing manufacturers to introduce optimized designs faster. For instance, the adoption of Finite Element Analysis (FEA) for stress and durability testing has become standard, leading to more robust and reliable intermediate shaft designs. The market has also seen a gradual shift towards higher strength-to-weight ratios in materials, with increasing use of high-strength steels and, in niche applications, even composite materials, though their adoption is still in its nascent stages. The base year 2025 is crucial as it marks a period of stable economic growth, supporting robust automotive sales and, consequently, strong demand for intermediate shafts.
Leading Regions, Countries, or Segments in Intermediate Shafts
Asia-Pacific, particularly China, emerges as the dominant region in the intermediate shafts market, driven by its colossal automotive manufacturing base and burgeoning domestic demand for Passenger Vehicles. This dominance is fueled by significant investment trends in the automotive sector, with numerous global and local manufacturers establishing production facilities in the region. Regulatory support for the automotive industry, coupled with government initiatives to promote domestic manufacturing, further solidifies its leading position. Within the application segment, Passenger Vehicle remains the primary driver, accounting for an estimated 70% of the global intermediate shafts market share. This is attributed to the sheer volume of passenger car production and the continuous demand for replacement parts. The growth in emerging economies within Asia-Pacific, coupled with the rising disposable incomes, is propelling the sales of passenger cars, thereby directly boosting the demand for intermediate shafts. The Type segment sees Slidable intermediate shafts holding a larger market share due to their widespread application in various vehicle architectures. Collapsible intermediate shafts, while offering enhanced safety features, are typically found in more specialized applications or higher-end vehicles, thus representing a smaller, albeit growing, segment. Key drivers for Asia-Pacific's dominance include cost-competitive manufacturing, a vast supply chain network, and a rapidly expanding consumer base. The region's ability to scale production efficiently to meet global demand positions it as a critical hub for intermediate shaft manufacturing and supply. The forecast period (2025–2033) is expected to see continued growth in this region, albeit with increasing competition from other emerging automotive markets.
Intermediate Shafts Product Innovations
Intermediate shaft product innovations are increasingly focused on enhancing durability, reducing weight, and improving noise, vibration, and harshness (NVH) performance. Manufacturers are leveraging advanced materials like high-strength steel alloys and sophisticated heat treatment processes to create shafts that can withstand higher torque loads while remaining lighter. The application of advanced coatings and surface treatments further improves wear resistance and extends service life. For instance, specific chrome plating techniques are being employed to achieve superior surface hardness and reduced friction. The integration of optimized spline profiles and precision balancing techniques minimizes operational vibrations, contributing to a more refined driving experience, especially critical in the Passenger Vehicle segment. These advancements are crucial for meeting evolving OEM specifications and aftermarket demands for improved performance and longevity.
Propelling Factors for Intermediate Shafts Growth
The growth of the intermediate shafts market is significantly propelled by the robust global automotive production volumes. As vehicle manufacturing continues to expand, particularly in emerging economies, the demand for essential driveline components like intermediate shafts inherently increases. Technological advancements in manufacturing processes, leading to improved efficiency and product quality, also act as a key growth driver. Furthermore, stringent automotive regulations mandating enhanced safety and performance standards necessitate the adoption of more advanced and reliable intermediate shaft designs. The expanding aftermarket for automotive parts, driven by an increasing vehicle parc and the need for replacements, also contributes substantially to market growth. Economic upturns and rising disposable incomes globally are leading to higher vehicle sales, further stimulating demand.
Obstacles in the Intermediate Shafts Market
Despite robust growth, the intermediate shafts market faces several obstacles. Fluctuations in raw material prices, particularly steel, can impact manufacturing costs and profit margins. Evolving emission standards and the rise of electric vehicles pose a long-term challenge as EV drivetrains often feature different configurations, potentially reducing the demand for traditional intermediate shafts in the future. Intense competition among manufacturers can lead to price pressures and necessitate continuous investment in R&D to maintain a competitive edge. Supply chain disruptions, as witnessed in recent years, can also hinder production and delivery timelines. Regulatory hurdles related to material sourcing and environmental compliance in certain regions can also present challenges for market expansion. The projected impact of these factors could lead to a stabilization or slight slowdown in growth rates for traditional intermediate shaft designs in specific sub-segments.
Future Opportunities in Intermediate Shafts
Emerging opportunities in the intermediate shafts market lie in the development of specialized shafts for hybrid and electric vehicle architectures. As these vehicle types gain market share, there will be a need for adapted or new intermediate shaft designs to accommodate their unique drivetrain configurations and power delivery systems. The growing demand for performance vehicles and SUVs also presents an opportunity for lightweight, high-strength intermediate shafts. Furthermore, the aftermarket segment, driven by an aging global vehicle parc and increasing consumer focus on vehicle maintenance, offers a stable and growing revenue stream. Technological advancements in additive manufacturing could also unlock new possibilities for customized and optimized intermediate shaft designs in the long term. Expansion into untapped geographic markets with burgeoning automotive industries also represents a significant avenue for growth.
Major Players in the Intermediate Shafts Ecosystem
- Nexteer
- NSK
- Allena
- Wärtsilä
- Mubea
- Dorman Products
- GMB
- Rane
Key Developments in Intermediate Shafts Industry
- 2023/08: Nexteer Automotive introduces a new lightweight intermediate shaft design enhancing fuel efficiency for passenger vehicles.
- 2023/05: NSK Ltd. announces advancements in bearing technology for intermediate shafts, improving durability and reducing friction.
- 2022/11: Mubea expands its manufacturing capacity for intermediate shafts to meet growing demand in the commercial vehicle sector.
- 2022/07: Dorman Products launches an extended range of OE-quality intermediate shafts for the aftermarket.
- 2021/10: Rane Engine Valve Limited invests in new forging technology to enhance intermediate shaft production capabilities.
- 2020/04: Allena India announces strategic partnerships to bolster its presence in the global intermediate shafts market.
- 2019/12: Wärtsilä explores innovative material solutions for high-performance intermediate shafts.
Strategic Intermediate Shafts Market Forecast
The strategic intermediate shafts market forecast indicates sustained growth driven by the burgeoning global automotive industry and continuous technological advancements. The increasing production of Passenger Vehicles and the evolving demands of the Commercial Vehicle sector will remain primary growth catalysts. Innovation in lightweight materials and enhanced durability will be crucial for capitalizing on opportunities in both OEM and aftermarket segments. While the transition to electric vehicles presents a long-term shift, the immediate and medium-term outlook remains positive for traditional intermediate shaft designs, especially as hybrid powertrains become more prevalent. Strategic investments in advanced manufacturing and a focus on high-performance applications will position key players for continued success in this vital automotive component market. The market is projected to reach a valuation of xx million by 2033.
Intermediate Shafts Segmentation
-
1. Application
- 1.1. Passenger Vehicle
- 1.2. Commercial Vehicle
-
2. Type
- 2.1. Slidable
- 2.2. Collapsible
Intermediate Shafts Segmentation By Geography
-
1. North America
- 1.1. United States
- 1.2. Canada
- 1.3. Mexico
-
2. South America
- 2.1. Brazil
- 2.2. Argentina
- 2.3. Rest of South America
-
3. Europe
- 3.1. United Kingdom
- 3.2. Germany
- 3.3. France
- 3.4. Italy
- 3.5. Spain
- 3.6. Russia
- 3.7. Benelux
- 3.8. Nordics
- 3.9. Rest of Europe
-
4. Middle East & Africa
- 4.1. Turkey
- 4.2. Israel
- 4.3. GCC
- 4.4. North Africa
- 4.5. South Africa
- 4.6. Rest of Middle East & Africa
-
5. Asia Pacific
- 5.1. China
- 5.2. India
- 5.3. Japan
- 5.4. South Korea
- 5.5. ASEAN
- 5.6. Oceania
- 5.7. Rest of Asia Pacific
Intermediate Shafts REPORT HIGHLIGHTS
| Aspects | Details |
|---|---|
| Study Period | 2019-2033 |
| Base Year | 2024 |
| Estimated Year | 2025 |
| Forecast Period | 2025-2033 |
| Historical Period | 2019-2024 |
| Growth Rate | CAGR of XXX% from 2019-2033 |
| Segmentation |
|
Table of Contents
- 1. Introduction
- 1.1. Research Scope
- 1.2. Market Segmentation
- 1.3. Research Methodology
- 1.4. Definitions and Assumptions
- 2. Executive Summary
- 2.1. Introduction
- 3. Market Dynamics
- 3.1. Introduction
- 3.2. Market Drivers
- 3.3. Market Restrains
- 3.4. Market Trends
- 4. Market Factor Analysis
- 4.1. Porters Five Forces
- 4.2. Supply/Value Chain
- 4.3. PESTEL analysis
- 4.4. Market Entropy
- 4.5. Patent/Trademark Analysis
- 5. Global Intermediate Shafts Analysis, Insights and Forecast, 2019-2031
- 5.1. Market Analysis, Insights and Forecast - by Application
- 5.1.1. Passenger Vehicle
- 5.1.2. Commercial Vehicle
- 5.2. Market Analysis, Insights and Forecast - by Type
- 5.2.1. Slidable
- 5.2.2. Collapsible
- 5.3. Market Analysis, Insights and Forecast - by Region
- 5.3.1. North America
- 5.3.2. South America
- 5.3.3. Europe
- 5.3.4. Middle East & Africa
- 5.3.5. Asia Pacific
- 5.1. Market Analysis, Insights and Forecast - by Application
- 6. North America Intermediate Shafts Analysis, Insights and Forecast, 2019-2031
- 6.1. Market Analysis, Insights and Forecast - by Application
- 6.1.1. Passenger Vehicle
- 6.1.2. Commercial Vehicle
- 6.2. Market Analysis, Insights and Forecast - by Type
- 6.2.1. Slidable
- 6.2.2. Collapsible
- 6.1. Market Analysis, Insights and Forecast - by Application
- 7. South America Intermediate Shafts Analysis, Insights and Forecast, 2019-2031
- 7.1. Market Analysis, Insights and Forecast - by Application
- 7.1.1. Passenger Vehicle
- 7.1.2. Commercial Vehicle
- 7.2. Market Analysis, Insights and Forecast - by Type
- 7.2.1. Slidable
- 7.2.2. Collapsible
- 7.1. Market Analysis, Insights and Forecast - by Application
- 8. Europe Intermediate Shafts Analysis, Insights and Forecast, 2019-2031
- 8.1. Market Analysis, Insights and Forecast - by Application
- 8.1.1. Passenger Vehicle
- 8.1.2. Commercial Vehicle
- 8.2. Market Analysis, Insights and Forecast - by Type
- 8.2.1. Slidable
- 8.2.2. Collapsible
- 8.1. Market Analysis, Insights and Forecast - by Application
- 9. Middle East & Africa Intermediate Shafts Analysis, Insights and Forecast, 2019-2031
- 9.1. Market Analysis, Insights and Forecast - by Application
- 9.1.1. Passenger Vehicle
- 9.1.2. Commercial Vehicle
- 9.2. Market Analysis, Insights and Forecast - by Type
- 9.2.1. Slidable
- 9.2.2. Collapsible
- 9.1. Market Analysis, Insights and Forecast - by Application
- 10. Asia Pacific Intermediate Shafts Analysis, Insights and Forecast, 2019-2031
- 10.1. Market Analysis, Insights and Forecast - by Application
- 10.1.1. Passenger Vehicle
- 10.1.2. Commercial Vehicle
- 10.2. Market Analysis, Insights and Forecast - by Type
- 10.2.1. Slidable
- 10.2.2. Collapsible
- 10.1. Market Analysis, Insights and Forecast - by Application
- 11. Competitive Analysis
- 11.1. Global Market Share Analysis 2024
- 11.2. Company Profiles
- 11.2.1 Nexteer
- 11.2.1.1. Overview
- 11.2.1.2. Products
- 11.2.1.3. SWOT Analysis
- 11.2.1.4. Recent Developments
- 11.2.1.5. Financials (Based on Availability)
- 11.2.2 NSK
- 11.2.2.1. Overview
- 11.2.2.2. Products
- 11.2.2.3. SWOT Analysis
- 11.2.2.4. Recent Developments
- 11.2.2.5. Financials (Based on Availability)
- 11.2.3 Allena
- 11.2.3.1. Overview
- 11.2.3.2. Products
- 11.2.3.3. SWOT Analysis
- 11.2.3.4. Recent Developments
- 11.2.3.5. Financials (Based on Availability)
- 11.2.4 Wärtsilä
- 11.2.4.1. Overview
- 11.2.4.2. Products
- 11.2.4.3. SWOT Analysis
- 11.2.4.4. Recent Developments
- 11.2.4.5. Financials (Based on Availability)
- 11.2.5 Mubea
- 11.2.5.1. Overview
- 11.2.5.2. Products
- 11.2.5.3. SWOT Analysis
- 11.2.5.4. Recent Developments
- 11.2.5.5. Financials (Based on Availability)
- 11.2.6 Dorman Products
- 11.2.6.1. Overview
- 11.2.6.2. Products
- 11.2.6.3. SWOT Analysis
- 11.2.6.4. Recent Developments
- 11.2.6.5. Financials (Based on Availability)
- 11.2.7 GMB
- 11.2.7.1. Overview
- 11.2.7.2. Products
- 11.2.7.3. SWOT Analysis
- 11.2.7.4. Recent Developments
- 11.2.7.5. Financials (Based on Availability)
- 11.2.8 Rane
- 11.2.8.1. Overview
- 11.2.8.2. Products
- 11.2.8.3. SWOT Analysis
- 11.2.8.4. Recent Developments
- 11.2.8.5. Financials (Based on Availability)
- 11.2.1 Nexteer
List of Figures
- Figure 1: Global Intermediate Shafts Revenue Breakdown (million, %) by Region 2024 & 2032
- Figure 2: Global Intermediate Shafts Volume Breakdown (K, %) by Region 2024 & 2032
- Figure 3: North America Intermediate Shafts Revenue (million), by Application 2024 & 2032
- Figure 4: North America Intermediate Shafts Volume (K), by Application 2024 & 2032
- Figure 5: North America Intermediate Shafts Revenue Share (%), by Application 2024 & 2032
- Figure 6: North America Intermediate Shafts Volume Share (%), by Application 2024 & 2032
- Figure 7: North America Intermediate Shafts Revenue (million), by Type 2024 & 2032
- Figure 8: North America Intermediate Shafts Volume (K), by Type 2024 & 2032
- Figure 9: North America Intermediate Shafts Revenue Share (%), by Type 2024 & 2032
- Figure 10: North America Intermediate Shafts Volume Share (%), by Type 2024 & 2032
- Figure 11: North America Intermediate Shafts Revenue (million), by Country 2024 & 2032
- Figure 12: North America Intermediate Shafts Volume (K), by Country 2024 & 2032
- Figure 13: North America Intermediate Shafts Revenue Share (%), by Country 2024 & 2032
- Figure 14: North America Intermediate Shafts Volume Share (%), by Country 2024 & 2032
- Figure 15: South America Intermediate Shafts Revenue (million), by Application 2024 & 2032
- Figure 16: South America Intermediate Shafts Volume (K), by Application 2024 & 2032
- Figure 17: South America Intermediate Shafts Revenue Share (%), by Application 2024 & 2032
- Figure 18: South America Intermediate Shafts Volume Share (%), by Application 2024 & 2032
- Figure 19: South America Intermediate Shafts Revenue (million), by Type 2024 & 2032
- Figure 20: South America Intermediate Shafts Volume (K), by Type 2024 & 2032
- Figure 21: South America Intermediate Shafts Revenue Share (%), by Type 2024 & 2032
- Figure 22: South America Intermediate Shafts Volume Share (%), by Type 2024 & 2032
- Figure 23: South America Intermediate Shafts Revenue (million), by Country 2024 & 2032
- Figure 24: South America Intermediate Shafts Volume (K), by Country 2024 & 2032
- Figure 25: South America Intermediate Shafts Revenue Share (%), by Country 2024 & 2032
- Figure 26: South America Intermediate Shafts Volume Share (%), by Country 2024 & 2032
- Figure 27: Europe Intermediate Shafts Revenue (million), by Application 2024 & 2032
- Figure 28: Europe Intermediate Shafts Volume (K), by Application 2024 & 2032
- Figure 29: Europe Intermediate Shafts Revenue Share (%), by Application 2024 & 2032
- Figure 30: Europe Intermediate Shafts Volume Share (%), by Application 2024 & 2032
- Figure 31: Europe Intermediate Shafts Revenue (million), by Type 2024 & 2032
- Figure 32: Europe Intermediate Shafts Volume (K), by Type 2024 & 2032
- Figure 33: Europe Intermediate Shafts Revenue Share (%), by Type 2024 & 2032
- Figure 34: Europe Intermediate Shafts Volume Share (%), by Type 2024 & 2032
- Figure 35: Europe Intermediate Shafts Revenue (million), by Country 2024 & 2032
- Figure 36: Europe Intermediate Shafts Volume (K), by Country 2024 & 2032
- Figure 37: Europe Intermediate Shafts Revenue Share (%), by Country 2024 & 2032
- Figure 38: Europe Intermediate Shafts Volume Share (%), by Country 2024 & 2032
- Figure 39: Middle East & Africa Intermediate Shafts Revenue (million), by Application 2024 & 2032
- Figure 40: Middle East & Africa Intermediate Shafts Volume (K), by Application 2024 & 2032
- Figure 41: Middle East & Africa Intermediate Shafts Revenue Share (%), by Application 2024 & 2032
- Figure 42: Middle East & Africa Intermediate Shafts Volume Share (%), by Application 2024 & 2032
- Figure 43: Middle East & Africa Intermediate Shafts Revenue (million), by Type 2024 & 2032
- Figure 44: Middle East & Africa Intermediate Shafts Volume (K), by Type 2024 & 2032
- Figure 45: Middle East & Africa Intermediate Shafts Revenue Share (%), by Type 2024 & 2032
- Figure 46: Middle East & Africa Intermediate Shafts Volume Share (%), by Type 2024 & 2032
- Figure 47: Middle East & Africa Intermediate Shafts Revenue (million), by Country 2024 & 2032
- Figure 48: Middle East & Africa Intermediate Shafts Volume (K), by Country 2024 & 2032
- Figure 49: Middle East & Africa Intermediate Shafts Revenue Share (%), by Country 2024 & 2032
- Figure 50: Middle East & Africa Intermediate Shafts Volume Share (%), by Country 2024 & 2032
- Figure 51: Asia Pacific Intermediate Shafts Revenue (million), by Application 2024 & 2032
- Figure 52: Asia Pacific Intermediate Shafts Volume (K), by Application 2024 & 2032
- Figure 53: Asia Pacific Intermediate Shafts Revenue Share (%), by Application 2024 & 2032
- Figure 54: Asia Pacific Intermediate Shafts Volume Share (%), by Application 2024 & 2032
- Figure 55: Asia Pacific Intermediate Shafts Revenue (million), by Type 2024 & 2032
- Figure 56: Asia Pacific Intermediate Shafts Volume (K), by Type 2024 & 2032
- Figure 57: Asia Pacific Intermediate Shafts Revenue Share (%), by Type 2024 & 2032
- Figure 58: Asia Pacific Intermediate Shafts Volume Share (%), by Type 2024 & 2032
- Figure 59: Asia Pacific Intermediate Shafts Revenue (million), by Country 2024 & 2032
- Figure 60: Asia Pacific Intermediate Shafts Volume (K), by Country 2024 & 2032
- Figure 61: Asia Pacific Intermediate Shafts Revenue Share (%), by Country 2024 & 2032
- Figure 62: Asia Pacific Intermediate Shafts Volume Share (%), by Country 2024 & 2032
List of Tables
- Table 1: Global Intermediate Shafts Revenue million Forecast, by Region 2019 & 2032
- Table 2: Global Intermediate Shafts Volume K Forecast, by Region 2019 & 2032
- Table 3: Global Intermediate Shafts Revenue million Forecast, by Application 2019 & 2032
- Table 4: Global Intermediate Shafts Volume K Forecast, by Application 2019 & 2032
- Table 5: Global Intermediate Shafts Revenue million Forecast, by Type 2019 & 2032
- Table 6: Global Intermediate Shafts Volume K Forecast, by Type 2019 & 2032
- Table 7: Global Intermediate Shafts Revenue million Forecast, by Region 2019 & 2032
- Table 8: Global Intermediate Shafts Volume K Forecast, by Region 2019 & 2032
- Table 9: Global Intermediate Shafts Revenue million Forecast, by Application 2019 & 2032
- Table 10: Global Intermediate Shafts Volume K Forecast, by Application 2019 & 2032
- Table 11: Global Intermediate Shafts Revenue million Forecast, by Type 2019 & 2032
- Table 12: Global Intermediate Shafts Volume K Forecast, by Type 2019 & 2032
- Table 13: Global Intermediate Shafts Revenue million Forecast, by Country 2019 & 2032
- Table 14: Global Intermediate Shafts Volume K Forecast, by Country 2019 & 2032
- Table 15: United States Intermediate Shafts Revenue (million) Forecast, by Application 2019 & 2032
- Table 16: United States Intermediate Shafts Volume (K) Forecast, by Application 2019 & 2032
- Table 17: Canada Intermediate Shafts Revenue (million) Forecast, by Application 2019 & 2032
- Table 18: Canada Intermediate Shafts Volume (K) Forecast, by Application 2019 & 2032
- Table 19: Mexico Intermediate Shafts Revenue (million) Forecast, by Application 2019 & 2032
- Table 20: Mexico Intermediate Shafts Volume (K) Forecast, by Application 2019 & 2032
- Table 21: Global Intermediate Shafts Revenue million Forecast, by Application 2019 & 2032
- Table 22: Global Intermediate Shafts Volume K Forecast, by Application 2019 & 2032
- Table 23: Global Intermediate Shafts Revenue million Forecast, by Type 2019 & 2032
- Table 24: Global Intermediate Shafts Volume K Forecast, by Type 2019 & 2032
- Table 25: Global Intermediate Shafts Revenue million Forecast, by Country 2019 & 2032
- Table 26: Global Intermediate Shafts Volume K Forecast, by Country 2019 & 2032
- Table 27: Brazil Intermediate Shafts Revenue (million) Forecast, by Application 2019 & 2032
- Table 28: Brazil Intermediate Shafts Volume (K) Forecast, by Application 2019 & 2032
- Table 29: Argentina Intermediate Shafts Revenue (million) Forecast, by Application 2019 & 2032
- Table 30: Argentina Intermediate Shafts Volume (K) Forecast, by Application 2019 & 2032
- Table 31: Rest of South America Intermediate Shafts Revenue (million) Forecast, by Application 2019 & 2032
- Table 32: Rest of South America Intermediate Shafts Volume (K) Forecast, by Application 2019 & 2032
- Table 33: Global Intermediate Shafts Revenue million Forecast, by Application 2019 & 2032
- Table 34: Global Intermediate Shafts Volume K Forecast, by Application 2019 & 2032
- Table 35: Global Intermediate Shafts Revenue million Forecast, by Type 2019 & 2032
- Table 36: Global Intermediate Shafts Volume K Forecast, by Type 2019 & 2032
- Table 37: Global Intermediate Shafts Revenue million Forecast, by Country 2019 & 2032
- Table 38: Global Intermediate Shafts Volume K Forecast, by Country 2019 & 2032
- Table 39: United Kingdom Intermediate Shafts Revenue (million) Forecast, by Application 2019 & 2032
- Table 40: United Kingdom Intermediate Shafts Volume (K) Forecast, by Application 2019 & 2032
- Table 41: Germany Intermediate Shafts Revenue (million) Forecast, by Application 2019 & 2032
- Table 42: Germany Intermediate Shafts Volume (K) Forecast, by Application 2019 & 2032
- Table 43: France Intermediate Shafts Revenue (million) Forecast, by Application 2019 & 2032
- Table 44: France Intermediate Shafts Volume (K) Forecast, by Application 2019 & 2032
- Table 45: Italy Intermediate Shafts Revenue (million) Forecast, by Application 2019 & 2032
- Table 46: Italy Intermediate Shafts Volume (K) Forecast, by Application 2019 & 2032
- Table 47: Spain Intermediate Shafts Revenue (million) Forecast, by Application 2019 & 2032
- Table 48: Spain Intermediate Shafts Volume (K) Forecast, by Application 2019 & 2032
- Table 49: Russia Intermediate Shafts Revenue (million) Forecast, by Application 2019 & 2032
- Table 50: Russia Intermediate Shafts Volume (K) Forecast, by Application 2019 & 2032
- Table 51: Benelux Intermediate Shafts Revenue (million) Forecast, by Application 2019 & 2032
- Table 52: Benelux Intermediate Shafts Volume (K) Forecast, by Application 2019 & 2032
- Table 53: Nordics Intermediate Shafts Revenue (million) Forecast, by Application 2019 & 2032
- Table 54: Nordics Intermediate Shafts Volume (K) Forecast, by Application 2019 & 2032
- Table 55: Rest of Europe Intermediate Shafts Revenue (million) Forecast, by Application 2019 & 2032
- Table 56: Rest of Europe Intermediate Shafts Volume (K) Forecast, by Application 2019 & 2032
- Table 57: Global Intermediate Shafts Revenue million Forecast, by Application 2019 & 2032
- Table 58: Global Intermediate Shafts Volume K Forecast, by Application 2019 & 2032
- Table 59: Global Intermediate Shafts Revenue million Forecast, by Type 2019 & 2032
- Table 60: Global Intermediate Shafts Volume K Forecast, by Type 2019 & 2032
- Table 61: Global Intermediate Shafts Revenue million Forecast, by Country 2019 & 2032
- Table 62: Global Intermediate Shafts Volume K Forecast, by Country 2019 & 2032
- Table 63: Turkey Intermediate Shafts Revenue (million) Forecast, by Application 2019 & 2032
- Table 64: Turkey Intermediate Shafts Volume (K) Forecast, by Application 2019 & 2032
- Table 65: Israel Intermediate Shafts Revenue (million) Forecast, by Application 2019 & 2032
- Table 66: Israel Intermediate Shafts Volume (K) Forecast, by Application 2019 & 2032
- Table 67: GCC Intermediate Shafts Revenue (million) Forecast, by Application 2019 & 2032
- Table 68: GCC Intermediate Shafts Volume (K) Forecast, by Application 2019 & 2032
- Table 69: North Africa Intermediate Shafts Revenue (million) Forecast, by Application 2019 & 2032
- Table 70: North Africa Intermediate Shafts Volume (K) Forecast, by Application 2019 & 2032
- Table 71: South Africa Intermediate Shafts Revenue (million) Forecast, by Application 2019 & 2032
- Table 72: South Africa Intermediate Shafts Volume (K) Forecast, by Application 2019 & 2032
- Table 73: Rest of Middle East & Africa Intermediate Shafts Revenue (million) Forecast, by Application 2019 & 2032
- Table 74: Rest of Middle East & Africa Intermediate Shafts Volume (K) Forecast, by Application 2019 & 2032
- Table 75: Global Intermediate Shafts Revenue million Forecast, by Application 2019 & 2032
- Table 76: Global Intermediate Shafts Volume K Forecast, by Application 2019 & 2032
- Table 77: Global Intermediate Shafts Revenue million Forecast, by Type 2019 & 2032
- Table 78: Global Intermediate Shafts Volume K Forecast, by Type 2019 & 2032
- Table 79: Global Intermediate Shafts Revenue million Forecast, by Country 2019 & 2032
- Table 80: Global Intermediate Shafts Volume K Forecast, by Country 2019 & 2032
- Table 81: China Intermediate Shafts Revenue (million) Forecast, by Application 2019 & 2032
- Table 82: China Intermediate Shafts Volume (K) Forecast, by Application 2019 & 2032
- Table 83: India Intermediate Shafts Revenue (million) Forecast, by Application 2019 & 2032
- Table 84: India Intermediate Shafts Volume (K) Forecast, by Application 2019 & 2032
- Table 85: Japan Intermediate Shafts Revenue (million) Forecast, by Application 2019 & 2032
- Table 86: Japan Intermediate Shafts Volume (K) Forecast, by Application 2019 & 2032
- Table 87: South Korea Intermediate Shafts Revenue (million) Forecast, by Application 2019 & 2032
- Table 88: South Korea Intermediate Shafts Volume (K) Forecast, by Application 2019 & 2032
- Table 89: ASEAN Intermediate Shafts Revenue (million) Forecast, by Application 2019 & 2032
- Table 90: ASEAN Intermediate Shafts Volume (K) Forecast, by Application 2019 & 2032
- Table 91: Oceania Intermediate Shafts Revenue (million) Forecast, by Application 2019 & 2032
- Table 92: Oceania Intermediate Shafts Volume (K) Forecast, by Application 2019 & 2032
- Table 93: Rest of Asia Pacific Intermediate Shafts Revenue (million) Forecast, by Application 2019 & 2032
- Table 94: Rest of Asia Pacific Intermediate Shafts Volume (K) Forecast, by Application 2019 & 2032
Frequently Asked Questions
1. What is the projected Compound Annual Growth Rate (CAGR) of the Intermediate Shafts?
The projected CAGR is approximately XXX%.
2. Which companies are prominent players in the Intermediate Shafts?
Key companies in the market include Nexteer, NSK, Allena, Wärtsilä, Mubea, Dorman Products, GMB, Rane.
3. What are the main segments of the Intermediate Shafts?
The market segments include Application, Type.
4. Can you provide details about the market size?
The market size is estimated to be USD XXX million as of 2022.
5. What are some drivers contributing to market growth?
N/A
6. What are the notable trends driving market growth?
N/A
7. Are there any restraints impacting market growth?
N/A
8. Can you provide examples of recent developments in the market?
N/A
9. What pricing options are available for accessing the report?
Pricing options include single-user, multi-user, and enterprise licenses priced at USD 3950.00, USD 5925.00, and USD 7900.00 respectively.
10. Is the market size provided in terms of value or volume?
The market size is provided in terms of value, measured in million and volume, measured in K.
11. Are there any specific market keywords associated with the report?
Yes, the market keyword associated with the report is "Intermediate Shafts," which aids in identifying and referencing the specific market segment covered.
12. How do I determine which pricing option suits my needs best?
The pricing options vary based on user requirements and access needs. Individual users may opt for single-user licenses, while businesses requiring broader access may choose multi-user or enterprise licenses for cost-effective access to the report.
13. Are there any additional resources or data provided in the Intermediate Shafts report?
While the report offers comprehensive insights, it's advisable to review the specific contents or supplementary materials provided to ascertain if additional resources or data are available.
14. How can I stay updated on further developments or reports in the Intermediate Shafts?
To stay informed about further developments, trends, and reports in the Intermediate Shafts, consider subscribing to industry newsletters, following relevant companies and organizations, or regularly checking reputable industry news sources and publications.
Methodology
Step 1 - Identification of Relevant Samples Size from Population Database


Step 2 - Approaches for Defining Global Market Size (Value, Volume* & Price*)

Note*: In applicable scenarios
Step 3 - Data Sources
Primary Research
- Web Analytics
- Survey Reports
- Research Institute
- Latest Research Reports
- Opinion Leaders
Secondary Research
- Annual Reports
- White Paper
- Latest Press Release
- Industry Association
- Paid Database
- Investor Presentations

Step 4 - Data Triangulation
Involves using different sources of information in order to increase the validity of a study
These sources are likely to be stakeholders in a program - participants, other researchers, program staff, other community members, and so on.
Then we put all data in single framework & apply various statistical tools to find out the dynamic on the market.
During the analysis stage, feedback from the stakeholder groups would be compared to determine areas of agreement as well as areas of divergence
