

Key Insights
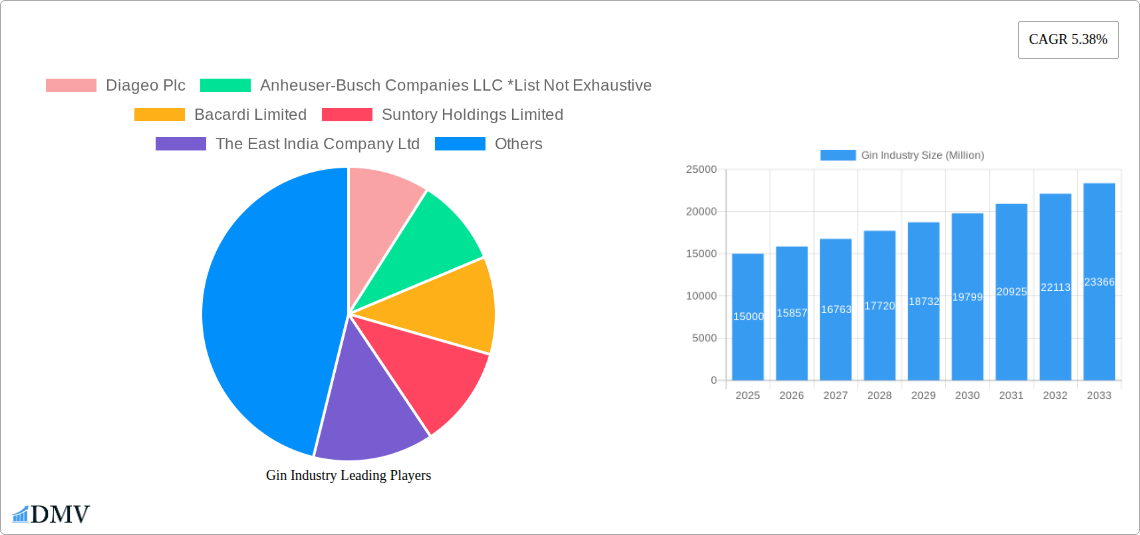
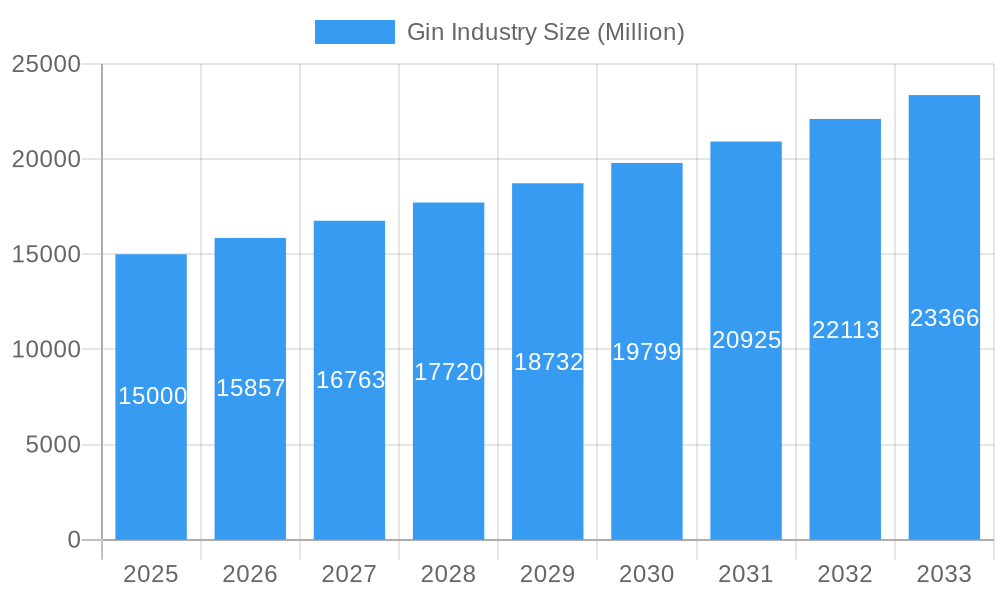
The global gin market, valued at approximately $24.4 billion in 2025, is projected to experience significant expansion, exhibiting a compound annual growth rate (CAGR) of 3.8% from 2025 to 2033. This growth is propelled by the escalating popularity of craft gins and premium spirits, alongside heightened consumer engagement with sophisticated cocktails and mixology. Increased disposable incomes in emerging economies and a prevailing trend toward premiumization in the alcoholic beverage sector further bolster demand. Geographic expansion into new markets, particularly within the Asia-Pacific region, where gin consumption is rapidly increasing, presents substantial opportunities. Key restraints include volatile raw material costs and stringent regulatory frameworks governing alcohol production and distribution. The market is segmented by type, including London Dry Gin, Old Tom Gin, Plymouth Gin, and Others, and by distribution channel, encompassing On-Trade and Off-Trade. London Dry Gin currently leads the type segment due to its inherent versatility and established appeal. While the On-Trade channel (bars and restaurants) presently holds a larger market share, the Off-Trade channel (retail stores) demonstrates considerable growth potential. Major industry players, such as Diageo, Bacardi, and Pernod Ricard, are spearheading innovation through product diversification and strategic marketing initiatives, actively shaping the market's trajectory. North America and Europe currently represent the largest regional markets, yet the Asia-Pacific region is anticipated to emerge as the most promising growth frontier in the forthcoming years.
Gin Industry Market Size (In Billion)
The competitive landscape is defined by a dynamic interplay between established multinational corporations and specialized craft distilleries. Leading companies leverage extensive distribution networks and strong brand equity for market dominance. Concurrently, craft distilleries are gaining traction by offering distinctive flavor profiles and catering to consumer preferences for artisanal and locally sourced products. This ongoing synergy between established entities and emerging craft producers will continue to influence market dynamics and foster innovation. The forecast period (2025-2033) anticipates sustained market expansion, driven by factors such as the growing middle class in developing economies, persistent demand for premium spirits, and continuous product innovation. Growth patterns are expected to vary geographically, with the Asia-Pacific region projected to experience the most pronounced expansion.
Gin Industry Company Market Share
Gin Industry Market Report: 2019-2033
This comprehensive report provides a detailed analysis of the global gin industry, projecting robust growth from 2019 to 2033. Valued at $XX Million in 2025, the market is poised for significant expansion, driven by evolving consumer preferences, product innovation, and strategic investments. This in-depth analysis covers key segments, leading players, and emerging trends, offering invaluable insights for stakeholders across the value chain. The report uses 2025 as the base year and covers the historical period of 2019-2024, with forecasts extending to 2033.
Gin Industry Market Composition & Trends
This section delves into the intricate structure of the gin market, analyzing its concentration, innovative drivers, regulatory frameworks, substitute products, end-user demographics, and mergers & acquisitions (M&A) activity. The report quantifies market share distribution among key players like Diageo Plc, Anheuser-Busch Companies LLC, Bacardi Limited, Suntory Holdings Limited, The East India Company Ltd, Remy Cointreau, William Grant & Sons Ltd, Radico Khaitan Ltd, San Miguel Corporation, Davide Campari-Milano N V, and Pernod Ricard, providing a granular understanding of the competitive landscape. We examine the impact of over $XX Million in M&A deals in the historical period, highlighting strategic shifts and market consolidation.
- Market Concentration: Analysis of market share held by top players, illustrating the degree of concentration and competition.
- Innovation Catalysts: Examination of factors driving new product development, including consumer demand for unique flavors and premium offerings.
- Regulatory Landscape: Assessment of regulations impacting gin production, distribution, and marketing in key regions.
- Substitute Products: Identification and analysis of alternative alcoholic beverages competing with gin.
- End-User Profiles: Demographic segmentation of gin consumers, identifying key characteristics and purchasing behaviors.
- M&A Activity: Detailed analysis of significant mergers, acquisitions, and joint ventures, including deal values and their impact on the market.
Gin Industry Evolution
This section offers a dynamic overview of the gin industry's trajectory, tracing its growth patterns, technological innovations, and evolving consumer preferences over the study period (2019-2033). We examine the impact of rising disposable incomes, changing lifestyle trends, and the premiumization of the gin category on market expansion. Specific data points, including annual growth rates and adoption metrics for new technologies, are provided to paint a vivid picture of market evolution. The projected Compound Annual Growth Rate (CAGR) for the forecast period (2025-2033) is estimated at XX%. Analysis considers the influence of factors such as the rise of craft distilleries, the increasing popularity of gin cocktails, and the growing demand for premium and flavored gins.
Leading Regions, Countries, or Segments in Gin Industry
This section pinpoints the dominant regions, countries, and product segments within the gin industry, focusing on London Dry Gin, Old Tom Gin, Plymouth Gin, and Other Types, alongside On-Trade and Off-Trade distribution channels. We delve into the root causes of market leadership using detailed analysis and key drivers, elucidating the factors that contribute to a region’s or segment’s dominance.
Key Drivers for Dominant Segments:
- Investment Trends: Analysis of investment patterns across different gin types and distribution channels.
- Regulatory Support: Assessment of government policies and regulations favoring certain segments.
- Consumer Preferences: Examination of consumer preferences and buying habits in different regions.
In-depth Analysis of Dominance Factors: Detailed explanation of why specific regions, countries, or segments hold a leading market position. This may include factors such as production costs, consumer culture, and distribution networks.
Gin Industry Product Innovations
This section highlights the most significant product innovations, applications, and performance metrics in the gin industry. The analysis focuses on the unique selling propositions (USPs) of new products and the technological advancements driving innovation. This includes the impact of new flavor profiles, botanical combinations, and production techniques on market growth.
Propelling Factors for Gin Industry Growth
Several powerful forces are driving expansion in the gin market. These include technological advancements in distillation, increasing consumer spending, particularly in emerging markets, and favorable regulatory environments that support the growth of the industry. Government initiatives promoting local distilleries further contribute to market growth, creating opportunities for new entrants and established players alike.
Obstacles in the Gin Industry Market
Despite its positive growth trajectory, the gin industry faces certain challenges. These include regulatory hurdles, such as licensing requirements and alcohol taxation, that increase production costs and limit market penetration. Supply chain disruptions, particularly in the procurement of botanicals and other key ingredients, can also negatively affect production and pricing. Furthermore, intense competition among established brands and the rise of craft distilleries create pressure on market share and profitability. The estimated impact of these challenges on market growth is XX%.
Future Opportunities in Gin Industry
The gin industry presents several exciting prospects for future growth. The expansion into new and untapped markets in Asia and Africa offers significant potential for growth. Technological innovations, including sustainable production methods and innovative packaging, will further enhance market prospects. Emerging consumer trends, such as the increasing preference for low-alcohol and ready-to-drink (RTD) options, represent an attractive avenue for market expansion.
Major Players in the Gin Industry Ecosystem
- Diageo Plc
- Anheuser-Busch Companies LLC
- Bacardi Limited
- Suntory Holdings Limited
- The East India Company Ltd
- Remy Cointreau
- William Grant & Sons Ltd
- Radico Khaitan Ltd
- San Miguel Corporation
- Davide Campari-Milano N V
- Pernod Ricard
Key Developments in Gin Industry Industry
- April 2022: Bombay Sapphire (Bacardi) launches Citron Presse gin. The rollout across multiple countries significantly impacts market share and consumer choice.
- March 2022: Diageo India invests in Nao Spirits, boosting its presence in the rapidly growing Indian premium gin market. This investment underscores the potential of the Indian market and influences competitive dynamics.
- March 2022: William Grant & Sons launches Hendrick's Neptunia Gin, capitalizing on the rising demand for unique and high-quality gin products. This strengthens their position in the premium segment.
- April 2021: Pernod Ricard introduces Beefeater RTDs in the UK, tapping into the growing popularity of ready-to-drink cocktails. This demonstrates a strategic response to evolving consumer preferences.
Strategic Gin Industry Market Forecast
The gin industry is projected to experience sustained growth over the forecast period (2025-2033), driven by consistent product innovation, expansion into new markets, and the ongoing premiumization of the category. The increasing demand for premium gins and flavored variants, along with the strategic expansion of leading players, will significantly contribute to market growth. The market's overall potential remains substantial, promising significant returns for investors and stakeholders across the gin industry value chain.
Gin Industry Segmentation
-
1. Type
- 1.1. London Dry Gin
- 1.2. Old Tom Gin
- 1.3. Plymouth Gin
- 1.4. Other Types
-
2. Distribution Channel
- 2.1. On -Trade
- 2.2. Off - Trade
Gin Industry Segmentation By Geography
-
1. North America
- 1.1. United States
- 1.2. Canada
- 1.3. Mexico
- 1.4. Rest of North America
-
2. Europe
- 2.1. United Kingdom
- 2.2. Germany
- 2.3. Spain
- 2.4. France
- 2.5. Italy
- 2.6. Russia
- 2.7. Rest of Europe
-
3. Asia Pacific
- 3.1. China
- 3.2. Japan
- 3.3. India
- 3.4. Australia
- 3.5. Rest of Asia Pacific
-
4. South America
- 4.1. Brazil
- 4.2. Argentina
- 4.3. Rest of South America
- 5. Middle East
-
6. Saudi Arabia
- 6.1. South Africa
- 6.2. Rest of Middle East
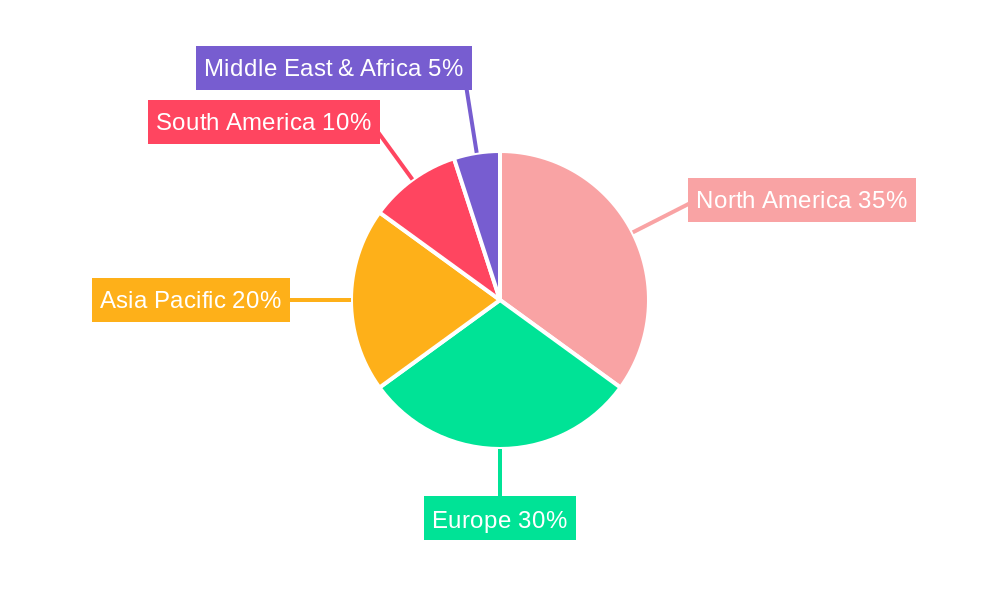
Gin Industry Regional Market Share
Geographic Coverage of Gin Industry
Gin Industry REPORT HIGHLIGHTS
| Aspects | Details |
|---|---|
| Study Period | 2020-2034 |
| Base Year | 2025 |
| Estimated Year | 2026 |
| Forecast Period | 2026-2034 |
| Historical Period | 2020-2025 |
| Growth Rate | CAGR of 3.8% from 2020-2034 |
| Segmentation |
|
Table of Contents
- 1. Introduction
- 1.1. Research Scope
- 1.2. Market Segmentation
- 1.3. Research Methodology
- 1.4. Definitions and Assumptions
- 2. Executive Summary
- 2.1. Introduction
- 3. Market Dynamics
- 3.1. Introduction
- 3.2. Market Drivers
- 3.2.1. Increasing Demand for Functional and Fortified Food; Multi-functionality and Wide Application of Riboflavin
- 3.3. Market Restrains
- 3.3.1. Low Stability of Riboflavin on Exposure to Light and Heat
- 3.4. Market Trends
- 3.4.1. Infusion of Gin in Premium Cocktails
- 4. Market Factor Analysis
- 4.1. Porters Five Forces
- 4.2. Supply/Value Chain
- 4.3. PESTEL analysis
- 4.4. Market Entropy
- 4.5. Patent/Trademark Analysis
- 5. Global Gin Industry Analysis, Insights and Forecast, 2020-2032
- 5.1. Market Analysis, Insights and Forecast - by Type
- 5.1.1. London Dry Gin
- 5.1.2. Old Tom Gin
- 5.1.3. Plymouth Gin
- 5.1.4. Other Types
- 5.2. Market Analysis, Insights and Forecast - by Distribution Channel
- 5.2.1. On -Trade
- 5.2.2. Off - Trade
- 5.3. Market Analysis, Insights and Forecast - by Region
- 5.3.1. North America
- 5.3.2. Europe
- 5.3.3. Asia Pacific
- 5.3.4. South America
- 5.3.5. Middle East
- 5.3.6. Saudi Arabia
- 5.1. Market Analysis, Insights and Forecast - by Type
- 6. North America Gin Industry Analysis, Insights and Forecast, 2020-2032
- 6.1. Market Analysis, Insights and Forecast - by Type
- 6.1.1. London Dry Gin
- 6.1.2. Old Tom Gin
- 6.1.3. Plymouth Gin
- 6.1.4. Other Types
- 6.2. Market Analysis, Insights and Forecast - by Distribution Channel
- 6.2.1. On -Trade
- 6.2.2. Off - Trade
- 6.1. Market Analysis, Insights and Forecast - by Type
- 7. Europe Gin Industry Analysis, Insights and Forecast, 2020-2032
- 7.1. Market Analysis, Insights and Forecast - by Type
- 7.1.1. London Dry Gin
- 7.1.2. Old Tom Gin
- 7.1.3. Plymouth Gin
- 7.1.4. Other Types
- 7.2. Market Analysis, Insights and Forecast - by Distribution Channel
- 7.2.1. On -Trade
- 7.2.2. Off - Trade
- 7.1. Market Analysis, Insights and Forecast - by Type
- 8. Asia Pacific Gin Industry Analysis, Insights and Forecast, 2020-2032
- 8.1. Market Analysis, Insights and Forecast - by Type
- 8.1.1. London Dry Gin
- 8.1.2. Old Tom Gin
- 8.1.3. Plymouth Gin
- 8.1.4. Other Types
- 8.2. Market Analysis, Insights and Forecast - by Distribution Channel
- 8.2.1. On -Trade
- 8.2.2. Off - Trade
- 8.1. Market Analysis, Insights and Forecast - by Type
- 9. South America Gin Industry Analysis, Insights and Forecast, 2020-2032
- 9.1. Market Analysis, Insights and Forecast - by Type
- 9.1.1. London Dry Gin
- 9.1.2. Old Tom Gin
- 9.1.3. Plymouth Gin
- 9.1.4. Other Types
- 9.2. Market Analysis, Insights and Forecast - by Distribution Channel
- 9.2.1. On -Trade
- 9.2.2. Off - Trade
- 9.1. Market Analysis, Insights and Forecast - by Type
- 10. Middle East Gin Industry Analysis, Insights and Forecast, 2020-2032
- 10.1. Market Analysis, Insights and Forecast - by Type
- 10.1.1. London Dry Gin
- 10.1.2. Old Tom Gin
- 10.1.3. Plymouth Gin
- 10.1.4. Other Types
- 10.2. Market Analysis, Insights and Forecast - by Distribution Channel
- 10.2.1. On -Trade
- 10.2.2. Off - Trade
- 10.1. Market Analysis, Insights and Forecast - by Type
- 11. Saudi Arabia Gin Industry Analysis, Insights and Forecast, 2020-2032
- 11.1. Market Analysis, Insights and Forecast - by Type
- 11.1.1. London Dry Gin
- 11.1.2. Old Tom Gin
- 11.1.3. Plymouth Gin
- 11.1.4. Other Types
- 11.2. Market Analysis, Insights and Forecast - by Distribution Channel
- 11.2.1. On -Trade
- 11.2.2. Off - Trade
- 11.1. Market Analysis, Insights and Forecast - by Type
- 12. Competitive Analysis
- 12.1. Global Market Share Analysis 2025
- 12.2. Company Profiles
- 12.2.1 Diageo Plc
- 12.2.1.1. Overview
- 12.2.1.2. Products
- 12.2.1.3. SWOT Analysis
- 12.2.1.4. Recent Developments
- 12.2.1.5. Financials (Based on Availability)
- 12.2.2 Anheuser-Busch Companies LLC *List Not Exhaustive
- 12.2.2.1. Overview
- 12.2.2.2. Products
- 12.2.2.3. SWOT Analysis
- 12.2.2.4. Recent Developments
- 12.2.2.5. Financials (Based on Availability)
- 12.2.3 Bacardi Limited
- 12.2.3.1. Overview
- 12.2.3.2. Products
- 12.2.3.3. SWOT Analysis
- 12.2.3.4. Recent Developments
- 12.2.3.5. Financials (Based on Availability)
- 12.2.4 Suntory Holdings Limited
- 12.2.4.1. Overview
- 12.2.4.2. Products
- 12.2.4.3. SWOT Analysis
- 12.2.4.4. Recent Developments
- 12.2.4.5. Financials (Based on Availability)
- 12.2.5 The East India Company Ltd
- 12.2.5.1. Overview
- 12.2.5.2. Products
- 12.2.5.3. SWOT Analysis
- 12.2.5.4. Recent Developments
- 12.2.5.5. Financials (Based on Availability)
- 12.2.6 Remy Cointreau
- 12.2.6.1. Overview
- 12.2.6.2. Products
- 12.2.6.3. SWOT Analysis
- 12.2.6.4. Recent Developments
- 12.2.6.5. Financials (Based on Availability)
- 12.2.7 William Grant & Sons Ltd
- 12.2.7.1. Overview
- 12.2.7.2. Products
- 12.2.7.3. SWOT Analysis
- 12.2.7.4. Recent Developments
- 12.2.7.5. Financials (Based on Availability)
- 12.2.8 Radico Khaitan Ltd
- 12.2.8.1. Overview
- 12.2.8.2. Products
- 12.2.8.3. SWOT Analysis
- 12.2.8.4. Recent Developments
- 12.2.8.5. Financials (Based on Availability)
- 12.2.9 San Miguel Corporation
- 12.2.9.1. Overview
- 12.2.9.2. Products
- 12.2.9.3. SWOT Analysis
- 12.2.9.4. Recent Developments
- 12.2.9.5. Financials (Based on Availability)
- 12.2.10 Davide Campari-Milano N V
- 12.2.10.1. Overview
- 12.2.10.2. Products
- 12.2.10.3. SWOT Analysis
- 12.2.10.4. Recent Developments
- 12.2.10.5. Financials (Based on Availability)
- 12.2.11 Pernod Ricard
- 12.2.11.1. Overview
- 12.2.11.2. Products
- 12.2.11.3. SWOT Analysis
- 12.2.11.4. Recent Developments
- 12.2.11.5. Financials (Based on Availability)
- 12.2.1 Diageo Plc
List of Figures
- Figure 1: Global Gin Industry Revenue Breakdown (billion, %) by Region 2025 & 2033
- Figure 2: Global Gin Industry Volume Breakdown (Billion, %) by Region 2025 & 2033
- Figure 3: North America Gin Industry Revenue (billion), by Type 2025 & 2033
- Figure 4: North America Gin Industry Volume (Billion), by Type 2025 & 2033
- Figure 5: North America Gin Industry Revenue Share (%), by Type 2025 & 2033
- Figure 6: North America Gin Industry Volume Share (%), by Type 2025 & 2033
- Figure 7: North America Gin Industry Revenue (billion), by Distribution Channel 2025 & 2033
- Figure 8: North America Gin Industry Volume (Billion), by Distribution Channel 2025 & 2033
- Figure 9: North America Gin Industry Revenue Share (%), by Distribution Channel 2025 & 2033
- Figure 10: North America Gin Industry Volume Share (%), by Distribution Channel 2025 & 2033
- Figure 11: North America Gin Industry Revenue (billion), by Country 2025 & 2033
- Figure 12: North America Gin Industry Volume (Billion), by Country 2025 & 2033
- Figure 13: North America Gin Industry Revenue Share (%), by Country 2025 & 2033
- Figure 14: North America Gin Industry Volume Share (%), by Country 2025 & 2033
- Figure 15: Europe Gin Industry Revenue (billion), by Type 2025 & 2033
- Figure 16: Europe Gin Industry Volume (Billion), by Type 2025 & 2033
- Figure 17: Europe Gin Industry Revenue Share (%), by Type 2025 & 2033
- Figure 18: Europe Gin Industry Volume Share (%), by Type 2025 & 2033
- Figure 19: Europe Gin Industry Revenue (billion), by Distribution Channel 2025 & 2033
- Figure 20: Europe Gin Industry Volume (Billion), by Distribution Channel 2025 & 2033
- Figure 21: Europe Gin Industry Revenue Share (%), by Distribution Channel 2025 & 2033
- Figure 22: Europe Gin Industry Volume Share (%), by Distribution Channel 2025 & 2033
- Figure 23: Europe Gin Industry Revenue (billion), by Country 2025 & 2033
- Figure 24: Europe Gin Industry Volume (Billion), by Country 2025 & 2033
- Figure 25: Europe Gin Industry Revenue Share (%), by Country 2025 & 2033
- Figure 26: Europe Gin Industry Volume Share (%), by Country 2025 & 2033
- Figure 27: Asia Pacific Gin Industry Revenue (billion), by Type 2025 & 2033
- Figure 28: Asia Pacific Gin Industry Volume (Billion), by Type 2025 & 2033
- Figure 29: Asia Pacific Gin Industry Revenue Share (%), by Type 2025 & 2033
- Figure 30: Asia Pacific Gin Industry Volume Share (%), by Type 2025 & 2033
- Figure 31: Asia Pacific Gin Industry Revenue (billion), by Distribution Channel 2025 & 2033
- Figure 32: Asia Pacific Gin Industry Volume (Billion), by Distribution Channel 2025 & 2033
- Figure 33: Asia Pacific Gin Industry Revenue Share (%), by Distribution Channel 2025 & 2033
- Figure 34: Asia Pacific Gin Industry Volume Share (%), by Distribution Channel 2025 & 2033
- Figure 35: Asia Pacific Gin Industry Revenue (billion), by Country 2025 & 2033
- Figure 36: Asia Pacific Gin Industry Volume (Billion), by Country 2025 & 2033
- Figure 37: Asia Pacific Gin Industry Revenue Share (%), by Country 2025 & 2033
- Figure 38: Asia Pacific Gin Industry Volume Share (%), by Country 2025 & 2033
- Figure 39: South America Gin Industry Revenue (billion), by Type 2025 & 2033
- Figure 40: South America Gin Industry Volume (Billion), by Type 2025 & 2033
- Figure 41: South America Gin Industry Revenue Share (%), by Type 2025 & 2033
- Figure 42: South America Gin Industry Volume Share (%), by Type 2025 & 2033
- Figure 43: South America Gin Industry Revenue (billion), by Distribution Channel 2025 & 2033
- Figure 44: South America Gin Industry Volume (Billion), by Distribution Channel 2025 & 2033
- Figure 45: South America Gin Industry Revenue Share (%), by Distribution Channel 2025 & 2033
- Figure 46: South America Gin Industry Volume Share (%), by Distribution Channel 2025 & 2033
- Figure 47: South America Gin Industry Revenue (billion), by Country 2025 & 2033
- Figure 48: South America Gin Industry Volume (Billion), by Country 2025 & 2033
- Figure 49: South America Gin Industry Revenue Share (%), by Country 2025 & 2033
- Figure 50: South America Gin Industry Volume Share (%), by Country 2025 & 2033
- Figure 51: Middle East Gin Industry Revenue (billion), by Type 2025 & 2033
- Figure 52: Middle East Gin Industry Volume (Billion), by Type 2025 & 2033
- Figure 53: Middle East Gin Industry Revenue Share (%), by Type 2025 & 2033
- Figure 54: Middle East Gin Industry Volume Share (%), by Type 2025 & 2033
- Figure 55: Middle East Gin Industry Revenue (billion), by Distribution Channel 2025 & 2033
- Figure 56: Middle East Gin Industry Volume (Billion), by Distribution Channel 2025 & 2033
- Figure 57: Middle East Gin Industry Revenue Share (%), by Distribution Channel 2025 & 2033
- Figure 58: Middle East Gin Industry Volume Share (%), by Distribution Channel 2025 & 2033
- Figure 59: Middle East Gin Industry Revenue (billion), by Country 2025 & 2033
- Figure 60: Middle East Gin Industry Volume (Billion), by Country 2025 & 2033
- Figure 61: Middle East Gin Industry Revenue Share (%), by Country 2025 & 2033
- Figure 62: Middle East Gin Industry Volume Share (%), by Country 2025 & 2033
- Figure 63: Saudi Arabia Gin Industry Revenue (billion), by Type 2025 & 2033
- Figure 64: Saudi Arabia Gin Industry Volume (Billion), by Type 2025 & 2033
- Figure 65: Saudi Arabia Gin Industry Revenue Share (%), by Type 2025 & 2033
- Figure 66: Saudi Arabia Gin Industry Volume Share (%), by Type 2025 & 2033
- Figure 67: Saudi Arabia Gin Industry Revenue (billion), by Distribution Channel 2025 & 2033
- Figure 68: Saudi Arabia Gin Industry Volume (Billion), by Distribution Channel 2025 & 2033
- Figure 69: Saudi Arabia Gin Industry Revenue Share (%), by Distribution Channel 2025 & 2033
- Figure 70: Saudi Arabia Gin Industry Volume Share (%), by Distribution Channel 2025 & 2033
- Figure 71: Saudi Arabia Gin Industry Revenue (billion), by Country 2025 & 2033
- Figure 72: Saudi Arabia Gin Industry Volume (Billion), by Country 2025 & 2033
- Figure 73: Saudi Arabia Gin Industry Revenue Share (%), by Country 2025 & 2033
- Figure 74: Saudi Arabia Gin Industry Volume Share (%), by Country 2025 & 2033
List of Tables
- Table 1: Global Gin Industry Revenue billion Forecast, by Type 2020 & 2033
- Table 2: Global Gin Industry Volume Billion Forecast, by Type 2020 & 2033
- Table 3: Global Gin Industry Revenue billion Forecast, by Distribution Channel 2020 & 2033
- Table 4: Global Gin Industry Volume Billion Forecast, by Distribution Channel 2020 & 2033
- Table 5: Global Gin Industry Revenue billion Forecast, by Region 2020 & 2033
- Table 6: Global Gin Industry Volume Billion Forecast, by Region 2020 & 2033
- Table 7: Global Gin Industry Revenue billion Forecast, by Type 2020 & 2033
- Table 8: Global Gin Industry Volume Billion Forecast, by Type 2020 & 2033
- Table 9: Global Gin Industry Revenue billion Forecast, by Distribution Channel 2020 & 2033
- Table 10: Global Gin Industry Volume Billion Forecast, by Distribution Channel 2020 & 2033
- Table 11: Global Gin Industry Revenue billion Forecast, by Country 2020 & 2033
- Table 12: Global Gin Industry Volume Billion Forecast, by Country 2020 & 2033
- Table 13: United States Gin Industry Revenue (billion) Forecast, by Application 2020 & 2033
- Table 14: United States Gin Industry Volume (Billion) Forecast, by Application 2020 & 2033
- Table 15: Canada Gin Industry Revenue (billion) Forecast, by Application 2020 & 2033
- Table 16: Canada Gin Industry Volume (Billion) Forecast, by Application 2020 & 2033
- Table 17: Mexico Gin Industry Revenue (billion) Forecast, by Application 2020 & 2033
- Table 18: Mexico Gin Industry Volume (Billion) Forecast, by Application 2020 & 2033
- Table 19: Rest of North America Gin Industry Revenue (billion) Forecast, by Application 2020 & 2033
- Table 20: Rest of North America Gin Industry Volume (Billion) Forecast, by Application 2020 & 2033
- Table 21: Global Gin Industry Revenue billion Forecast, by Type 2020 & 2033
- Table 22: Global Gin Industry Volume Billion Forecast, by Type 2020 & 2033
- Table 23: Global Gin Industry Revenue billion Forecast, by Distribution Channel 2020 & 2033
- Table 24: Global Gin Industry Volume Billion Forecast, by Distribution Channel 2020 & 2033
- Table 25: Global Gin Industry Revenue billion Forecast, by Country 2020 & 2033
- Table 26: Global Gin Industry Volume Billion Forecast, by Country 2020 & 2033
- Table 27: United Kingdom Gin Industry Revenue (billion) Forecast, by Application 2020 & 2033
- Table 28: United Kingdom Gin Industry Volume (Billion) Forecast, by Application 2020 & 2033
- Table 29: Germany Gin Industry Revenue (billion) Forecast, by Application 2020 & 2033
- Table 30: Germany Gin Industry Volume (Billion) Forecast, by Application 2020 & 2033
- Table 31: Spain Gin Industry Revenue (billion) Forecast, by Application 2020 & 2033
- Table 32: Spain Gin Industry Volume (Billion) Forecast, by Application 2020 & 2033
- Table 33: France Gin Industry Revenue (billion) Forecast, by Application 2020 & 2033
- Table 34: France Gin Industry Volume (Billion) Forecast, by Application 2020 & 2033
- Table 35: Italy Gin Industry Revenue (billion) Forecast, by Application 2020 & 2033
- Table 36: Italy Gin Industry Volume (Billion) Forecast, by Application 2020 & 2033
- Table 37: Russia Gin Industry Revenue (billion) Forecast, by Application 2020 & 2033
- Table 38: Russia Gin Industry Volume (Billion) Forecast, by Application 2020 & 2033
- Table 39: Rest of Europe Gin Industry Revenue (billion) Forecast, by Application 2020 & 2033
- Table 40: Rest of Europe Gin Industry Volume (Billion) Forecast, by Application 2020 & 2033
- Table 41: Global Gin Industry Revenue billion Forecast, by Type 2020 & 2033
- Table 42: Global Gin Industry Volume Billion Forecast, by Type 2020 & 2033
- Table 43: Global Gin Industry Revenue billion Forecast, by Distribution Channel 2020 & 2033
- Table 44: Global Gin Industry Volume Billion Forecast, by Distribution Channel 2020 & 2033
- Table 45: Global Gin Industry Revenue billion Forecast, by Country 2020 & 2033
- Table 46: Global Gin Industry Volume Billion Forecast, by Country 2020 & 2033
- Table 47: China Gin Industry Revenue (billion) Forecast, by Application 2020 & 2033
- Table 48: China Gin Industry Volume (Billion) Forecast, by Application 2020 & 2033
- Table 49: Japan Gin Industry Revenue (billion) Forecast, by Application 2020 & 2033
- Table 50: Japan Gin Industry Volume (Billion) Forecast, by Application 2020 & 2033
- Table 51: India Gin Industry Revenue (billion) Forecast, by Application 2020 & 2033
- Table 52: India Gin Industry Volume (Billion) Forecast, by Application 2020 & 2033
- Table 53: Australia Gin Industry Revenue (billion) Forecast, by Application 2020 & 2033
- Table 54: Australia Gin Industry Volume (Billion) Forecast, by Application 2020 & 2033
- Table 55: Rest of Asia Pacific Gin Industry Revenue (billion) Forecast, by Application 2020 & 2033
- Table 56: Rest of Asia Pacific Gin Industry Volume (Billion) Forecast, by Application 2020 & 2033
- Table 57: Global Gin Industry Revenue billion Forecast, by Type 2020 & 2033
- Table 58: Global Gin Industry Volume Billion Forecast, by Type 2020 & 2033
- Table 59: Global Gin Industry Revenue billion Forecast, by Distribution Channel 2020 & 2033
- Table 60: Global Gin Industry Volume Billion Forecast, by Distribution Channel 2020 & 2033
- Table 61: Global Gin Industry Revenue billion Forecast, by Country 2020 & 2033
- Table 62: Global Gin Industry Volume Billion Forecast, by Country 2020 & 2033
- Table 63: Brazil Gin Industry Revenue (billion) Forecast, by Application 2020 & 2033
- Table 64: Brazil Gin Industry Volume (Billion) Forecast, by Application 2020 & 2033
- Table 65: Argentina Gin Industry Revenue (billion) Forecast, by Application 2020 & 2033
- Table 66: Argentina Gin Industry Volume (Billion) Forecast, by Application 2020 & 2033
- Table 67: Rest of South America Gin Industry Revenue (billion) Forecast, by Application 2020 & 2033
- Table 68: Rest of South America Gin Industry Volume (Billion) Forecast, by Application 2020 & 2033
- Table 69: Global Gin Industry Revenue billion Forecast, by Type 2020 & 2033
- Table 70: Global Gin Industry Volume Billion Forecast, by Type 2020 & 2033
- Table 71: Global Gin Industry Revenue billion Forecast, by Distribution Channel 2020 & 2033
- Table 72: Global Gin Industry Volume Billion Forecast, by Distribution Channel 2020 & 2033
- Table 73: Global Gin Industry Revenue billion Forecast, by Country 2020 & 2033
- Table 74: Global Gin Industry Volume Billion Forecast, by Country 2020 & 2033
- Table 75: Global Gin Industry Revenue billion Forecast, by Type 2020 & 2033
- Table 76: Global Gin Industry Volume Billion Forecast, by Type 2020 & 2033
- Table 77: Global Gin Industry Revenue billion Forecast, by Distribution Channel 2020 & 2033
- Table 78: Global Gin Industry Volume Billion Forecast, by Distribution Channel 2020 & 2033
- Table 79: Global Gin Industry Revenue billion Forecast, by Country 2020 & 2033
- Table 80: Global Gin Industry Volume Billion Forecast, by Country 2020 & 2033
- Table 81: South Africa Gin Industry Revenue (billion) Forecast, by Application 2020 & 2033
- Table 82: South Africa Gin Industry Volume (Billion) Forecast, by Application 2020 & 2033
- Table 83: Rest of Middle East Gin Industry Revenue (billion) Forecast, by Application 2020 & 2033
- Table 84: Rest of Middle East Gin Industry Volume (Billion) Forecast, by Application 2020 & 2033
Frequently Asked Questions
1. What is the projected Compound Annual Growth Rate (CAGR) of the Gin Industry?
The projected CAGR is approximately 3.8%.
2. Which companies are prominent players in the Gin Industry?
Key companies in the market include Diageo Plc, Anheuser-Busch Companies LLC *List Not Exhaustive, Bacardi Limited, Suntory Holdings Limited, The East India Company Ltd, Remy Cointreau, William Grant & Sons Ltd, Radico Khaitan Ltd, San Miguel Corporation, Davide Campari-Milano N V, Pernod Ricard.
3. What are the main segments of the Gin Industry?
The market segments include Type, Distribution Channel.
4. Can you provide details about the market size?
The market size is estimated to be USD 24.4 billion as of 2022.
5. What are some drivers contributing to market growth?
Increasing Demand for Functional and Fortified Food; Multi-functionality and Wide Application of Riboflavin.
6. What are the notable trends driving market growth?
Infusion of Gin in Premium Cocktails.
7. Are there any restraints impacting market growth?
Low Stability of Riboflavin on Exposure to Light and Heat.
8. Can you provide examples of recent developments in the market?
In April 2022, Bombay Sapphire, a brand owned by Bacardi launched a lemon-flavored gin called Citron Presse gin, made with Mediterranean lemons. The company has planned to roll out new products across significant countries including Australia, Germany, Ireland Andorra, Belgium, France, Switzerland, Denmark, Austria, Spain, and Portugal.
9. What pricing options are available for accessing the report?
Pricing options include single-user, multi-user, and enterprise licenses priced at USD 4750, USD 5250, and USD 8750 respectively.
10. Is the market size provided in terms of value or volume?
The market size is provided in terms of value, measured in billion and volume, measured in Billion.
11. Are there any specific market keywords associated with the report?
Yes, the market keyword associated with the report is "Gin Industry," which aids in identifying and referencing the specific market segment covered.
12. How do I determine which pricing option suits my needs best?
The pricing options vary based on user requirements and access needs. Individual users may opt for single-user licenses, while businesses requiring broader access may choose multi-user or enterprise licenses for cost-effective access to the report.
13. Are there any additional resources or data provided in the Gin Industry report?
While the report offers comprehensive insights, it's advisable to review the specific contents or supplementary materials provided to ascertain if additional resources or data are available.
14. How can I stay updated on further developments or reports in the Gin Industry?
To stay informed about further developments, trends, and reports in the Gin Industry, consider subscribing to industry newsletters, following relevant companies and organizations, or regularly checking reputable industry news sources and publications.
Methodology
Step 1 - Identification of Relevant Samples Size from Population Database


Step 2 - Approaches for Defining Global Market Size (Value, Volume* & Price*)

Note*: In applicable scenarios
Step 3 - Data Sources
Primary Research
- Web Analytics
- Survey Reports
- Research Institute
- Latest Research Reports
- Opinion Leaders
Secondary Research
- Annual Reports
- White Paper
- Latest Press Release
- Industry Association
- Paid Database
- Investor Presentations

Step 4 - Data Triangulation
Involves using different sources of information in order to increase the validity of a study
These sources are likely to be stakeholders in a program - participants, other researchers, program staff, other community members, and so on.
Then we put all data in single framework & apply various statistical tools to find out the dynamic on the market.
During the analysis stage, feedback from the stakeholder groups would be compared to determine areas of agreement as well as areas of divergence