

Key Insights
The Asia-Pacific Energy Bar Market is poised for significant expansion, with an estimated market size of $1.05 billion in 2025. This growth is underpinned by a robust Compound Annual Growth Rate (CAGR) of 9.86%, projected to continue through 2033. This dynamism is primarily driven by increasing health consciousness among consumers, a growing demand for convenient and portable nutrition solutions, and the rising popularity of fitness and sports activities across the region. The surge in disposable incomes, particularly in emerging economies like China, India, and other Southeast Asian nations, is also fueling consumer spending on premium and functional food products, including energy bars. Furthermore, an expanding retail infrastructure, encompassing both traditional brick-and-mortar outlets like supermarkets and hypermarkets, alongside the rapidly growing online retail segment, is enhancing product accessibility and contributing to market penetration. The evolution of consumer preferences towards natural ingredients, reduced sugar content, and specialized formulations catering to specific dietary needs (e.g., vegan, gluten-free) is also shaping product innovation and market trends.
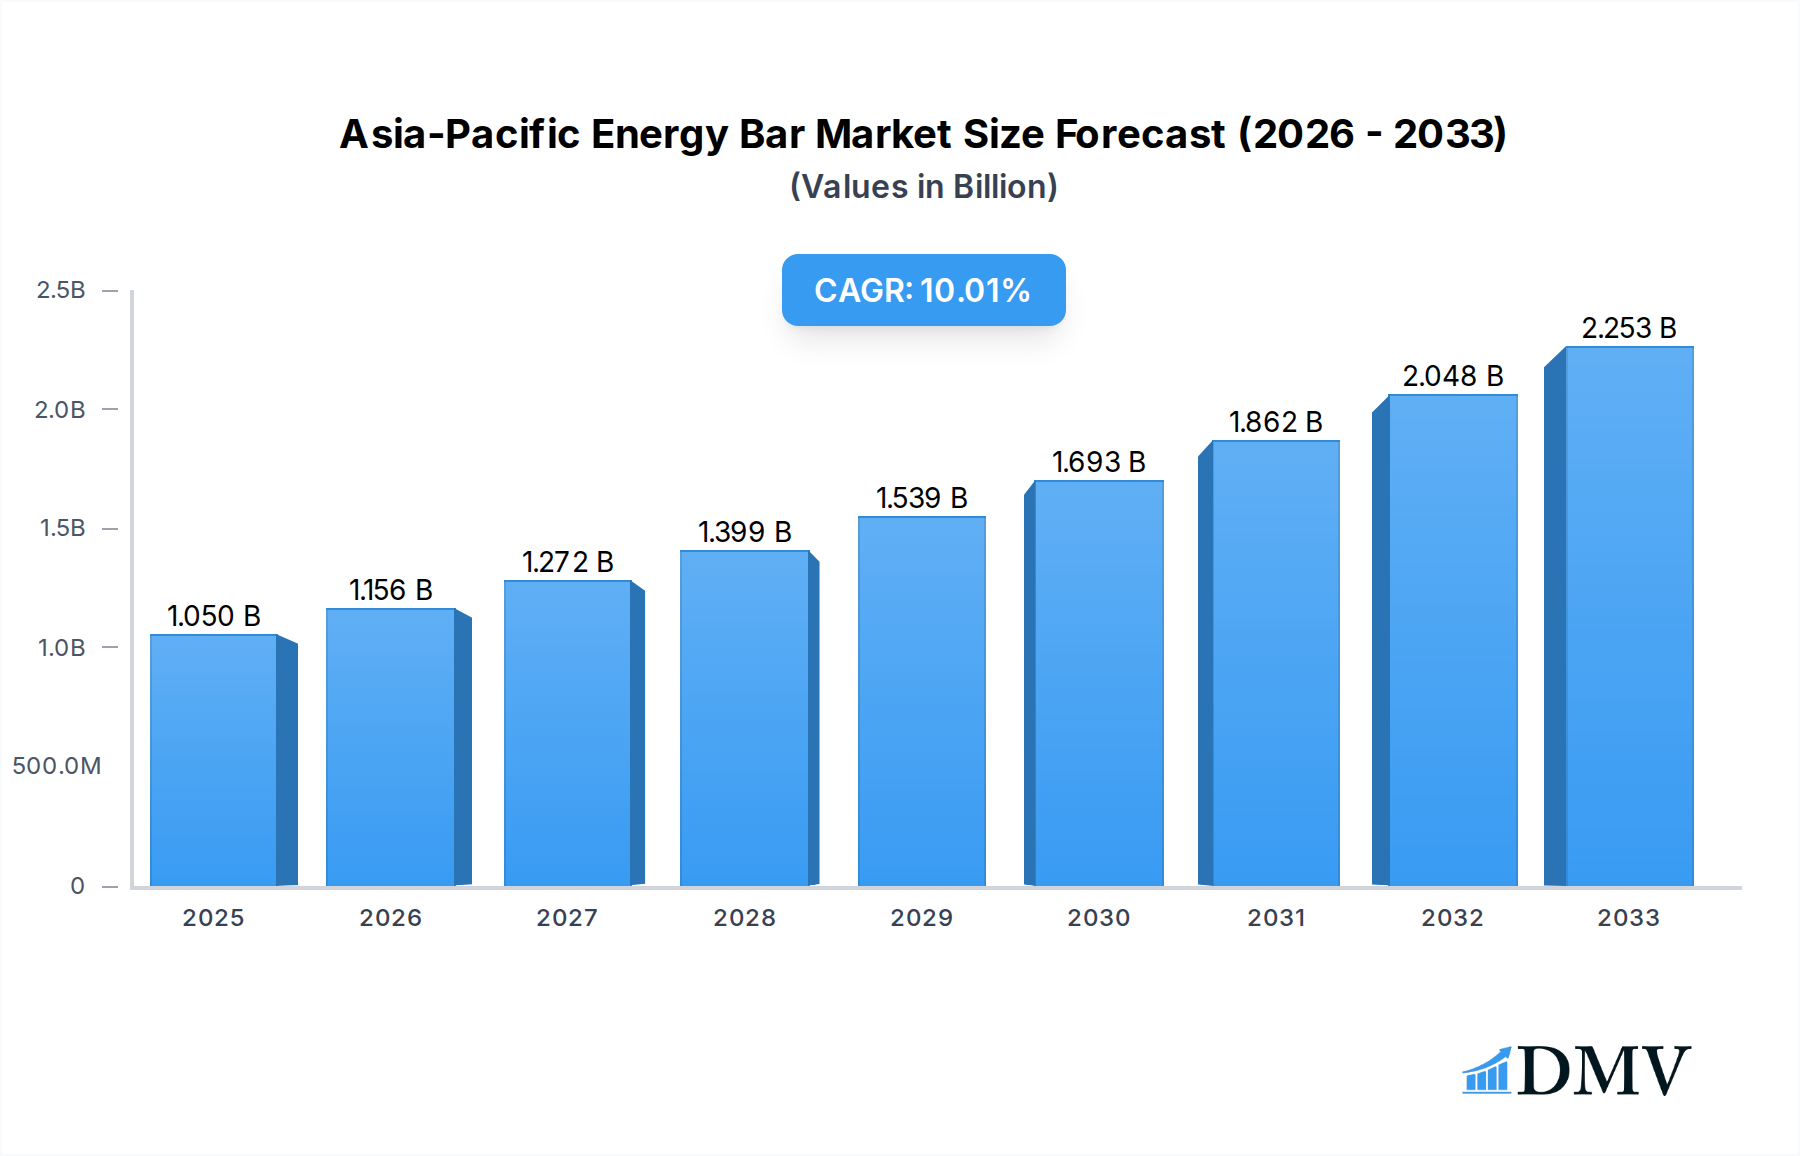
Asia-Pacific Energy Bar Market Market Size (In Billion)
However, the market is not without its challenges. The presence of numerous substitute products, including other convenient snack options and nutritional supplements, poses a restraint. Additionally, price sensitivity in certain segments of the Asia-Pacific market, coupled with the costs associated with sourcing high-quality ingredients, can impact profitability and market adoption. Nonetheless, strategic product innovation, targeted marketing campaigns highlighting the health benefits and convenience of energy bars, and expansion into underserved geographical pockets within the Asia-Pacific region are expected to overcome these hurdles. Key distribution channels like supermarkets/hypermarkets and online retail stores are anticipated to be dominant, while speciality stores will cater to niche segments. Companies such as Abbott Nutrition, General Mills, and Clif Bar & Company are actively participating in this competitive landscape, driving innovation and market growth.

Asia-Pacific Energy Bar Market Company Market Share
This in-depth Asia-Pacific energy bar market report provides a comprehensive analysis of the dynamic and rapidly expanding market. Covering the study period of 2019–2033, with 2025 as the base and estimated year, and a robust forecast period of 2025–2033, this research dives deep into market composition, industry evolution, regional dominance, product innovations, growth drivers, challenges, and future opportunities. Uncover key trends, stakeholder insights, and strategic market forecasts for this burgeoning sector.
Asia-Pacific Energy Bar Market Market Composition & Trends
The Asia-Pacific energy bar market exhibits a moderately consolidated landscape, driven by continuous product innovation and evolving consumer preferences for convenient and nutritious food options. Key innovation catalysts include the incorporation of plant-based ingredients, functional additions like probiotics and adaptogens, and a growing emphasis on sugar-free and allergen-free formulations. The regulatory landscape varies across the region, with some countries implementing stricter labeling requirements while others encourage product development through favorable policies. Substitute products, such as protein drinks and fruit snacks, present a competitive challenge, but energy bars often retain an edge due to their portability and targeted nutritional profiles. End-user profiles are diverse, encompassing athletes, fitness enthusiasts, busy professionals, and increasingly, health-conscious millennials and Gen Z consumers seeking on-the-go nutrition. Merger and acquisition (M&A) activities are projected to intensify as larger players seek to expand their regional footprint and acquire innovative brands. M&A deal values are estimated to reach USD 5.2 billion by the end of the forecast period, reflecting the market's consolidation potential and strategic importance.
- Market Concentration: Moderately consolidated, with key players focusing on product differentiation and market penetration.
- Innovation Catalysts: Plant-based ingredients, functional additives (probiotics, adaptogens), sugar-free, allergen-free formulations.
- Regulatory Landscape: Varied across the APAC region, impacting product approvals and marketing claims.
- Substitute Products: Protein drinks, fruit snacks, ready-to-eat meals.
- End-User Profiles: Athletes, fitness enthusiasts, professionals, health-conscious youth.
- M&A Activities: Increasing strategic acquisitions to gain market share and technological capabilities.
Asia-Pacific Energy Bar Market Industry Evolution
The Asia-Pacific energy bar industry has witnessed a significant growth trajectory over the historical period of 2019–2024, propelled by increasing health awareness, rising disposable incomes, and a growing demand for convenient, on-the-go nutrition. The base year of 2025 sees the market consolidating its gains, with an anticipated compound annual growth rate (CAGR) of 10.5% throughout the forecast period of 2025–2033. Technological advancements have played a crucial role, enabling the development of more sophisticated production techniques that enhance shelf-life, improve texture, and allow for the inclusion of a wider array of nutritional ingredients. For instance, advancements in extrusion technology have facilitated the creation of energy bars with varied textures, from chewy to crunchy, catering to diverse consumer preferences. Furthermore, the integration of smart packaging solutions, offering enhanced tamper-evidence and extended shelf-life, is a growing trend. Shifting consumer demands are a pivotal evolutionary factor. There is a pronounced shift towards natural and organic ingredients, with consumers actively seeking energy bars free from artificial flavors, colors, and preservatives. The demand for specialized energy bars catering to specific dietary needs, such as vegan, gluten-free, and keto-friendly options, has surged. This evolution is not just about functional benefits but also about ethical sourcing and sustainability, influencing purchasing decisions. The rise of e-commerce and direct-to-consumer (DTC) channels has also democratized access, allowing smaller brands to reach a wider audience and enabling consumers to discover niche products. The penetration of specialized energy bars for specific activities, like pre-workout or post-recovery, is also on the rise, reflecting a more informed and targeted consumer base.
Leading Regions, Countries, or Segments in Asia-Pacific Energy Bar Market
Within the dynamic Asia-Pacific energy bar market, China emerges as the dominant region, followed closely by India and Japan. The Supermarkets/Hypermarkets distribution channel currently holds the largest market share, accounting for an estimated 35% of total sales in 2025. This dominance is attributed to the wide reach and accessibility of these retail formats, enabling consumers to easily purchase energy bars alongside other grocery items. The sheer volume of foot traffic and established supply chains in these outlets make them a primary point of purchase for a broad demographic.
Dominant Region Analysis:
- China: Driven by a burgeoning middle class, increasing disposable income, and a growing awareness of health and wellness. Government initiatives promoting healthy lifestyles further bolster market growth. The sheer size of its population presents a massive consumer base.
- India: Characterized by a rapidly growing health-conscious population, a significant youth demographic actively engaged in fitness, and the rise of localized brands catering to specific regional tastes and dietary preferences. The increasing penetration of modern retail formats also plays a crucial role.
- Japan: Marked by a mature market with a strong emphasis on health, convenience, and premium quality. Consumers are willing to pay a premium for functional benefits and innovative product offerings. An aging population also drives demand for convenient, nutrient-dense options.
Dominant Distribution Channel: Supermarkets/Hypermarkets:
- Key Drivers of Dominance:
- Extensive Reach and Accessibility: Ubiquitous presence across urban and semi-urban areas.
- One-Stop Shopping Experience: Consumers can conveniently purchase energy bars alongside other daily necessities.
- Promotional Activities and Bundling: Supermarkets frequently offer discounts, loyalty programs, and bundle deals, attracting price-sensitive consumers.
- Established Supply Chains: Efficient logistics and inventory management ensure product availability.
- In-depth Analysis: The established trust and familiarity associated with supermarket brands also contribute to their dominance. These retailers act as crucial touchpoints for both established global brands and emerging local players. The visual merchandising and prominent placement of energy bars within these stores further enhance their visibility and purchase likelihood. While online retail is rapidly growing, the impulse purchase nature of many energy bar buys often favors the physical presence offered by supermarkets and hypermarkets, especially for new product introductions.
- Key Drivers of Dominance:
Asia-Pacific Energy Bar Market Product Innovations
Product innovation in the Asia-Pacific energy bar market is characterized by a focus on natural ingredients, enhanced functionality, and specialized dietary needs. Manufacturers are increasingly leveraging superfoods like chia seeds, goji berries, and spirulina to boost nutritional value and appeal to health-conscious consumers. The development of bars with sustained energy release, incorporating complex carbohydrates and slow-digesting proteins, is a significant trend, catering to athletes and individuals with demanding lifestyles. For instance, bars formulated with MCT oil for rapid energy and beta-glucans for improved satiety are gaining traction. Furthermore, the demand for plant-based, gluten-free, and vegan energy bars continues to rise, reflecting a growing segment of consumers seeking ethically and environmentally conscious food choices. Unique selling propositions often revolve around clean labels, allergen-free formulations, and novel flavor combinations, differentiating brands in a competitive landscape. The incorporation of prebiotics and probiotics for gut health is another innovative avenue being explored.
Propelling Factors for Asia-Pacific Energy Bar Market Growth
Several key factors are propelling the growth of the Asia-Pacific energy bar market. The escalating awareness of health and wellness, coupled with the rising prevalence of lifestyle diseases, is driving consumers towards healthier snacking options. The burgeoning middle class across the APAC region, with its increasing disposable income, can afford premium and specialized health food products, including energy bars. Furthermore, the accelerating pace of urbanization and demanding work schedules create a need for convenient, on-the-go nutrition solutions. Technological advancements in food processing and ingredient innovation allow for the development of more diverse and appealing energy bar formulations, catering to specific dietary needs and preferences. Favorable government policies promoting healthy living and sports participation also contribute to market expansion.
Obstacles in the Asia-Pacific Energy Bar Market Market
Despite its robust growth, the Asia-Pacific energy bar market faces several obstacles. Regulatory variations across different countries can pose challenges for market entry and product standardization, impacting supply chain efficiency. The intense competition from established global brands and a growing number of local players can lead to price wars and reduced profit margins. Supply chain disruptions, exacerbated by geopolitical factors and global economic volatility, can affect the availability and cost of key ingredients, impacting production and distribution. Furthermore, consumer perceptions regarding the perceived "processed" nature of some energy bars and a preference for whole, unprocessed foods can act as a restraint. The high cost of premium ingredients and advanced manufacturing processes can also translate to higher retail prices, limiting accessibility for a significant segment of the population.
Future Opportunities in Asia-Pacific Energy Bar Market
The Asia-Pacific energy bar market is ripe with emerging opportunities. The expanding middle class in Southeast Asian countries presents a largely untapped market for energy bars. The growing popularity of endurance sports and outdoor activities across the region will drive demand for specialized performance-oriented energy bars. Innovations in sustainable sourcing and eco-friendly packaging will appeal to the increasingly environmentally conscious consumer base. The development of personalized nutrition solutions, incorporating genetic profiling or wearable technology data, could unlock a highly targeted and lucrative segment. Furthermore, the untapped potential of rural markets, as distribution networks expand, offers significant growth avenues.
Major Players in the Asia-Pacific Energy Bar Market Ecosystem
- PowerBar Inc
- Probar LLC
- Abbott Nutrition Manufacturing Inc
- Coconut Magic
- General Mills Inc
- NuGo Nutrition
- Kellogg NA Co
- Clif Bar & Company
Key Developments in Asia-Pacific Energy Bar Market Industry
- February 2022: India-based Yoga Bar brand extended its product category into kids' nutrition with the launch of new mixes 'Yo Chos' and 'Yo Fills', indicating a strategic move to capture younger demographics and diversify product offerings.
Strategic Asia-Pacific Energy Bar Market Market Forecast
The Asia-Pacific energy bar market is projected for sustained and significant growth, driven by a confluence of favorable demographic trends, increasing health consciousness, and evolving consumer lifestyles. The forecast period of 2025–2033 is expected to witness a substantial expansion, with market value projected to reach USD 12.7 billion by 2033. Key growth catalysts include the continued rise of the middle class, a growing demand for convenient and healthy snacking options, and ongoing product innovation that caters to niche dietary needs and preferences. The increasing adoption of online retail channels will further democratize access and foster competition, while strategic collaborations and acquisitions will shape the market landscape. The focus on natural, organic, and functional ingredients will continue to define product development, ensuring the market's resilience and long-term potential.
Asia-Pacific Energy Bar Market Segmentation
-
1. Distribution Channel
- 1.1. Supermarkets/Hypermarkets
- 1.2. Convenience Stores
- 1.3. Speciality Stores
- 1.4. Online Retail Stores
- 1.5. Other Distribution Channels
-
2. Geography
-
2.1. Asia Pacific
- 2.1.1. China
- 2.1.2. Japan
- 2.1.3. India
- 2.1.4. Australia
- 2.1.5. Rest of Asia-Pacific
-
2.1. Asia Pacific
Asia-Pacific Energy Bar Market Segmentation By Geography
-
1. Asia Pacific
- 1.1. China
- 1.2. Japan
- 1.3. India
- 1.4. Australia
- 1.5. Rest of Asia Pacific
Asia-Pacific Energy Bar Market Regional Market Share
Geographic Coverage of Asia-Pacific Energy Bar Market
Asia-Pacific Energy Bar Market REPORT HIGHLIGHTS
| Aspects | Details |
|---|---|
| Study Period | 2020-2034 |
| Base Year | 2025 |
| Estimated Year | 2026 |
| Forecast Period | 2026-2034 |
| Historical Period | 2020-2025 |
| Growth Rate | CAGR of 9.86% from 2020-2034 |
| Segmentation |
|
Table of Contents
- 1. Introduction
- 1.1. Research Scope
- 1.2. Market Segmentation
- 1.3. Research Objective
- 1.4. Definitions and Assumptions
- 2. Executive Summary
- 2.1. Market Snapshot
- 3. Market Dynamics
- 3.1. Market Drivers
- 3.2. Market Restrains
- 3.3. Market Trends
- 3.4. Market Opportunities
- 4. Market Factor Analysis
- 4.1. Porters Five Forces
- 4.1.1. Bargaining Power of Suppliers
- 4.1.2. Bargaining Power of Buyers
- 4.1.3. Threat of New Entrants
- 4.1.4. Threat of Substitutes
- 4.1.5. Competitive Rivalry
- 4.2. PESTEL analysis
- 4.3. BCG Analysis
- 4.3.1. Stars (High Growth, High Market Share)
- 4.3.2. Cash Cows (Low Growth, High Market Share)
- 4.3.3. Question Mark (High Growth, Low Market Share)
- 4.3.4. Dogs (Low Growth, Low Market Share)
- 4.4. Ansoff Matrix Analysis
- 4.5. Supply Chain Analysis
- 4.6. Regulatory Landscape
- 4.7. Current Market Potential and Opportunity Assessment (TAM–SAM–SOM Framework)
- 4.8. DMV Analyst Note
- 4.1. Porters Five Forces
- 5. Market Analysis, Insights and Forecast 2021-2033
- 5.1. Market Analysis, Insights and Forecast - by Distribution Channel
- 5.1.1. Supermarkets/Hypermarkets
- 5.1.2. Convenience Stores
- 5.1.3. Speciality Stores
- 5.1.4. Online Retail Stores
- 5.1.5. Other Distribution Channels
- 5.2. Market Analysis, Insights and Forecast - by Geography
- 5.2.1. Asia Pacific
- 5.2.1.1. China
- 5.2.1.2. Japan
- 5.2.1.3. India
- 5.2.1.4. Australia
- 5.2.1.5. Rest of Asia-Pacific
- 5.2.1. Asia Pacific
- 5.3. Market Analysis, Insights and Forecast - by Region
- 5.3.1. Asia Pacific
- 5.1. Market Analysis, Insights and Forecast - by Distribution Channel
- 6. Asia-Pacific Energy Bar Market Analysis, Insights and Forecast, 2021-2033
- 6.1. Market Analysis, Insights and Forecast - by Distribution Channel
- 6.1.1. Supermarkets/Hypermarkets
- 6.1.2. Convenience Stores
- 6.1.3. Speciality Stores
- 6.1.4. Online Retail Stores
- 6.1.5. Other Distribution Channels
- 6.2. Market Analysis, Insights and Forecast - by Geography
- 6.2.1. Asia Pacific
- 6.2.1.1. China
- 6.2.1.2. Japan
- 6.2.1.3. India
- 6.2.1.4. Australia
- 6.2.1.5. Rest of Asia-Pacific
- 6.2.1. Asia Pacific
- 6.1. Market Analysis, Insights and Forecast - by Distribution Channel
- 7. Competitive Analysis
- 7.1. Company Profiles
- 7.1.1 PowerBar Inc
- 7.1.1.1. Company Overview
- 7.1.1.2. Products
- 7.1.1.3. Company Financials
- 7.1.1.4. SWOT Analysis
- 7.1.2 Probar LLC
- 7.1.2.1. Company Overview
- 7.1.2.2. Products
- 7.1.2.3. Company Financials
- 7.1.2.4. SWOT Analysis
- 7.1.3 Abbott Nutrition Manufacturing Inc
- 7.1.3.1. Company Overview
- 7.1.3.2. Products
- 7.1.3.3. Company Financials
- 7.1.3.4. SWOT Analysis
- 7.1.4 Coconut Magic
- 7.1.4.1. Company Overview
- 7.1.4.2. Products
- 7.1.4.3. Company Financials
- 7.1.4.4. SWOT Analysis
- 7.1.5 General Mills Inc
- 7.1.5.1. Company Overview
- 7.1.5.2. Products
- 7.1.5.3. Company Financials
- 7.1.5.4. SWOT Analysis
- 7.1.6 NuGo Nutrition*List Not Exhaustive
- 7.1.6.1. Company Overview
- 7.1.6.2. Products
- 7.1.6.3. Company Financials
- 7.1.6.4. SWOT Analysis
- 7.1.7 Kellogg NA Co
- 7.1.7.1. Company Overview
- 7.1.7.2. Products
- 7.1.7.3. Company Financials
- 7.1.7.4. SWOT Analysis
- 7.1.8 Clif Bar & Company
- 7.1.8.1. Company Overview
- 7.1.8.2. Products
- 7.1.8.3. Company Financials
- 7.1.8.4. SWOT Analysis
- 7.1.1 PowerBar Inc
- 7.2. Market Entropy
- 7.2.1 Company's Key Areas Served
- 7.2.2 Recent Developments
- 7.3. Company Market Share Analysis 2025
- 7.3.1 Top 5 Companies Market Share Analysis
- 7.3.2 Top 3 Companies Market Share Analysis
- 7.4. List of Potential Customers
- 8. Research Methodology
List of Figures
- Figure 1: Asia-Pacific Energy Bar Market Revenue Breakdown (billion, %) by Product 2025 & 2033
- Figure 2: Asia-Pacific Energy Bar Market Share (%) by Company 2025
List of Tables
- Table 1: Asia-Pacific Energy Bar Market Revenue billion Forecast, by Distribution Channel 2020 & 2033
- Table 2: Asia-Pacific Energy Bar Market Revenue billion Forecast, by Geography 2020 & 2033
- Table 3: Asia-Pacific Energy Bar Market Revenue billion Forecast, by Region 2020 & 2033
- Table 4: Asia-Pacific Energy Bar Market Revenue billion Forecast, by Distribution Channel 2020 & 2033
- Table 5: Asia-Pacific Energy Bar Market Revenue billion Forecast, by Geography 2020 & 2033
- Table 6: Asia-Pacific Energy Bar Market Revenue billion Forecast, by Country 2020 & 2033
- Table 7: China Asia-Pacific Energy Bar Market Revenue (billion) Forecast, by Application 2020 & 2033
- Table 8: Japan Asia-Pacific Energy Bar Market Revenue (billion) Forecast, by Application 2020 & 2033
- Table 9: India Asia-Pacific Energy Bar Market Revenue (billion) Forecast, by Application 2020 & 2033
- Table 10: Australia Asia-Pacific Energy Bar Market Revenue (billion) Forecast, by Application 2020 & 2033
- Table 11: Rest of Asia Pacific Asia-Pacific Energy Bar Market Revenue (billion) Forecast, by Application 2020 & 2033
Frequently Asked Questions
1. What is the projected Compound Annual Growth Rate (CAGR) of the Asia-Pacific Energy Bar Market?
The projected CAGR is approximately 9.86%.
2. Which companies are prominent players in the Asia-Pacific Energy Bar Market?
Key companies in the market include PowerBar Inc, Probar LLC, Abbott Nutrition Manufacturing Inc, Coconut Magic, General Mills Inc, NuGo Nutrition*List Not Exhaustive, Kellogg NA Co, Clif Bar & Company.
3. What are the main segments of the Asia-Pacific Energy Bar Market?
The market segments include Distribution Channel, Geography.
4. Can you provide details about the market size?
The market size is estimated to be USD 1.05 billion as of 2022.
5. What are some drivers contributing to market growth?
Rising Health Consciousness among consumer.
6. What are the notable trends driving market growth?
Australia Dominating the Energy Bar Market.
7. Are there any restraints impacting market growth?
High Cost of natural Ingredients.
8. Can you provide examples of recent developments in the market?
In February 2022, the India-based Yoga bar brand extended its product category into kids' nutrition with the launch of new mixes 'Yo Chos' and 'Yo Fills'.
9. What pricing options are available for accessing the report?
Pricing options include single-user, multi-user, and enterprise licenses priced at USD 4750, USD 5250, and USD 8750 respectively.
10. Is the market size provided in terms of value or volume?
The market size is provided in terms of value, measured in billion.
11. Are there any specific market keywords associated with the report?
Yes, the market keyword associated with the report is "Asia-Pacific Energy Bar Market," which aids in identifying and referencing the specific market segment covered.
12. How do I determine which pricing option suits my needs best?
The pricing options vary based on user requirements and access needs. Individual users may opt for single-user licenses, while businesses requiring broader access may choose multi-user or enterprise licenses for cost-effective access to the report.
13. Are there any additional resources or data provided in the Asia-Pacific Energy Bar Market report?
While the report offers comprehensive insights, it's advisable to review the specific contents or supplementary materials provided to ascertain if additional resources or data are available.
14. How can I stay updated on further developments or reports in the Asia-Pacific Energy Bar Market?
To stay informed about further developments, trends, and reports in the Asia-Pacific Energy Bar Market, consider subscribing to industry newsletters, following relevant companies and organizations, or regularly checking reputable industry news sources and publications.
Methodology
Step 1 - Identification of Relevant Samples Size from Population Database


Step 2 - Approaches for Defining Global Market Size (Value, Volume* & Price*)

Note*: In applicable scenarios
Step 3 - Data Sources
Primary Research
- Web Analytics
- Survey Reports
- Research Institute
- Latest Research Reports
- Opinion Leaders
Secondary Research
- Annual Reports
- White Paper
- Latest Press Release
- Industry Association
- Paid Database
- Investor Presentations

Step 4 - Data Triangulation
Involves using different sources of information in order to increase the validity of a study
These sources are likely to be stakeholders in a program - participants, other researchers, program staff, other community members, and so on.
Then we put all data in single framework & apply various statistical tools to find out the dynamic on the market.
During the analysis stage, feedback from the stakeholder groups would be compared to determine areas of agreement as well as areas of divergence