

Key Insights
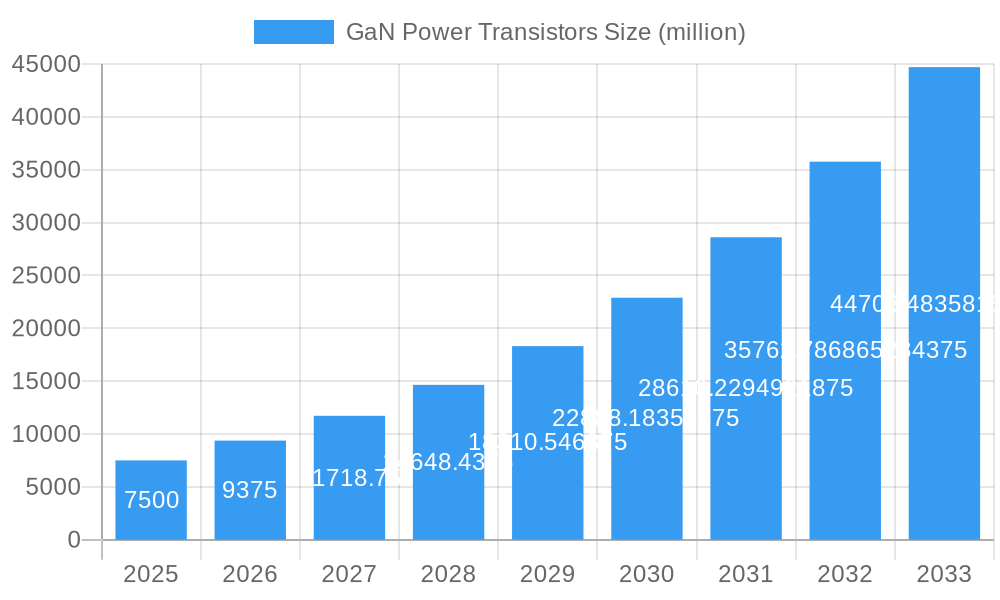
The global Gallium Nitride (GaN) Power Transistors market is projected for significant growth, expected to reach 635.1 million by 2025, driven by a Compound Annual Growth Rate (CAGR) of 35.9%. This expansion is attributed to the escalating demand for energy-efficient and high-performance electronic devices across diverse industries. Key growth catalysts include the consumer electronics sector, where GaN technology is transforming chargers and adapters with enhanced charging speeds and compact designs. The rapid advancement of telecommunications, particularly 5G infrastructure deployment, presents a substantial opportunity, as GaN power transistors deliver superior power efficiency and higher operating frequencies essential for network equipment. Furthermore, the expanding data center and server industry, propelled by the surge in cloud computing and data analytics, requires advanced power solutions, positioning GaN power transistors as a preferred choice due to their improved thermal management and reduced energy loss. The integration of GaN technology in audio amplifiers also contributes to market expansion, enabling higher fidelity sound and increased power output in streamlined designs.
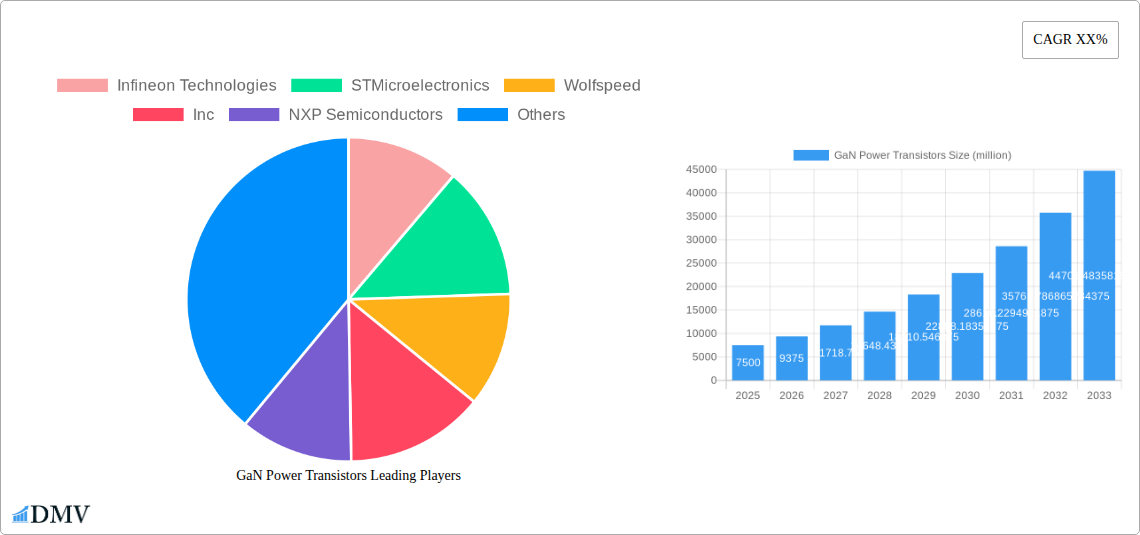
GaN Power Transistors Market Size (In Million)
Despite considerable market potential, certain factors may present challenges. The initial cost of GaN-on-SiC transistors, often higher than conventional silicon-based alternatives, can impede widespread adoption in price-sensitive applications. However, continuous improvements in manufacturing processes are progressively lowering these costs. The market features a dynamic competitive landscape, with established companies and emerging innovators driving ongoing product development and technological advancements. Geographically, the Asia Pacific region, led by China, is anticipated to be the dominant market due to its robust manufacturing infrastructure and a rapidly growing end-user base. North America and Europe also represent vital markets, supported by substantial R&D investments and the adoption of cutting-edge technologies in industrial, aerospace, and defense sectors. Ongoing research into GaN-on-Si technology is expected to further broaden the application scope of these transistors, stimulating continued market expansion.
GaN Power Transistors Company Market Share
GaN Power Transistors Market Research Report: Forecast 2025-2033
This comprehensive report offers an in-depth analysis of the global GaN power transistors market, forecasting its trajectory from 2025 to 2033. Spanning a detailed study period of 2019–2033, with 2025 serving as the base and estimated year, this report delves into market composition, industry evolution, regional dominance, product innovations, growth drivers, challenges, and future opportunities. It meticulously examines key segments including GaN on SiC Transistors and GaN on Si Transistors, and applications such as Consumer (Charger, Adapter), Telecom, Datacenter & Servers, Audio Amplifier, Industrial, Aerospace & Defence, and others. With an estimated market size of xx million in 2025 and projected to reach xx million by 2033, exhibiting a CAGR of xx% during the forecast period, this report is an indispensable resource for stakeholders seeking to navigate the dynamic Gallium Nitride power electronics landscape.
GaN Power Transistors Market Composition & Trends
The GaN power transistors market is characterized by a moderately concentrated structure, with leading players investing heavily in research and development to drive innovation. Catalysts for this market growth include the increasing demand for high-efficiency power solutions across diverse applications, spurred by stringent energy regulations and the electrification trend. Substitute products like silicon-based power transistors are gradually being displaced by the superior performance characteristics of GaN, such as higher switching speeds, lower on-resistance, and reduced thermal losses. End-user profiles span from consumer electronics manufacturers seeking compact and powerful chargers and adapters to industrial enterprises deploying GaN for motor drives and power supplies, and the rapidly expanding datacenters & servers sector demanding high-performance computing infrastructure. Mergers and acquisitions (M&A) are playing a pivotal role in market consolidation and technology acquisition, with significant deal values contributing to the strategic expansion of key companies. For instance, M&A activities in the historical period 2019-2024 are estimated to be valued at over xx million, reflecting the high strategic importance of GaN technology.
- Market Share Distribution: Key players hold substantial market shares, driven by their robust product portfolios and established distribution networks.
- Innovation Catalysts: Miniaturization trends, increasing power density requirements, and the drive for energy efficiency are primary innovation drivers.
- Regulatory Landscapes: Government initiatives promoting energy conservation and the adoption of advanced semiconductor technologies are favorable.
- Substitute Products: Silicon carbide (SiC) and advanced silicon power transistors are key competitors, though GaN offers distinct advantages in specific applications.
- End-User Profiles: Consumer electronics, telecommunications infrastructure, industrial automation, and automotive sectors represent significant demand drivers.
- M&A Activities: Strategic acquisitions are enabling companies to expand their GaN offerings and gain market access.
GaN Power Transistors Industry Evolution
The GaN power transistors industry has witnessed a remarkable evolution, transitioning from niche applications to mainstream adoption across a broad spectrum of industries. The historical period 2019–2024 saw significant growth, fueled by breakthroughs in material science and fabrication techniques that improved the reliability and scalability of Gallium Nitride devices. The market growth trajectory has been consistently upward, with annual growth rates averaging xx% during this period. Technological advancements, particularly in GaN on SiC transistors and the emerging GaN on Si transistors segment, have been instrumental in this progress. GaN on SiC continues to dominate in high-power, high-frequency applications due to its superior thermal conductivity, while GaN on Si is gaining traction in cost-sensitive consumer and industrial markets due to its potential for lower manufacturing costs. Shifting consumer demands for smaller, more powerful, and energy-efficient electronic devices, such as rapid chargers for smartphones and laptops, have accelerated the adoption of GaN power transistors. The telecom sector, driven by the rollout of 5G infrastructure, represents another substantial growth area, requiring high-frequency and high-efficiency power amplifiers. Similarly, the insatiable demand for processing power in datacenters & servers necessitates advanced power management solutions where GaN excels. Adoption metrics indicate a rapid increase in the integration of GaN devices, with an estimated xx% penetration in new consumer charger designs by 2024. The base year 2025 marks a significant inflection point, with continued exponential growth anticipated throughout the forecast period 2025–2033, driven by further technological refinements and expanding application horizons. The market is projected to grow from an estimated xx million in 2025 to xx million by 2033, representing a compound annual growth rate of xx%.
Leading Regions, Countries, or Segments in GaN Power Transistors
The GaN power transistors market exhibits distinct regional and segmental leadership, driven by a confluence of technological advancements, robust industrial ecosystems, and supportive government policies.
Dominant Region: Asia Pacific
The Asia Pacific region stands out as the leading market for GaN power transistors, propelled by its status as a global manufacturing hub for consumer electronics, telecommunications equipment, and automotive components. The presence of major foundries and semiconductor manufacturers, coupled with substantial investments in R&D, solidifies its dominance.
- Key Drivers in Asia Pacific:
- Massive Consumer Electronics Production: China, South Korea, and Taiwan are at the forefront of manufacturing chargers, adapters, and other consumer devices that increasingly incorporate GaN technology for improved performance and miniaturization.
- 5G Infrastructure Rollout: The rapid deployment of 5G networks across the region necessitates high-efficiency power amplifiers, a key application for GaN transistors, particularly in the Telecom segment.
- Growing Datacenter Investment: Countries like China and India are witnessing significant investments in datacenters and server infrastructure, creating a substantial demand for high-performance power solutions, thus driving the Datacenter & Servers segment.
- Government Initiatives & Subsidies: Various governments in the region are actively promoting semiconductor innovation and the adoption of advanced technologies, including GaN, through favorable policies and funding.
- Strong Automotive Sector Growth: The burgeoning electric vehicle (EV) market in Asia Pacific is a significant driver for GaN, used in onboard chargers, DC-DC converters, and inverters.
Dominant Segment: GaN on SiC Transistors (High-Power Applications)
Within the types of GaN power transistors, GaN on SiC transistors continue to dominate in high-power and high-frequency applications due to the superior thermal conductivity of silicon carbide, enabling higher power densities and better heat dissipation. This segment is crucial for demanding applications in Aerospace & Defence, industrial power supplies, and high-end telecommunications infrastructure.
- Dominance Factors for GaN on SiC:
- Superior Thermal Performance: Essential for applications operating at high power levels and demanding excellent heat management.
- High Frequency Operation: Critical for advanced radar systems in Aerospace & Defence and high-performance Telecom base stations.
- High Voltage Capability: Necessary for robust industrial power conversion and grid-level applications.
- Established Supply Chain: A more mature supply chain for SiC substrates compared to some other GaN integration methods.
Emerging Dominant Segment: GaN on Si Transistors (Consumer & Industrial)
While GaN on SiC leads in high-end applications, GaN on Si transistors are rapidly gaining market share, particularly in the Consumer (Charger, Adapter) and general Industrial segments. The use of silicon as a substrate offers significant cost advantages, making GaN technology more accessible for mass-market products.
- Growth Drivers for GaN on Si:
- Cost-Effectiveness: Lower substrate costs translate to more competitive pricing for consumer electronics.
- Miniaturization of Consumer Devices: Enables smaller and lighter chargers, adapters, and power banks.
- Increasing Adoption in Power Supplies: GaN on Si is becoming the preferred choice for switch-mode power supplies (SMPS) in a wide array of electronic devices.
- Technological Maturation: Improved manufacturing processes are enhancing the reliability and performance of GaN on Si devices.
The interplay between these regional strengths and segment-specific advantages is shaping the overall growth and development of the GaN power transistors market.
GaN Power Transistors Product Innovations
Product innovations in the GaN power transistors market are centered around enhancing performance, efficiency, and integration. Manufacturers are focusing on developing devices with higher breakdown voltages, lower on-resistance, and faster switching speeds, enabling smaller and more power-efficient solutions. Key advancements include the introduction of integrated GaN power stages, which combine GaN transistors with drivers and controllers, simplifying design and reducing component count for applications like USB-C PD chargers and server power supplies. Performance metrics such as improved thermal management capabilities, reduced switching losses (resulting in up to xx% efficiency gains in certain applications), and extended operating frequencies are key selling points. These innovations are directly impacting the design of Consumer (Charger, Adapter) products, leading to faster charging speeds and more compact form factors, as well as revolutionizing Datacenter & Servers with more energy-efficient power delivery systems.
Propelling Factors for GaN Power Transistors Growth
The GaN power transistors market is propelled by a synergistic combination of technological, economic, and regulatory influences. The inherent superior electrical characteristics of Gallium Nitride, including higher electron mobility and breakdown field strength compared to silicon, enable devices that are smaller, lighter, more efficient, and operate at higher frequencies and temperatures. This translates into significant energy savings, reduced cooling requirements, and increased power density. Economically, the growing demand for energy-efficient solutions across all sectors, from consumer electronics to industrial automation, directly fuels the adoption of GaN. Furthermore, government regulations aimed at improving energy efficiency and reducing carbon emissions, such as stricter power factor correction standards and mandates for higher efficiency power supplies, are creating a favorable market environment. The increasing investment in 5G infrastructure and the expansion of datacenters & servers are also significant drivers, requiring advanced power conversion technologies.
- Technological Advancements: Higher switching speeds, lower on-resistance, and improved thermal performance of GaN.
- Energy Efficiency Demands: Global push for reduced energy consumption in electronics and industrial processes.
- Regulatory Support: Government mandates and incentives for energy-efficient power solutions.
- Expansion of 5G and Datacenters: Need for high-performance, efficient power for critical infrastructure.
Obstacles in the GaN Power Transistors Market
Despite its promising growth, the GaN power transistors market faces several obstacles. The higher manufacturing cost of GaN wafers compared to silicon remains a significant barrier, particularly for cost-sensitive applications. While prices are decreasing, the initial investment can still deter some manufacturers. Supply chain disruptions, especially for specialized materials and fabrication processes, can lead to lead time issues and price volatility. Regulatory hurdles, although generally supportive of energy efficiency, can sometimes be slow to adapt to new technologies, creating a lag in adoption. Competitive pressures from established silicon power semiconductor manufacturers and alternative technologies like Silicon Carbide (SiC) also present challenges. Furthermore, the need for specialized design expertise and qualification processes for GaN devices can add complexity and cost to product development. The estimated impact of these challenges on market growth is approximately xx% reduction in projected CAGR.
- Higher Manufacturing Costs: Primarily due to wafer substrate and fabrication complexity.
- Supply Chain Bottlenecks: Availability of specialized materials and fabrication capacity.
- Design Complexity & Expertise: Requirement for specialized knowledge for integration.
- Market Inertia: Resistance to change from established silicon-based solutions.
Future Opportunities in GaN Power Transistors
The future of the GaN power transistors market is brimming with opportunities, driven by emerging trends and technological advancements. The burgeoning electric vehicle (EV) market presents a massive opportunity for GaN in onboard chargers, DC-DC converters, and inverters, where its high efficiency and power density are critical. The continued expansion of 5G and future wireless communication technologies will require even more advanced GaN-based solutions for base stations and user equipment. The increasing adoption of renewable energy systems, such as solar and wind power, will also drive demand for efficient power conversion and grid integration solutions enabled by GaN. Furthermore, advancements in GaN on Si technology are expected to unlock new possibilities in cost-sensitive consumer electronics and industrial applications, further broadening the market reach. The development of higher voltage GaN devices could also open doors in grid infrastructure and high-power industrial applications.
- Electric Vehicles (EVs): Significant growth potential in onboard chargers, power converters, and inverters.
- 5G and Beyond: Continued demand for high-frequency, high-efficiency solutions.
- Renewable Energy: Application in solar inverters, wind turbines, and energy storage systems.
- Consumer Electronics: Further penetration into power adapters, gaming consoles, and portable devices.
- Industrial Automation: Enhanced efficiency in motor drives, power supplies, and robotics.
Major Players in the GaN Power Transistors Ecosystem
- Infineon Technologies
- STMicroelectronics
- Wolfspeed, Inc.
- NXP Semiconductors
- MACOM
- Qorvo
- Transphorm
- Ampleon
- Microchip Technology (Microsemis)
- Mitsubishi Electric
- RFHIC Corporation
- EPC
- GaN Systems
- ROHM Semiconductor
- United Monolithic Semiconductors (UMS)
- Integra Technologies Inc.
- Tagore Technology
- Sainty-tech Communications
- WAVICE
- BeRex, Inc.
- WAVEPIA
- Toshiba
- Innoscience
- CorEnergy
- Runxin Microelectronics
Key Developments in GaN Power Transistors Industry
- 2023/2024: Increased market adoption of GaN in USB-C PD chargers, reaching an estimated xx million units sold.
- 2023/2024: Significant investments in expanding GaN fabrication capacity by leading players like Wolfspeed and Innoscience.
- 2023: Introduction of higher voltage (e.g., 650V and 900V) GaN on Si transistors for industrial and consumer applications.
- 2022/2023: Enhanced integration of GaN components with control ICs, simplifying system design.
- 2022: Growing interest and initial product releases for GaN in automotive powertrain applications.
- 2021/2022: Advancements in GaN on Si technology leading to improved reliability and reduced cost.
- 2020/2021: Increased use of GaN transistors in 5G base station power amplifiers, contributing to improved efficiency.
- 2019/2020: Focus on developing more robust and thermally efficient GaN packaging solutions.
- 2019: Emergence of new market entrants and strategic partnerships focusing on GaN technology.
Strategic GaN Power Transistors Market Forecast
The strategic forecast for the GaN power transistors market is exceptionally positive, driven by relentless innovation and expanding application horizons. The inherent efficiency and performance advantages of GaN technology position it as the future of power electronics. Key growth catalysts include the accelerating adoption in electric vehicles, the continued build-out of 5G networks, and the increasing demand for energy-efficient solutions in datacenters and industrial sectors. As manufacturing costs decline and technological maturity advances, GaN is poised to displace traditional silicon-based power transistors across a wider range of applications. The market is projected to experience substantial growth, creating significant opportunities for established players and new entrants alike who can offer high-performance, cost-effective GaN solutions. The total market value is projected to reach xx million by 2033, underscoring the transformative impact of GaN on the global power electronics landscape.
GaN Power Transistors Segmentation
-
1. Application
- 1.1. Consumer (Charger, Adapter)
- 1.2. Telecom, Datacenter & Servers
- 1.3. Audio Amplifier
- 1.4. Industrial
- 1.5. Aerospace & Defence
- 1.6. Others
-
2. Types
- 2.1. GaN on SiC Transistors
- 2.2. GaN on Si Transistors
GaN Power Transistors Segmentation By Geography
-
1. North America
- 1.1. United States
- 1.2. Canada
- 1.3. Mexico
-
2. South America
- 2.1. Brazil
- 2.2. Argentina
- 2.3. Rest of South America
-
3. Europe
- 3.1. United Kingdom
- 3.2. Germany
- 3.3. France
- 3.4. Italy
- 3.5. Spain
- 3.6. Russia
- 3.7. Benelux
- 3.8. Nordics
- 3.9. Rest of Europe
-
4. Middle East & Africa
- 4.1. Turkey
- 4.2. Israel
- 4.3. GCC
- 4.4. North Africa
- 4.5. South Africa
- 4.6. Rest of Middle East & Africa
-
5. Asia Pacific
- 5.1. China
- 5.2. India
- 5.3. Japan
- 5.4. South Korea
- 5.5. ASEAN
- 5.6. Oceania
- 5.7. Rest of Asia Pacific
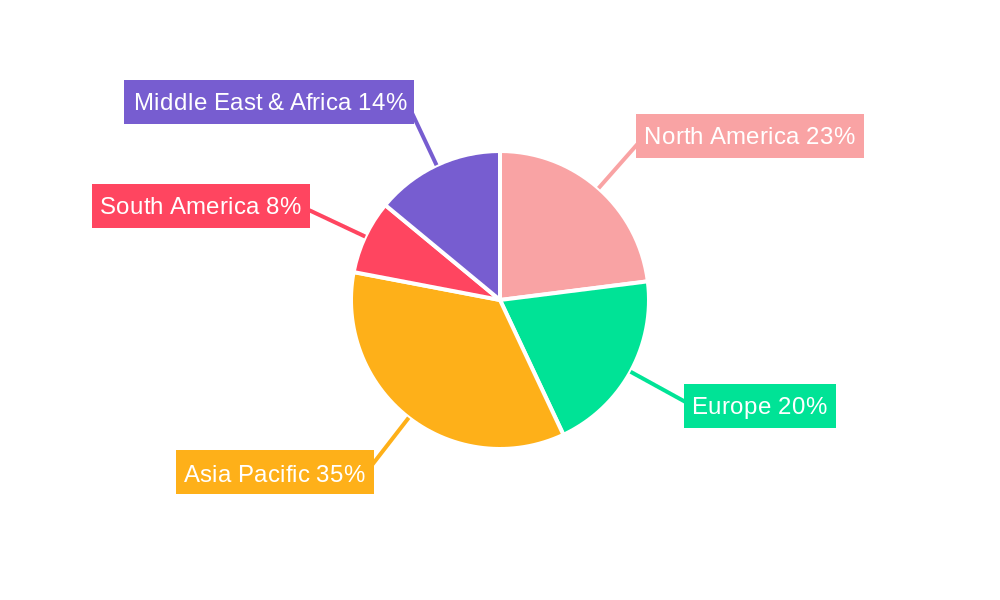
GaN Power Transistors Regional Market Share
Geographic Coverage of GaN Power Transistors
GaN Power Transistors REPORT HIGHLIGHTS
| Aspects | Details |
|---|---|
| Study Period | 2020-2034 |
| Base Year | 2025 |
| Estimated Year | 2026 |
| Forecast Period | 2026-2034 |
| Historical Period | 2020-2025 |
| Growth Rate | CAGR of 35.9% from 2020-2034 |
| Segmentation |
|
Table of Contents
- 1. Introduction
- 1.1. Research Scope
- 1.2. Market Segmentation
- 1.3. Research Methodology
- 1.4. Definitions and Assumptions
- 2. Executive Summary
- 2.1. Introduction
- 3. Market Dynamics
- 3.1. Introduction
- 3.2. Market Drivers
- 3.3. Market Restrains
- 3.4. Market Trends
- 4. Market Factor Analysis
- 4.1. Porters Five Forces
- 4.2. Supply/Value Chain
- 4.3. PESTEL analysis
- 4.4. Market Entropy
- 4.5. Patent/Trademark Analysis
- 5. Global GaN Power Transistors Analysis, Insights and Forecast, 2020-2032
- 5.1. Market Analysis, Insights and Forecast - by Application
- 5.1.1. Consumer (Charger, Adapter)
- 5.1.2. Telecom, Datacenter & Servers
- 5.1.3. Audio Amplifier
- 5.1.4. Industrial
- 5.1.5. Aerospace & Defence
- 5.1.6. Others
- 5.2. Market Analysis, Insights and Forecast - by Types
- 5.2.1. GaN on SiC Transistors
- 5.2.2. GaN on Si Transistors
- 5.3. Market Analysis, Insights and Forecast - by Region
- 5.3.1. North America
- 5.3.2. South America
- 5.3.3. Europe
- 5.3.4. Middle East & Africa
- 5.3.5. Asia Pacific
- 5.1. Market Analysis, Insights and Forecast - by Application
- 6. North America GaN Power Transistors Analysis, Insights and Forecast, 2020-2032
- 6.1. Market Analysis, Insights and Forecast - by Application
- 6.1.1. Consumer (Charger, Adapter)
- 6.1.2. Telecom, Datacenter & Servers
- 6.1.3. Audio Amplifier
- 6.1.4. Industrial
- 6.1.5. Aerospace & Defence
- 6.1.6. Others
- 6.2. Market Analysis, Insights and Forecast - by Types
- 6.2.1. GaN on SiC Transistors
- 6.2.2. GaN on Si Transistors
- 6.1. Market Analysis, Insights and Forecast - by Application
- 7. South America GaN Power Transistors Analysis, Insights and Forecast, 2020-2032
- 7.1. Market Analysis, Insights and Forecast - by Application
- 7.1.1. Consumer (Charger, Adapter)
- 7.1.2. Telecom, Datacenter & Servers
- 7.1.3. Audio Amplifier
- 7.1.4. Industrial
- 7.1.5. Aerospace & Defence
- 7.1.6. Others
- 7.2. Market Analysis, Insights and Forecast - by Types
- 7.2.1. GaN on SiC Transistors
- 7.2.2. GaN on Si Transistors
- 7.1. Market Analysis, Insights and Forecast - by Application
- 8. Europe GaN Power Transistors Analysis, Insights and Forecast, 2020-2032
- 8.1. Market Analysis, Insights and Forecast - by Application
- 8.1.1. Consumer (Charger, Adapter)
- 8.1.2. Telecom, Datacenter & Servers
- 8.1.3. Audio Amplifier
- 8.1.4. Industrial
- 8.1.5. Aerospace & Defence
- 8.1.6. Others
- 8.2. Market Analysis, Insights and Forecast - by Types
- 8.2.1. GaN on SiC Transistors
- 8.2.2. GaN on Si Transistors
- 8.1. Market Analysis, Insights and Forecast - by Application
- 9. Middle East & Africa GaN Power Transistors Analysis, Insights and Forecast, 2020-2032
- 9.1. Market Analysis, Insights and Forecast - by Application
- 9.1.1. Consumer (Charger, Adapter)
- 9.1.2. Telecom, Datacenter & Servers
- 9.1.3. Audio Amplifier
- 9.1.4. Industrial
- 9.1.5. Aerospace & Defence
- 9.1.6. Others
- 9.2. Market Analysis, Insights and Forecast - by Types
- 9.2.1. GaN on SiC Transistors
- 9.2.2. GaN on Si Transistors
- 9.1. Market Analysis, Insights and Forecast - by Application
- 10. Asia Pacific GaN Power Transistors Analysis, Insights and Forecast, 2020-2032
- 10.1. Market Analysis, Insights and Forecast - by Application
- 10.1.1. Consumer (Charger, Adapter)
- 10.1.2. Telecom, Datacenter & Servers
- 10.1.3. Audio Amplifier
- 10.1.4. Industrial
- 10.1.5. Aerospace & Defence
- 10.1.6. Others
- 10.2. Market Analysis, Insights and Forecast - by Types
- 10.2.1. GaN on SiC Transistors
- 10.2.2. GaN on Si Transistors
- 10.1. Market Analysis, Insights and Forecast - by Application
- 11. Competitive Analysis
- 11.1. Global Market Share Analysis 2025
- 11.2. Company Profiles
- 11.2.1 Infineon Technologies
- 11.2.1.1. Overview
- 11.2.1.2. Products
- 11.2.1.3. SWOT Analysis
- 11.2.1.4. Recent Developments
- 11.2.1.5. Financials (Based on Availability)
- 11.2.2 STMicroelectronics
- 11.2.2.1. Overview
- 11.2.2.2. Products
- 11.2.2.3. SWOT Analysis
- 11.2.2.4. Recent Developments
- 11.2.2.5. Financials (Based on Availability)
- 11.2.3 Wolfspeed
- 11.2.3.1. Overview
- 11.2.3.2. Products
- 11.2.3.3. SWOT Analysis
- 11.2.3.4. Recent Developments
- 11.2.3.5. Financials (Based on Availability)
- 11.2.4 Inc
- 11.2.4.1. Overview
- 11.2.4.2. Products
- 11.2.4.3. SWOT Analysis
- 11.2.4.4. Recent Developments
- 11.2.4.5. Financials (Based on Availability)
- 11.2.5 NXP Semiconductors
- 11.2.5.1. Overview
- 11.2.5.2. Products
- 11.2.5.3. SWOT Analysis
- 11.2.5.4. Recent Developments
- 11.2.5.5. Financials (Based on Availability)
- 11.2.6 MACOM
- 11.2.6.1. Overview
- 11.2.6.2. Products
- 11.2.6.3. SWOT Analysis
- 11.2.6.4. Recent Developments
- 11.2.6.5. Financials (Based on Availability)
- 11.2.7 NXP Semiconductors
- 11.2.7.1. Overview
- 11.2.7.2. Products
- 11.2.7.3. SWOT Analysis
- 11.2.7.4. Recent Developments
- 11.2.7.5. Financials (Based on Availability)
- 11.2.8 Qorvo
- 11.2.8.1. Overview
- 11.2.8.2. Products
- 11.2.8.3. SWOT Analysis
- 11.2.8.4. Recent Developments
- 11.2.8.5. Financials (Based on Availability)
- 11.2.9 Transphorm
- 11.2.9.1. Overview
- 11.2.9.2. Products
- 11.2.9.3. SWOT Analysis
- 11.2.9.4. Recent Developments
- 11.2.9.5. Financials (Based on Availability)
- 11.2.10 Ampleon
- 11.2.10.1. Overview
- 11.2.10.2. Products
- 11.2.10.3. SWOT Analysis
- 11.2.10.4. Recent Developments
- 11.2.10.5. Financials (Based on Availability)
- 11.2.11 Microchip Technology (Microsemis)
- 11.2.11.1. Overview
- 11.2.11.2. Products
- 11.2.11.3. SWOT Analysis
- 11.2.11.4. Recent Developments
- 11.2.11.5. Financials (Based on Availability)
- 11.2.12 Mitsubishi Electric
- 11.2.12.1. Overview
- 11.2.12.2. Products
- 11.2.12.3. SWOT Analysis
- 11.2.12.4. Recent Developments
- 11.2.12.5. Financials (Based on Availability)
- 11.2.13 RFHIC Corporation
- 11.2.13.1. Overview
- 11.2.13.2. Products
- 11.2.13.3. SWOT Analysis
- 11.2.13.4. Recent Developments
- 11.2.13.5. Financials (Based on Availability)
- 11.2.14 EPC
- 11.2.14.1. Overview
- 11.2.14.2. Products
- 11.2.14.3. SWOT Analysis
- 11.2.14.4. Recent Developments
- 11.2.14.5. Financials (Based on Availability)
- 11.2.15 GaN Systems
- 11.2.15.1. Overview
- 11.2.15.2. Products
- 11.2.15.3. SWOT Analysis
- 11.2.15.4. Recent Developments
- 11.2.15.5. Financials (Based on Availability)
- 11.2.16 ROHM Semiconductor
- 11.2.16.1. Overview
- 11.2.16.2. Products
- 11.2.16.3. SWOT Analysis
- 11.2.16.4. Recent Developments
- 11.2.16.5. Financials (Based on Availability)
- 11.2.17 United Monolithic Semiconductors (UMS)
- 11.2.17.1. Overview
- 11.2.17.2. Products
- 11.2.17.3. SWOT Analysis
- 11.2.17.4. Recent Developments
- 11.2.17.5. Financials (Based on Availability)
- 11.2.18 Ampleon
- 11.2.18.1. Overview
- 11.2.18.2. Products
- 11.2.18.3. SWOT Analysis
- 11.2.18.4. Recent Developments
- 11.2.18.5. Financials (Based on Availability)
- 11.2.19 Integra Technologies Inc.
- 11.2.19.1. Overview
- 11.2.19.2. Products
- 11.2.19.3. SWOT Analysis
- 11.2.19.4. Recent Developments
- 11.2.19.5. Financials (Based on Availability)
- 11.2.20 Tagore Technology
- 11.2.20.1. Overview
- 11.2.20.2. Products
- 11.2.20.3. SWOT Analysis
- 11.2.20.4. Recent Developments
- 11.2.20.5. Financials (Based on Availability)
- 11.2.21 Sainty-tech Communications
- 11.2.21.1. Overview
- 11.2.21.2. Products
- 11.2.21.3. SWOT Analysis
- 11.2.21.4. Recent Developments
- 11.2.21.5. Financials (Based on Availability)
- 11.2.22 WAVICE
- 11.2.22.1. Overview
- 11.2.22.2. Products
- 11.2.22.3. SWOT Analysis
- 11.2.22.4. Recent Developments
- 11.2.22.5. Financials (Based on Availability)
- 11.2.23 BeRex
- 11.2.23.1. Overview
- 11.2.23.2. Products
- 11.2.23.3. SWOT Analysis
- 11.2.23.4. Recent Developments
- 11.2.23.5. Financials (Based on Availability)
- 11.2.24 Inc.
- 11.2.24.1. Overview
- 11.2.24.2. Products
- 11.2.24.3. SWOT Analysis
- 11.2.24.4. Recent Developments
- 11.2.24.5. Financials (Based on Availability)
- 11.2.25 WAVEPIA
- 11.2.25.1. Overview
- 11.2.25.2. Products
- 11.2.25.3. SWOT Analysis
- 11.2.25.4. Recent Developments
- 11.2.25.5. Financials (Based on Availability)
- 11.2.26 Toshiba
- 11.2.26.1. Overview
- 11.2.26.2. Products
- 11.2.26.3. SWOT Analysis
- 11.2.26.4. Recent Developments
- 11.2.26.5. Financials (Based on Availability)
- 11.2.27 Innoscience
- 11.2.27.1. Overview
- 11.2.27.2. Products
- 11.2.27.3. SWOT Analysis
- 11.2.27.4. Recent Developments
- 11.2.27.5. Financials (Based on Availability)
- 11.2.28 CorEnergy
- 11.2.28.1. Overview
- 11.2.28.2. Products
- 11.2.28.3. SWOT Analysis
- 11.2.28.4. Recent Developments
- 11.2.28.5. Financials (Based on Availability)
- 11.2.29 Runxin Microelectronics
- 11.2.29.1. Overview
- 11.2.29.2. Products
- 11.2.29.3. SWOT Analysis
- 11.2.29.4. Recent Developments
- 11.2.29.5. Financials (Based on Availability)
- 11.2.1 Infineon Technologies
List of Figures
- Figure 1: Global GaN Power Transistors Revenue Breakdown (million, %) by Region 2025 & 2033
- Figure 2: North America GaN Power Transistors Revenue (million), by Application 2025 & 2033
- Figure 3: North America GaN Power Transistors Revenue Share (%), by Application 2025 & 2033
- Figure 4: North America GaN Power Transistors Revenue (million), by Types 2025 & 2033
- Figure 5: North America GaN Power Transistors Revenue Share (%), by Types 2025 & 2033
- Figure 6: North America GaN Power Transistors Revenue (million), by Country 2025 & 2033
- Figure 7: North America GaN Power Transistors Revenue Share (%), by Country 2025 & 2033
- Figure 8: South America GaN Power Transistors Revenue (million), by Application 2025 & 2033
- Figure 9: South America GaN Power Transistors Revenue Share (%), by Application 2025 & 2033
- Figure 10: South America GaN Power Transistors Revenue (million), by Types 2025 & 2033
- Figure 11: South America GaN Power Transistors Revenue Share (%), by Types 2025 & 2033
- Figure 12: South America GaN Power Transistors Revenue (million), by Country 2025 & 2033
- Figure 13: South America GaN Power Transistors Revenue Share (%), by Country 2025 & 2033
- Figure 14: Europe GaN Power Transistors Revenue (million), by Application 2025 & 2033
- Figure 15: Europe GaN Power Transistors Revenue Share (%), by Application 2025 & 2033
- Figure 16: Europe GaN Power Transistors Revenue (million), by Types 2025 & 2033
- Figure 17: Europe GaN Power Transistors Revenue Share (%), by Types 2025 & 2033
- Figure 18: Europe GaN Power Transistors Revenue (million), by Country 2025 & 2033
- Figure 19: Europe GaN Power Transistors Revenue Share (%), by Country 2025 & 2033
- Figure 20: Middle East & Africa GaN Power Transistors Revenue (million), by Application 2025 & 2033
- Figure 21: Middle East & Africa GaN Power Transistors Revenue Share (%), by Application 2025 & 2033
- Figure 22: Middle East & Africa GaN Power Transistors Revenue (million), by Types 2025 & 2033
- Figure 23: Middle East & Africa GaN Power Transistors Revenue Share (%), by Types 2025 & 2033
- Figure 24: Middle East & Africa GaN Power Transistors Revenue (million), by Country 2025 & 2033
- Figure 25: Middle East & Africa GaN Power Transistors Revenue Share (%), by Country 2025 & 2033
- Figure 26: Asia Pacific GaN Power Transistors Revenue (million), by Application 2025 & 2033
- Figure 27: Asia Pacific GaN Power Transistors Revenue Share (%), by Application 2025 & 2033
- Figure 28: Asia Pacific GaN Power Transistors Revenue (million), by Types 2025 & 2033
- Figure 29: Asia Pacific GaN Power Transistors Revenue Share (%), by Types 2025 & 2033
- Figure 30: Asia Pacific GaN Power Transistors Revenue (million), by Country 2025 & 2033
- Figure 31: Asia Pacific GaN Power Transistors Revenue Share (%), by Country 2025 & 2033
List of Tables
- Table 1: Global GaN Power Transistors Revenue million Forecast, by Application 2020 & 2033
- Table 2: Global GaN Power Transistors Revenue million Forecast, by Types 2020 & 2033
- Table 3: Global GaN Power Transistors Revenue million Forecast, by Region 2020 & 2033
- Table 4: Global GaN Power Transistors Revenue million Forecast, by Application 2020 & 2033
- Table 5: Global GaN Power Transistors Revenue million Forecast, by Types 2020 & 2033
- Table 6: Global GaN Power Transistors Revenue million Forecast, by Country 2020 & 2033
- Table 7: United States GaN Power Transistors Revenue (million) Forecast, by Application 2020 & 2033
- Table 8: Canada GaN Power Transistors Revenue (million) Forecast, by Application 2020 & 2033
- Table 9: Mexico GaN Power Transistors Revenue (million) Forecast, by Application 2020 & 2033
- Table 10: Global GaN Power Transistors Revenue million Forecast, by Application 2020 & 2033
- Table 11: Global GaN Power Transistors Revenue million Forecast, by Types 2020 & 2033
- Table 12: Global GaN Power Transistors Revenue million Forecast, by Country 2020 & 2033
- Table 13: Brazil GaN Power Transistors Revenue (million) Forecast, by Application 2020 & 2033
- Table 14: Argentina GaN Power Transistors Revenue (million) Forecast, by Application 2020 & 2033
- Table 15: Rest of South America GaN Power Transistors Revenue (million) Forecast, by Application 2020 & 2033
- Table 16: Global GaN Power Transistors Revenue million Forecast, by Application 2020 & 2033
- Table 17: Global GaN Power Transistors Revenue million Forecast, by Types 2020 & 2033
- Table 18: Global GaN Power Transistors Revenue million Forecast, by Country 2020 & 2033
- Table 19: United Kingdom GaN Power Transistors Revenue (million) Forecast, by Application 2020 & 2033
- Table 20: Germany GaN Power Transistors Revenue (million) Forecast, by Application 2020 & 2033
- Table 21: France GaN Power Transistors Revenue (million) Forecast, by Application 2020 & 2033
- Table 22: Italy GaN Power Transistors Revenue (million) Forecast, by Application 2020 & 2033
- Table 23: Spain GaN Power Transistors Revenue (million) Forecast, by Application 2020 & 2033
- Table 24: Russia GaN Power Transistors Revenue (million) Forecast, by Application 2020 & 2033
- Table 25: Benelux GaN Power Transistors Revenue (million) Forecast, by Application 2020 & 2033
- Table 26: Nordics GaN Power Transistors Revenue (million) Forecast, by Application 2020 & 2033
- Table 27: Rest of Europe GaN Power Transistors Revenue (million) Forecast, by Application 2020 & 2033
- Table 28: Global GaN Power Transistors Revenue million Forecast, by Application 2020 & 2033
- Table 29: Global GaN Power Transistors Revenue million Forecast, by Types 2020 & 2033
- Table 30: Global GaN Power Transistors Revenue million Forecast, by Country 2020 & 2033
- Table 31: Turkey GaN Power Transistors Revenue (million) Forecast, by Application 2020 & 2033
- Table 32: Israel GaN Power Transistors Revenue (million) Forecast, by Application 2020 & 2033
- Table 33: GCC GaN Power Transistors Revenue (million) Forecast, by Application 2020 & 2033
- Table 34: North Africa GaN Power Transistors Revenue (million) Forecast, by Application 2020 & 2033
- Table 35: South Africa GaN Power Transistors Revenue (million) Forecast, by Application 2020 & 2033
- Table 36: Rest of Middle East & Africa GaN Power Transistors Revenue (million) Forecast, by Application 2020 & 2033
- Table 37: Global GaN Power Transistors Revenue million Forecast, by Application 2020 & 2033
- Table 38: Global GaN Power Transistors Revenue million Forecast, by Types 2020 & 2033
- Table 39: Global GaN Power Transistors Revenue million Forecast, by Country 2020 & 2033
- Table 40: China GaN Power Transistors Revenue (million) Forecast, by Application 2020 & 2033
- Table 41: India GaN Power Transistors Revenue (million) Forecast, by Application 2020 & 2033
- Table 42: Japan GaN Power Transistors Revenue (million) Forecast, by Application 2020 & 2033
- Table 43: South Korea GaN Power Transistors Revenue (million) Forecast, by Application 2020 & 2033
- Table 44: ASEAN GaN Power Transistors Revenue (million) Forecast, by Application 2020 & 2033
- Table 45: Oceania GaN Power Transistors Revenue (million) Forecast, by Application 2020 & 2033
- Table 46: Rest of Asia Pacific GaN Power Transistors Revenue (million) Forecast, by Application 2020 & 2033
Frequently Asked Questions
1. What is the projected Compound Annual Growth Rate (CAGR) of the GaN Power Transistors?
The projected CAGR is approximately 35.9%.
2. Which companies are prominent players in the GaN Power Transistors?
Key companies in the market include Infineon Technologies, STMicroelectronics, Wolfspeed, Inc, NXP Semiconductors, MACOM, NXP Semiconductors, Qorvo, Transphorm, Ampleon, Microchip Technology (Microsemis), Mitsubishi Electric, RFHIC Corporation, EPC, GaN Systems, ROHM Semiconductor, United Monolithic Semiconductors (UMS), Ampleon, Integra Technologies Inc., Tagore Technology, Sainty-tech Communications, WAVICE, BeRex, Inc., WAVEPIA, Toshiba, Innoscience, CorEnergy, Runxin Microelectronics.
3. What are the main segments of the GaN Power Transistors?
The market segments include Application, Types.
4. Can you provide details about the market size?
The market size is estimated to be USD 635.1 million as of 2022.
5. What are some drivers contributing to market growth?
N/A
6. What are the notable trends driving market growth?
N/A
7. Are there any restraints impacting market growth?
N/A
8. Can you provide examples of recent developments in the market?
N/A
9. What pricing options are available for accessing the report?
Pricing options include single-user, multi-user, and enterprise licenses priced at USD 2900.00, USD 4350.00, and USD 5800.00 respectively.
10. Is the market size provided in terms of value or volume?
The market size is provided in terms of value, measured in million.
11. Are there any specific market keywords associated with the report?
Yes, the market keyword associated with the report is "GaN Power Transistors," which aids in identifying and referencing the specific market segment covered.
12. How do I determine which pricing option suits my needs best?
The pricing options vary based on user requirements and access needs. Individual users may opt for single-user licenses, while businesses requiring broader access may choose multi-user or enterprise licenses for cost-effective access to the report.
13. Are there any additional resources or data provided in the GaN Power Transistors report?
While the report offers comprehensive insights, it's advisable to review the specific contents or supplementary materials provided to ascertain if additional resources or data are available.
14. How can I stay updated on further developments or reports in the GaN Power Transistors?
To stay informed about further developments, trends, and reports in the GaN Power Transistors, consider subscribing to industry newsletters, following relevant companies and organizations, or regularly checking reputable industry news sources and publications.
Methodology
Step 1 - Identification of Relevant Samples Size from Population Database


Step 2 - Approaches for Defining Global Market Size (Value, Volume* & Price*)

Note*: In applicable scenarios
Step 3 - Data Sources
Primary Research
- Web Analytics
- Survey Reports
- Research Institute
- Latest Research Reports
- Opinion Leaders
Secondary Research
- Annual Reports
- White Paper
- Latest Press Release
- Industry Association
- Paid Database
- Investor Presentations

Step 4 - Data Triangulation
Involves using different sources of information in order to increase the validity of a study
These sources are likely to be stakeholders in a program - participants, other researchers, program staff, other community members, and so on.
Then we put all data in single framework & apply various statistical tools to find out the dynamic on the market.
During the analysis stage, feedback from the stakeholder groups would be compared to determine areas of agreement as well as areas of divergence