

Key Insights
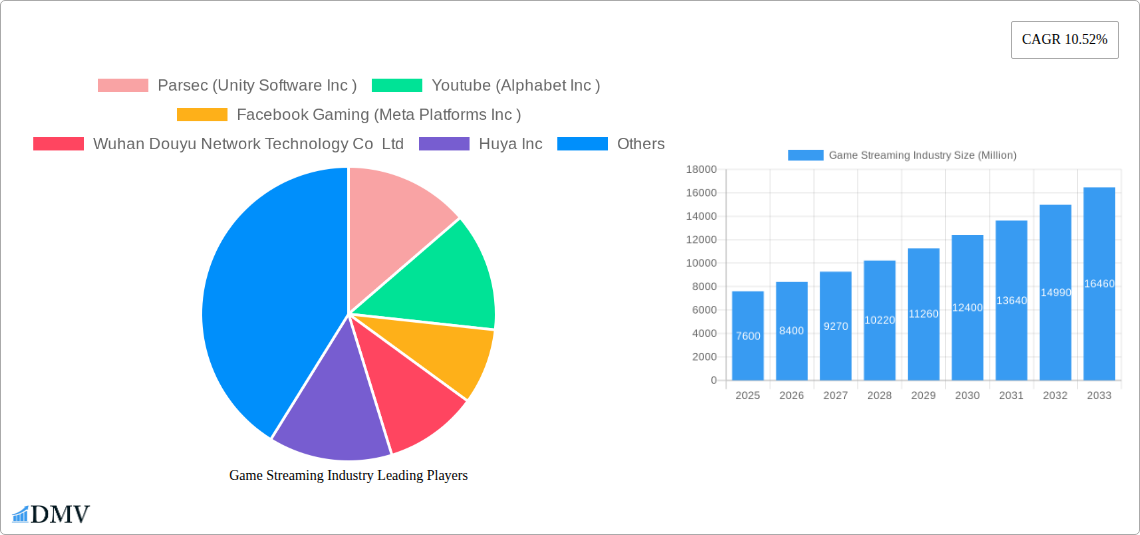
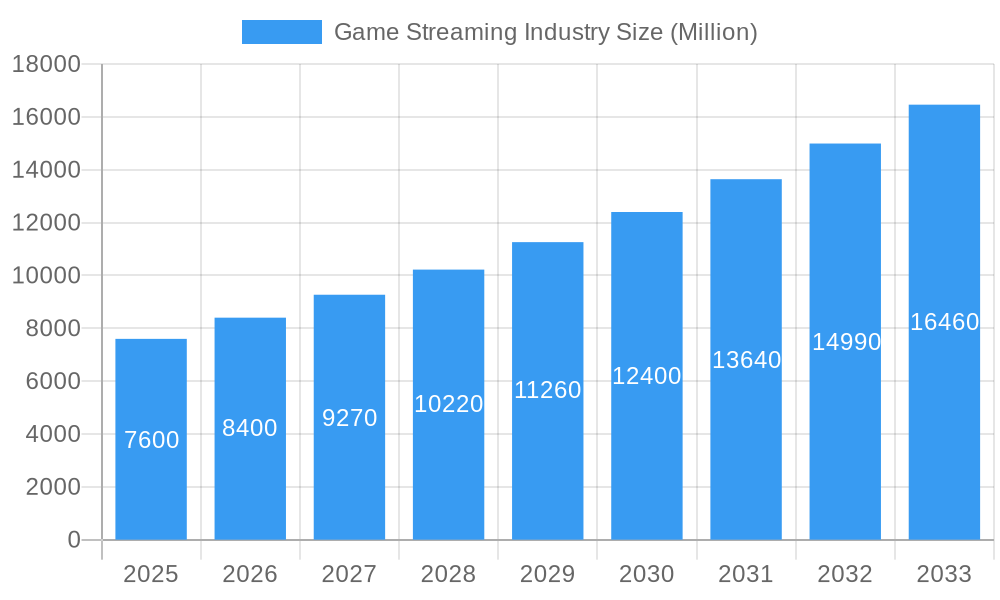
The global game streaming market, currently valued at $7.6 billion (2025 estimated), is experiencing robust growth, projected to expand at a compound annual growth rate (CAGR) of 10.52% from 2025 to 2033. This expansion is fueled by several key drivers. The increasing affordability and accessibility of high-speed internet, coupled with the rising popularity of esports and competitive gaming, are significantly broadening the market's reach. Furthermore, technological advancements in streaming platforms, offering higher resolutions and lower latency, enhance the user experience, driving adoption. The shift towards cloud gaming services, enabling gameplay on diverse devices without high-end hardware requirements, is another significant contributor. The market is segmented by revenue model (in-game advertising, subscription, and other models) and solutions (web-based and app-based). Major players like Parsec, YouTube Gaming, Facebook Gaming, Twitch, and others are aggressively competing for market share through content creation, platform enhancements, and strategic partnerships. While the market's growth is undeniable, challenges remain. These include ensuring consistent network stability and minimizing latency issues, particularly in regions with limited internet infrastructure. Competition among established and emerging players will also intensify, demanding continuous innovation and adaptation to changing user preferences.
Game Streaming Industry Market Size (In Billion)
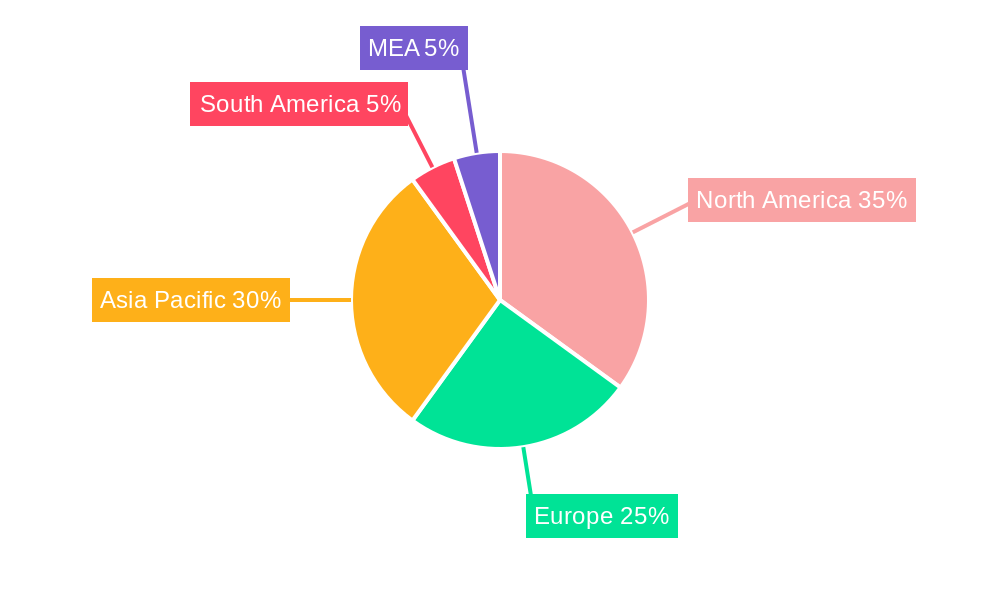
The geographical distribution of the game streaming market reflects global internet penetration rates and gaming culture. North America and Asia-Pacific currently hold significant market shares, driven by strong gaming communities and technological adoption. However, growth is expected across all regions, particularly in emerging markets with rapidly expanding internet access and increasing smartphone penetration. The increasing adoption of mobile gaming and the development of specialized game streaming apps tailored for mobile devices are fueling this growth in developing economies. Sustained investment in infrastructure improvements and the continuous improvement of streaming technology will be crucial in unlocking the full potential of the game streaming market in these regions. Future market success will depend on platform providers’ ability to offer seamless, high-quality experiences, cater to diverse gaming preferences, and address the specific needs of different geographical regions.
Game Streaming Industry Company Market Share
Game Streaming Industry Market Report: 2019-2033
This comprehensive report provides an in-depth analysis of the global game streaming market, projecting a market value exceeding $XX Million by 2033. We analyze market trends, competitive landscapes, technological advancements, and future growth opportunities across key segments and geographies. The report covers the historical period (2019-2024), base year (2025), and forecast period (2025-2033), offering valuable insights for stakeholders seeking to navigate this dynamic industry.
Game Streaming Industry Market Composition & Trends
The game streaming market exhibits a moderately consolidated structure, with key players like YouTube (Alphabet Inc), Facebook Gaming (Meta Platforms Inc), and Amazon.com Inc holding significant market share. However, the market is characterized by rapid innovation, driven by advancements in cloud computing, 5G technology, and improved streaming capabilities. Regulatory landscapes vary across regions, influencing market access and operational strategies. Substitute products, such as traditional console gaming and PC gaming, continue to compete for market share, albeit facing increasing pressure from the convenience and accessibility of game streaming. End-users primarily comprise casual and hardcore gamers across diverse age groups and demographics. The market has witnessed several significant M&A activities, with deal values exceeding $XX Million in the past five years.
- Market Share Distribution (2024): YouTube: 25%, Facebook Gaming: 18%, Amazon: 15%, Others: 42% (estimated)
- Top 3 M&A Deals (2019-2024): Deal 1: $XX Million, Deal 2: $XX Million, Deal 3: $XX Million (estimated)
- Innovation Catalysts: Cloud gaming advancements, 5G deployment, improved streaming technology.
- Regulatory Landscape: Varies significantly across regions impacting market entry and data privacy.
- Substitute Products: Traditional console and PC gaming.
Game Streaming Industry Industry Evolution
The game streaming market has experienced phenomenal growth from 2019 to 2024, with a Compound Annual Growth Rate (CAGR) of XX%. This growth trajectory is projected to continue, albeit at a slightly moderated pace, during the forecast period (2025-2033), reaching a CAGR of XX%. This evolution is fueled by several factors: increasing internet penetration and faster internet speeds, the rising affordability of high-speed internet access, and the burgeoning popularity of mobile gaming. Technological advancements, such as improved compression algorithms, low-latency streaming, and advancements in GPU technology, significantly enhance user experience and drive adoption. Furthermore, shifting consumer demands towards on-demand entertainment and cross-platform accessibility further stimulate market expansion. The adoption rate of game streaming services has increased by XX% annually since 2019, reaching XX% market penetration in 2024. Future growth is contingent on overcoming challenges like network latency issues, data caps, and competition from established gaming platforms.
Leading Regions, Countries, or Segments in Game Streaming Industry
North America currently dominates the global game streaming market, driven by high internet penetration, strong consumer spending on entertainment, and the presence of major industry players. Asia-Pacific is poised for significant growth due to its expanding mobile gaming market and growing internet user base.
- By Revenue Model: The subscription model holds the largest market share, owing to its predictable revenue streams and user loyalty. The in-game advertising model is also gaining traction, especially among free-to-play games.
- By Solutions: Web-based solutions currently dominate, offering greater accessibility, however, app-based solutions are growing rapidly due to enhanced user experience and platform-specific features.
- Key Drivers (North America): High internet penetration, strong consumer spending, established player presence, supportive regulatory environment.
- Key Drivers (Asia-Pacific): Rapid growth of mobile gaming, increasing internet users, growing disposable income.
Game Streaming Industry Product Innovations
Recent innovations in game streaming focus on enhancing visual fidelity, reducing latency, and broadening platform compatibility. Advancements in cloud computing, AI-powered game optimization, and adaptive bitrate streaming significantly improve the user experience. Unique selling propositions include cross-platform play, seamless integration with social media, and personalized gaming experiences.
Propelling Factors for Game Streaming Industry Growth
The game streaming industry's growth is fueled by several factors. Firstly, technological advancements, including improvements in cloud computing infrastructure and 5G networks, are enabling higher-quality streaming experiences with lower latency. Secondly, increasing internet penetration and affordability are widening access to game streaming services. Thirdly, favorable regulatory environments in several regions are facilitating industry expansion.
Obstacles in the Game Streaming Industry Market
Several factors could impede growth. Network latency and bandwidth limitations can hinder streaming quality, impacting user experience. High-speed internet access remains uneven globally, limiting market penetration. Finally, intense competition from established gaming platforms and the emergence of new entrants poses a continuous challenge. The total impact of these challenges is estimated at a XX% reduction in potential market growth.
Future Opportunities in Game Streaming Industry
Future opportunities lie in expanding into untapped markets, particularly in developing economies. Technological advancements, such as virtual reality (VR) and augmented reality (AR) integration, offer exciting potential. Finally, the growing trend towards cloud-based gaming subscriptions presents a major avenue for market expansion.
Major Players in the Game Streaming Industry Ecosystem
- Parsec (Unity Software Inc)
- YouTube (Alphabet Inc)
- Facebook Gaming (Meta Platforms Inc)
- Wuhan Douyu Network Technology Co Ltd
- Huya Inc
- Amazon.com Inc
- Nvidia Corporation
- Sony Group Corporation
- Apple Inc
- Afreecatv Co Ltd
Key Developments in Game Streaming Industry Industry
- November 2023: Sony partnered with NCSoft to develop and release mobile games, expanding its reach beyond consoles.
- August 2023: GeForce NOW launched the Ultimate KovvaK's challenge, improving gamer aim and leveraging its GPU technology.
Strategic Game Streaming Industry Market Forecast
The game streaming market is poised for continued expansion, driven by technological innovation, increasing internet penetration, and growing consumer demand for convenient and accessible gaming experiences. Future opportunities in cloud gaming, VR/AR integration, and expansion into new markets will shape the industry's trajectory in the coming years. The market's growth will be influenced by factors like technological advancements, regulatory changes, and the ongoing competition among key players.
Game Streaming Industry Segmentation
-
1. Revenue Model
- 1.1. In-game Advertising Model
- 1.2. Subscription Model
- 1.3. Other Revenue Models
-
2. Solutions
-
2.1. Web Based
- 2.1.1. Twitch
- 2.1.2. YouTube
- 2.1.3. Mixer
- 2.1.4. Facebook
- 2.1.5. Dailymotion
-
2.2. App Based
- 2.2.1. Xbox Game Streaming
- 2.2.2. Remotr
- 2.2.3. Steam Link
- 2.2.4. Rainway Inc
- 2.2.5. Others
-
2.1. Web Based
Game Streaming Industry Segmentation By Geography
-
1. North America
- 1.1. United States
- 1.2. Canada
-
2. Europe
- 2.1. Germany
- 2.2. United Kingdom
-
3. Asia Pacific
- 3.1. China
- 3.2. Japan
- 3.3. India
- 3.4. South Korea
- 3.5. Australia and New Zealand
- 4. Latin America
- 5. Middle East and Africa
Game Streaming Industry Regional Market Share
Geographic Coverage of Game Streaming Industry
Game Streaming Industry REPORT HIGHLIGHTS
| Aspects | Details |
|---|---|
| Study Period | 2020-2034 |
| Base Year | 2025 |
| Estimated Year | 2026 |
| Forecast Period | 2026-2034 |
| Historical Period | 2020-2025 |
| Growth Rate | CAGR of 10.52% from 2020-2034 |
| Segmentation |
|
Table of Contents
- 1. Introduction
- 1.1. Research Scope
- 1.2. Market Segmentation
- 1.3. Research Objective
- 1.4. Definitions and Assumptions
- 2. Executive Summary
- 2.1. Market Snapshot
- 3. Market Dynamics
- 3.1. Market Drivers
- 3.2. Market Restrains
- 3.3. Market Trends
- 3.4. Market Opportunities
- 4. Market Factor Analysis
- 4.1. Porters Five Forces
- 4.1.1. Bargaining Power of Suppliers
- 4.1.2. Bargaining Power of Buyers
- 4.1.3. Threat of New Entrants
- 4.1.4. Threat of Substitutes
- 4.1.5. Competitive Rivalry
- 4.2. PESTEL analysis
- 4.3. BCG Analysis
- 4.3.1. Stars (High Growth, High Market Share)
- 4.3.2. Cash Cows (Low Growth, High Market Share)
- 4.3.3. Question Mark (High Growth, Low Market Share)
- 4.3.4. Dogs (Low Growth, Low Market Share)
- 4.4. Ansoff Matrix Analysis
- 4.5. Supply Chain Analysis
- 4.6. Regulatory Landscape
- 4.7. Current Market Potential and Opportunity Assessment (TAM–SAM–SOM Framework)
- 4.8. DMV Analyst Note
- 4.1. Porters Five Forces
- 5. Market Analysis, Insights and Forecast 2021-2033
- 5.1. Market Analysis, Insights and Forecast - by Revenue Model
- 5.1.1. In-game Advertising Model
- 5.1.2. Subscription Model
- 5.1.3. Other Revenue Models
- 5.2. Market Analysis, Insights and Forecast - by Solutions
- 5.2.1. Web Based
- 5.2.1.1. Twitch
- 5.2.1.2. YouTube
- 5.2.1.3. Mixer
- 5.2.1.4. Facebook
- 5.2.1.5. Dailymotion
- 5.2.2. App Based
- 5.2.2.1. Xbox Game Streaming
- 5.2.2.2. Remotr
- 5.2.2.3. Steam Link
- 5.2.2.4. Rainway Inc
- 5.2.2.5. Others
- 5.2.1. Web Based
- 5.3. Market Analysis, Insights and Forecast - by Region
- 5.3.1. North America
- 5.3.2. Europe
- 5.3.3. Asia Pacific
- 5.3.4. Latin America
- 5.3.5. Middle East and Africa
- 5.1. Market Analysis, Insights and Forecast - by Revenue Model
- 6. Global Game Streaming Industry Analysis, Insights and Forecast, 2021-2033
- 6.1. Market Analysis, Insights and Forecast - by Revenue Model
- 6.1.1. In-game Advertising Model
- 6.1.2. Subscription Model
- 6.1.3. Other Revenue Models
- 6.2. Market Analysis, Insights and Forecast - by Solutions
- 6.2.1. Web Based
- 6.2.1.1. Twitch
- 6.2.1.2. YouTube
- 6.2.1.3. Mixer
- 6.2.1.4. Facebook
- 6.2.1.5. Dailymotion
- 6.2.2. App Based
- 6.2.2.1. Xbox Game Streaming
- 6.2.2.2. Remotr
- 6.2.2.3. Steam Link
- 6.2.2.4. Rainway Inc
- 6.2.2.5. Others
- 6.2.1. Web Based
- 6.1. Market Analysis, Insights and Forecast - by Revenue Model
- 7. North America Game Streaming Industry Analysis, Insights and Forecast, 2020-2032
- 7.1. Market Analysis, Insights and Forecast - by Revenue Model
- 7.1.1. In-game Advertising Model
- 7.1.2. Subscription Model
- 7.1.3. Other Revenue Models
- 7.2. Market Analysis, Insights and Forecast - by Solutions
- 7.2.1. Web Based
- 7.2.1.1. Twitch
- 7.2.1.2. YouTube
- 7.2.1.3. Mixer
- 7.2.1.4. Facebook
- 7.2.1.5. Dailymotion
- 7.2.2. App Based
- 7.2.2.1. Xbox Game Streaming
- 7.2.2.2. Remotr
- 7.2.2.3. Steam Link
- 7.2.2.4. Rainway Inc
- 7.2.2.5. Others
- 7.2.1. Web Based
- 7.1. Market Analysis, Insights and Forecast - by Revenue Model
- 8. Europe Game Streaming Industry Analysis, Insights and Forecast, 2020-2032
- 8.1. Market Analysis, Insights and Forecast - by Revenue Model
- 8.1.1. In-game Advertising Model
- 8.1.2. Subscription Model
- 8.1.3. Other Revenue Models
- 8.2. Market Analysis, Insights and Forecast - by Solutions
- 8.2.1. Web Based
- 8.2.1.1. Twitch
- 8.2.1.2. YouTube
- 8.2.1.3. Mixer
- 8.2.1.4. Facebook
- 8.2.1.5. Dailymotion
- 8.2.2. App Based
- 8.2.2.1. Xbox Game Streaming
- 8.2.2.2. Remotr
- 8.2.2.3. Steam Link
- 8.2.2.4. Rainway Inc
- 8.2.2.5. Others
- 8.2.1. Web Based
- 8.1. Market Analysis, Insights and Forecast - by Revenue Model
- 9. Asia Pacific Game Streaming Industry Analysis, Insights and Forecast, 2020-2032
- 9.1. Market Analysis, Insights and Forecast - by Revenue Model
- 9.1.1. In-game Advertising Model
- 9.1.2. Subscription Model
- 9.1.3. Other Revenue Models
- 9.2. Market Analysis, Insights and Forecast - by Solutions
- 9.2.1. Web Based
- 9.2.1.1. Twitch
- 9.2.1.2. YouTube
- 9.2.1.3. Mixer
- 9.2.1.4. Facebook
- 9.2.1.5. Dailymotion
- 9.2.2. App Based
- 9.2.2.1. Xbox Game Streaming
- 9.2.2.2. Remotr
- 9.2.2.3. Steam Link
- 9.2.2.4. Rainway Inc
- 9.2.2.5. Others
- 9.2.1. Web Based
- 9.1. Market Analysis, Insights and Forecast - by Revenue Model
- 10. Latin America Game Streaming Industry Analysis, Insights and Forecast, 2020-2032
- 10.1. Market Analysis, Insights and Forecast - by Revenue Model
- 10.1.1. In-game Advertising Model
- 10.1.2. Subscription Model
- 10.1.3. Other Revenue Models
- 10.2. Market Analysis, Insights and Forecast - by Solutions
- 10.2.1. Web Based
- 10.2.1.1. Twitch
- 10.2.1.2. YouTube
- 10.2.1.3. Mixer
- 10.2.1.4. Facebook
- 10.2.1.5. Dailymotion
- 10.2.2. App Based
- 10.2.2.1. Xbox Game Streaming
- 10.2.2.2. Remotr
- 10.2.2.3. Steam Link
- 10.2.2.4. Rainway Inc
- 10.2.2.5. Others
- 10.2.1. Web Based
- 10.1. Market Analysis, Insights and Forecast - by Revenue Model
- 11. Middle East and Africa Game Streaming Industry Analysis, Insights and Forecast, 2020-2032
- 11.1. Market Analysis, Insights and Forecast - by Revenue Model
- 11.1.1. In-game Advertising Model
- 11.1.2. Subscription Model
- 11.1.3. Other Revenue Models
- 11.2. Market Analysis, Insights and Forecast - by Solutions
- 11.2.1. Web Based
- 11.2.1.1. Twitch
- 11.2.1.2. YouTube
- 11.2.1.3. Mixer
- 11.2.1.4. Facebook
- 11.2.1.5. Dailymotion
- 11.2.2. App Based
- 11.2.2.1. Xbox Game Streaming
- 11.2.2.2. Remotr
- 11.2.2.3. Steam Link
- 11.2.2.4. Rainway Inc
- 11.2.2.5. Others
- 11.2.1. Web Based
- 11.1. Market Analysis, Insights and Forecast - by Revenue Model
- 12. Competitive Analysis
- 12.1. Company Profiles
- 12.1.1 Parsec (Unity Software Inc )
- 12.1.1.1. Company Overview
- 12.1.1.2. Products
- 12.1.1.3. Company Financials
- 12.1.1.4. SWOT Analysis
- 12.1.2 Youtube (Alphabet Inc )
- 12.1.2.1. Company Overview
- 12.1.2.2. Products
- 12.1.2.3. Company Financials
- 12.1.2.4. SWOT Analysis
- 12.1.3 Facebook Gaming (Meta Platforms Inc )
- 12.1.3.1. Company Overview
- 12.1.3.2. Products
- 12.1.3.3. Company Financials
- 12.1.3.4. SWOT Analysis
- 12.1.4 Wuhan Douyu Network Technology Co Ltd
- 12.1.4.1. Company Overview
- 12.1.4.2. Products
- 12.1.4.3. Company Financials
- 12.1.4.4. SWOT Analysis
- 12.1.5 Huya Inc
- 12.1.5.1. Company Overview
- 12.1.5.2. Products
- 12.1.5.3. Company Financials
- 12.1.5.4. SWOT Analysis
- 12.1.6 Amazon com Inc
- 12.1.6.1. Company Overview
- 12.1.6.2. Products
- 12.1.6.3. Company Financials
- 12.1.6.4. SWOT Analysis
- 12.1.7 Nvidia Corporation
- 12.1.7.1. Company Overview
- 12.1.7.2. Products
- 12.1.7.3. Company Financials
- 12.1.7.4. SWOT Analysis
- 12.1.8 Sony Group Corporatio
- 12.1.8.1. Company Overview
- 12.1.8.2. Products
- 12.1.8.3. Company Financials
- 12.1.8.4. SWOT Analysis
- 12.1.9 Apple Inc
- 12.1.9.1. Company Overview
- 12.1.9.2. Products
- 12.1.9.3. Company Financials
- 12.1.9.4. SWOT Analysis
- 12.1.10 Afreecatv Co Ltd
- 12.1.10.1. Company Overview
- 12.1.10.2. Products
- 12.1.10.3. Company Financials
- 12.1.10.4. SWOT Analysis
- 12.1.1 Parsec (Unity Software Inc )
- 12.2. Market Entropy
- 12.2.1 Company's Key Areas Served
- 12.2.2 Recent Developments
- 12.3. Company Market Share Analysis 2025
- 12.3.1 Top 5 Companies Market Share Analysis
- 12.3.2 Top 3 Companies Market Share Analysis
- 12.4. List of Potential Customers
- 13. Research Methodology
List of Figures
- Figure 1: Global Game Streaming Industry Revenue Breakdown (Million, %) by Region 2025 & 2033
- Figure 2: Global Game Streaming Industry Volume Breakdown (K Unit, %) by Region 2025 & 2033
- Figure 3: North America Game Streaming Industry Revenue (Million), by Revenue Model 2025 & 2033
- Figure 4: North America Game Streaming Industry Volume (K Unit), by Revenue Model 2025 & 2033
- Figure 5: North America Game Streaming Industry Revenue Share (%), by Revenue Model 2025 & 2033
- Figure 6: North America Game Streaming Industry Volume Share (%), by Revenue Model 2025 & 2033
- Figure 7: North America Game Streaming Industry Revenue (Million), by Solutions 2025 & 2033
- Figure 8: North America Game Streaming Industry Volume (K Unit), by Solutions 2025 & 2033
- Figure 9: North America Game Streaming Industry Revenue Share (%), by Solutions 2025 & 2033
- Figure 10: North America Game Streaming Industry Volume Share (%), by Solutions 2025 & 2033
- Figure 11: North America Game Streaming Industry Revenue (Million), by Country 2025 & 2033
- Figure 12: North America Game Streaming Industry Volume (K Unit), by Country 2025 & 2033
- Figure 13: North America Game Streaming Industry Revenue Share (%), by Country 2025 & 2033
- Figure 14: North America Game Streaming Industry Volume Share (%), by Country 2025 & 2033
- Figure 15: Europe Game Streaming Industry Revenue (Million), by Revenue Model 2025 & 2033
- Figure 16: Europe Game Streaming Industry Volume (K Unit), by Revenue Model 2025 & 2033
- Figure 17: Europe Game Streaming Industry Revenue Share (%), by Revenue Model 2025 & 2033
- Figure 18: Europe Game Streaming Industry Volume Share (%), by Revenue Model 2025 & 2033
- Figure 19: Europe Game Streaming Industry Revenue (Million), by Solutions 2025 & 2033
- Figure 20: Europe Game Streaming Industry Volume (K Unit), by Solutions 2025 & 2033
- Figure 21: Europe Game Streaming Industry Revenue Share (%), by Solutions 2025 & 2033
- Figure 22: Europe Game Streaming Industry Volume Share (%), by Solutions 2025 & 2033
- Figure 23: Europe Game Streaming Industry Revenue (Million), by Country 2025 & 2033
- Figure 24: Europe Game Streaming Industry Volume (K Unit), by Country 2025 & 2033
- Figure 25: Europe Game Streaming Industry Revenue Share (%), by Country 2025 & 2033
- Figure 26: Europe Game Streaming Industry Volume Share (%), by Country 2025 & 2033
- Figure 27: Asia Pacific Game Streaming Industry Revenue (Million), by Revenue Model 2025 & 2033
- Figure 28: Asia Pacific Game Streaming Industry Volume (K Unit), by Revenue Model 2025 & 2033
- Figure 29: Asia Pacific Game Streaming Industry Revenue Share (%), by Revenue Model 2025 & 2033
- Figure 30: Asia Pacific Game Streaming Industry Volume Share (%), by Revenue Model 2025 & 2033
- Figure 31: Asia Pacific Game Streaming Industry Revenue (Million), by Solutions 2025 & 2033
- Figure 32: Asia Pacific Game Streaming Industry Volume (K Unit), by Solutions 2025 & 2033
- Figure 33: Asia Pacific Game Streaming Industry Revenue Share (%), by Solutions 2025 & 2033
- Figure 34: Asia Pacific Game Streaming Industry Volume Share (%), by Solutions 2025 & 2033
- Figure 35: Asia Pacific Game Streaming Industry Revenue (Million), by Country 2025 & 2033
- Figure 36: Asia Pacific Game Streaming Industry Volume (K Unit), by Country 2025 & 2033
- Figure 37: Asia Pacific Game Streaming Industry Revenue Share (%), by Country 2025 & 2033
- Figure 38: Asia Pacific Game Streaming Industry Volume Share (%), by Country 2025 & 2033
- Figure 39: Latin America Game Streaming Industry Revenue (Million), by Revenue Model 2025 & 2033
- Figure 40: Latin America Game Streaming Industry Volume (K Unit), by Revenue Model 2025 & 2033
- Figure 41: Latin America Game Streaming Industry Revenue Share (%), by Revenue Model 2025 & 2033
- Figure 42: Latin America Game Streaming Industry Volume Share (%), by Revenue Model 2025 & 2033
- Figure 43: Latin America Game Streaming Industry Revenue (Million), by Solutions 2025 & 2033
- Figure 44: Latin America Game Streaming Industry Volume (K Unit), by Solutions 2025 & 2033
- Figure 45: Latin America Game Streaming Industry Revenue Share (%), by Solutions 2025 & 2033
- Figure 46: Latin America Game Streaming Industry Volume Share (%), by Solutions 2025 & 2033
- Figure 47: Latin America Game Streaming Industry Revenue (Million), by Country 2025 & 2033
- Figure 48: Latin America Game Streaming Industry Volume (K Unit), by Country 2025 & 2033
- Figure 49: Latin America Game Streaming Industry Revenue Share (%), by Country 2025 & 2033
- Figure 50: Latin America Game Streaming Industry Volume Share (%), by Country 2025 & 2033
- Figure 51: Middle East and Africa Game Streaming Industry Revenue (Million), by Revenue Model 2025 & 2033
- Figure 52: Middle East and Africa Game Streaming Industry Volume (K Unit), by Revenue Model 2025 & 2033
- Figure 53: Middle East and Africa Game Streaming Industry Revenue Share (%), by Revenue Model 2025 & 2033
- Figure 54: Middle East and Africa Game Streaming Industry Volume Share (%), by Revenue Model 2025 & 2033
- Figure 55: Middle East and Africa Game Streaming Industry Revenue (Million), by Solutions 2025 & 2033
- Figure 56: Middle East and Africa Game Streaming Industry Volume (K Unit), by Solutions 2025 & 2033
- Figure 57: Middle East and Africa Game Streaming Industry Revenue Share (%), by Solutions 2025 & 2033
- Figure 58: Middle East and Africa Game Streaming Industry Volume Share (%), by Solutions 2025 & 2033
- Figure 59: Middle East and Africa Game Streaming Industry Revenue (Million), by Country 2025 & 2033
- Figure 60: Middle East and Africa Game Streaming Industry Volume (K Unit), by Country 2025 & 2033
- Figure 61: Middle East and Africa Game Streaming Industry Revenue Share (%), by Country 2025 & 2033
- Figure 62: Middle East and Africa Game Streaming Industry Volume Share (%), by Country 2025 & 2033
List of Tables
- Table 1: Global Game Streaming Industry Revenue Million Forecast, by Revenue Model 2020 & 2033
- Table 2: Global Game Streaming Industry Volume K Unit Forecast, by Revenue Model 2020 & 2033
- Table 3: Global Game Streaming Industry Revenue Million Forecast, by Solutions 2020 & 2033
- Table 4: Global Game Streaming Industry Volume K Unit Forecast, by Solutions 2020 & 2033
- Table 5: Global Game Streaming Industry Revenue Million Forecast, by Region 2020 & 2033
- Table 6: Global Game Streaming Industry Volume K Unit Forecast, by Region 2020 & 2033
- Table 7: Global Game Streaming Industry Revenue Million Forecast, by Revenue Model 2020 & 2033
- Table 8: Global Game Streaming Industry Volume K Unit Forecast, by Revenue Model 2020 & 2033
- Table 9: Global Game Streaming Industry Revenue Million Forecast, by Solutions 2020 & 2033
- Table 10: Global Game Streaming Industry Volume K Unit Forecast, by Solutions 2020 & 2033
- Table 11: Global Game Streaming Industry Revenue Million Forecast, by Country 2020 & 2033
- Table 12: Global Game Streaming Industry Volume K Unit Forecast, by Country 2020 & 2033
- Table 13: United States Game Streaming Industry Revenue (Million) Forecast, by Application 2020 & 2033
- Table 14: United States Game Streaming Industry Volume (K Unit) Forecast, by Application 2020 & 2033
- Table 15: Canada Game Streaming Industry Revenue (Million) Forecast, by Application 2020 & 2033
- Table 16: Canada Game Streaming Industry Volume (K Unit) Forecast, by Application 2020 & 2033
- Table 17: Global Game Streaming Industry Revenue Million Forecast, by Revenue Model 2020 & 2033
- Table 18: Global Game Streaming Industry Volume K Unit Forecast, by Revenue Model 2020 & 2033
- Table 19: Global Game Streaming Industry Revenue Million Forecast, by Solutions 2020 & 2033
- Table 20: Global Game Streaming Industry Volume K Unit Forecast, by Solutions 2020 & 2033
- Table 21: Global Game Streaming Industry Revenue Million Forecast, by Country 2020 & 2033
- Table 22: Global Game Streaming Industry Volume K Unit Forecast, by Country 2020 & 2033
- Table 23: Germany Game Streaming Industry Revenue (Million) Forecast, by Application 2020 & 2033
- Table 24: Germany Game Streaming Industry Volume (K Unit) Forecast, by Application 2020 & 2033
- Table 25: United Kingdom Game Streaming Industry Revenue (Million) Forecast, by Application 2020 & 2033
- Table 26: United Kingdom Game Streaming Industry Volume (K Unit) Forecast, by Application 2020 & 2033
- Table 27: Global Game Streaming Industry Revenue Million Forecast, by Revenue Model 2020 & 2033
- Table 28: Global Game Streaming Industry Volume K Unit Forecast, by Revenue Model 2020 & 2033
- Table 29: Global Game Streaming Industry Revenue Million Forecast, by Solutions 2020 & 2033
- Table 30: Global Game Streaming Industry Volume K Unit Forecast, by Solutions 2020 & 2033
- Table 31: Global Game Streaming Industry Revenue Million Forecast, by Country 2020 & 2033
- Table 32: Global Game Streaming Industry Volume K Unit Forecast, by Country 2020 & 2033
- Table 33: China Game Streaming Industry Revenue (Million) Forecast, by Application 2020 & 2033
- Table 34: China Game Streaming Industry Volume (K Unit) Forecast, by Application 2020 & 2033
- Table 35: Japan Game Streaming Industry Revenue (Million) Forecast, by Application 2020 & 2033
- Table 36: Japan Game Streaming Industry Volume (K Unit) Forecast, by Application 2020 & 2033
- Table 37: India Game Streaming Industry Revenue (Million) Forecast, by Application 2020 & 2033
- Table 38: India Game Streaming Industry Volume (K Unit) Forecast, by Application 2020 & 2033
- Table 39: South Korea Game Streaming Industry Revenue (Million) Forecast, by Application 2020 & 2033
- Table 40: South Korea Game Streaming Industry Volume (K Unit) Forecast, by Application 2020 & 2033
- Table 41: Australia and New Zealand Game Streaming Industry Revenue (Million) Forecast, by Application 2020 & 2033
- Table 42: Australia and New Zealand Game Streaming Industry Volume (K Unit) Forecast, by Application 2020 & 2033
- Table 43: Global Game Streaming Industry Revenue Million Forecast, by Revenue Model 2020 & 2033
- Table 44: Global Game Streaming Industry Volume K Unit Forecast, by Revenue Model 2020 & 2033
- Table 45: Global Game Streaming Industry Revenue Million Forecast, by Solutions 2020 & 2033
- Table 46: Global Game Streaming Industry Volume K Unit Forecast, by Solutions 2020 & 2033
- Table 47: Global Game Streaming Industry Revenue Million Forecast, by Country 2020 & 2033
- Table 48: Global Game Streaming Industry Volume K Unit Forecast, by Country 2020 & 2033
- Table 49: Global Game Streaming Industry Revenue Million Forecast, by Revenue Model 2020 & 2033
- Table 50: Global Game Streaming Industry Volume K Unit Forecast, by Revenue Model 2020 & 2033
- Table 51: Global Game Streaming Industry Revenue Million Forecast, by Solutions 2020 & 2033
- Table 52: Global Game Streaming Industry Volume K Unit Forecast, by Solutions 2020 & 2033
- Table 53: Global Game Streaming Industry Revenue Million Forecast, by Country 2020 & 2033
- Table 54: Global Game Streaming Industry Volume K Unit Forecast, by Country 2020 & 2033
Frequently Asked Questions
1. What is the projected Compound Annual Growth Rate (CAGR) of the Game Streaming Industry?
The projected CAGR is approximately 10.52%.
2. Which companies are prominent players in the Game Streaming Industry?
Key companies in the market include Parsec (Unity Software Inc ), Youtube (Alphabet Inc ), Facebook Gaming (Meta Platforms Inc ), Wuhan Douyu Network Technology Co Ltd, Huya Inc, Amazon com Inc, Nvidia Corporation, Sony Group Corporatio, Apple Inc, Afreecatv Co Ltd.
3. What are the main segments of the Game Streaming Industry?
The market segments include Revenue Model, Solutions.
4. Can you provide details about the market size?
The market size is estimated to be USD 7.60 Million as of 2022.
5. What are some drivers contributing to market growth?
Growing Popularity of Esports and Broadcasting of Esports Events; Growth of Video Game Streaming Software for Mobile Devices.
6. What are the notable trends driving market growth?
YouTube to be the Largest Web-based Solution.
7. Are there any restraints impacting market growth?
High Cost of Content Creation.
8. Can you provide examples of recent developments in the market?
November 2023 - Sony partnered with NCSoft to have a notable role in developing and releasing these mobile games to expand beyond the console and broaden PlayStation's reach to a broader audience, which can support the company's growth in the future.
9. What pricing options are available for accessing the report?
Pricing options include single-user, multi-user, and enterprise licenses priced at USD 4750, USD 5250, and USD 8750 respectively.
10. Is the market size provided in terms of value or volume?
The market size is provided in terms of value, measured in Million and volume, measured in K Unit.
11. Are there any specific market keywords associated with the report?
Yes, the market keyword associated with the report is "Game Streaming Industry," which aids in identifying and referencing the specific market segment covered.
12. How do I determine which pricing option suits my needs best?
The pricing options vary based on user requirements and access needs. Individual users may opt for single-user licenses, while businesses requiring broader access may choose multi-user or enterprise licenses for cost-effective access to the report.
13. Are there any additional resources or data provided in the Game Streaming Industry report?
While the report offers comprehensive insights, it's advisable to review the specific contents or supplementary materials provided to ascertain if additional resources or data are available.
14. How can I stay updated on further developments or reports in the Game Streaming Industry?
To stay informed about further developments, trends, and reports in the Game Streaming Industry, consider subscribing to industry newsletters, following relevant companies and organizations, or regularly checking reputable industry news sources and publications.
Methodology
Step 1 - Identification of Relevant Samples Size from Population Database


Step 2 - Approaches for Defining Global Market Size (Value, Volume* & Price*)

Note*: In applicable scenarios
Step 3 - Data Sources
Primary Research
- Web Analytics
- Survey Reports
- Research Institute
- Latest Research Reports
- Opinion Leaders
Secondary Research
- Annual Reports
- White Paper
- Latest Press Release
- Industry Association
- Paid Database
- Investor Presentations

Step 4 - Data Triangulation
Involves using different sources of information in order to increase the validity of a study
These sources are likely to be stakeholders in a program - participants, other researchers, program staff, other community members, and so on.
Then we put all data in single framework & apply various statistical tools to find out the dynamic on the market.
During the analysis stage, feedback from the stakeholder groups would be compared to determine areas of agreement as well as areas of divergence