

Key Insights
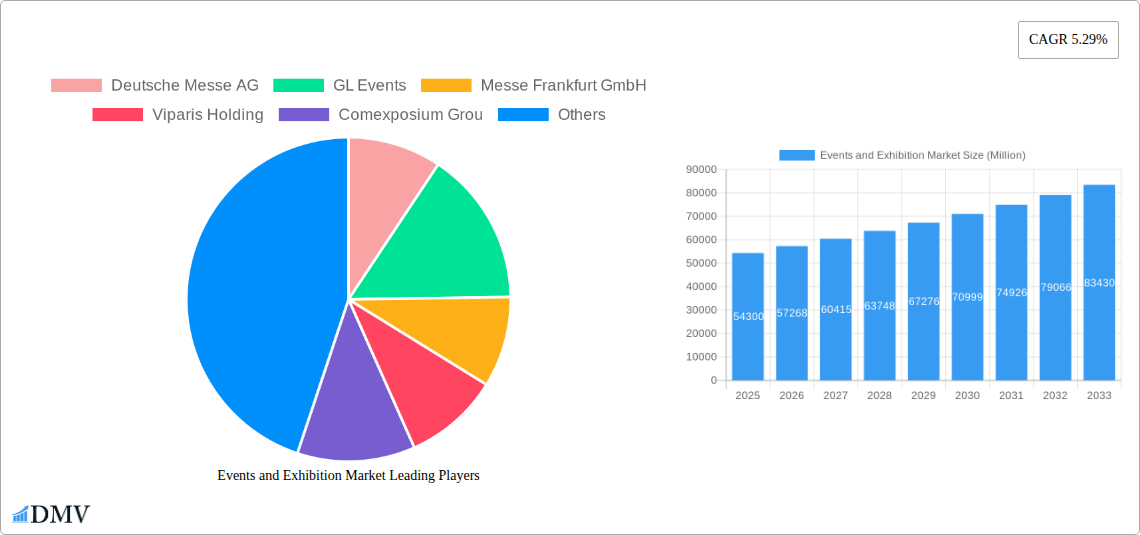
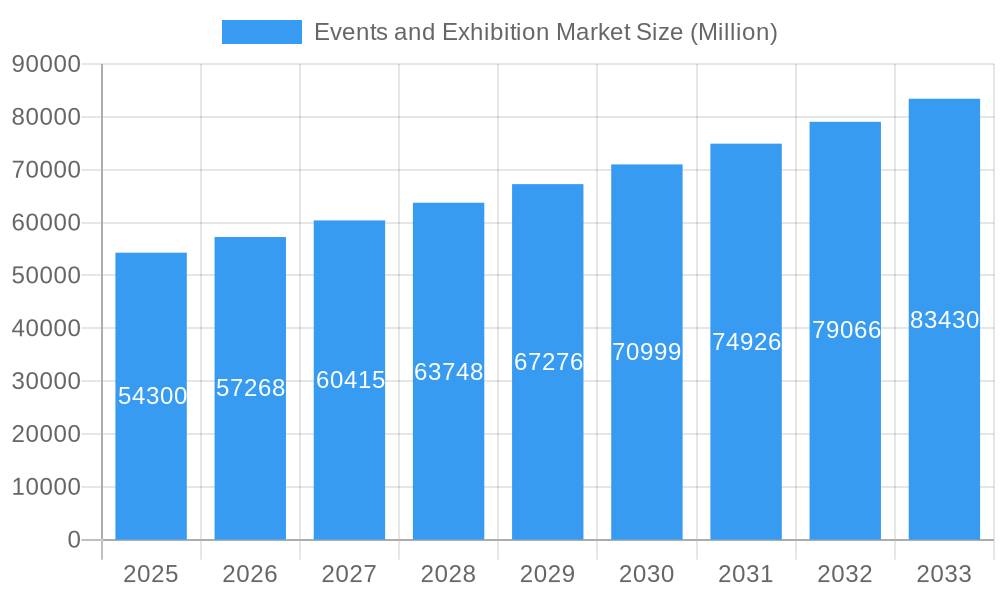
The global events and exhibition market, valued at $54.30 billion in 2025, is projected to experience robust growth, driven by a compound annual growth rate (CAGR) of 5.29% from 2025 to 2033. This expansion is fueled by several key factors. The increasing adoption of hybrid and virtual event formats caters to broader audiences and reduces geographical limitations, boosting participation and revenue streams. Furthermore, the growing need for businesses to network, launch products, and engage with customers directly fuels demand for B2B and B2C exhibitions across diverse sectors. The consumer goods and retail, automotive, and industrial sectors are significant contributors, with continued growth expected in entertainment, real estate, and hospitality events. Strong sponsorship and exhibitor fees, alongside entrance fees and ancillary services, contribute to the market's overall value. Geographic expansion, particularly in developing economies of Asia-Pacific and South America, presents significant untapped potential for future growth. However, challenges such as economic downturns, evolving consumer preferences, and the need for continuous innovation in event formats will influence the market's trajectory. Competition among major players like Deutsche Messe AG, GL Events, and Messe Frankfurt GmbH is intensifying, demanding strategic adaptations and technological advancements to maintain market share and profitability.
Events and Exhibition Market Market Size (In Billion)
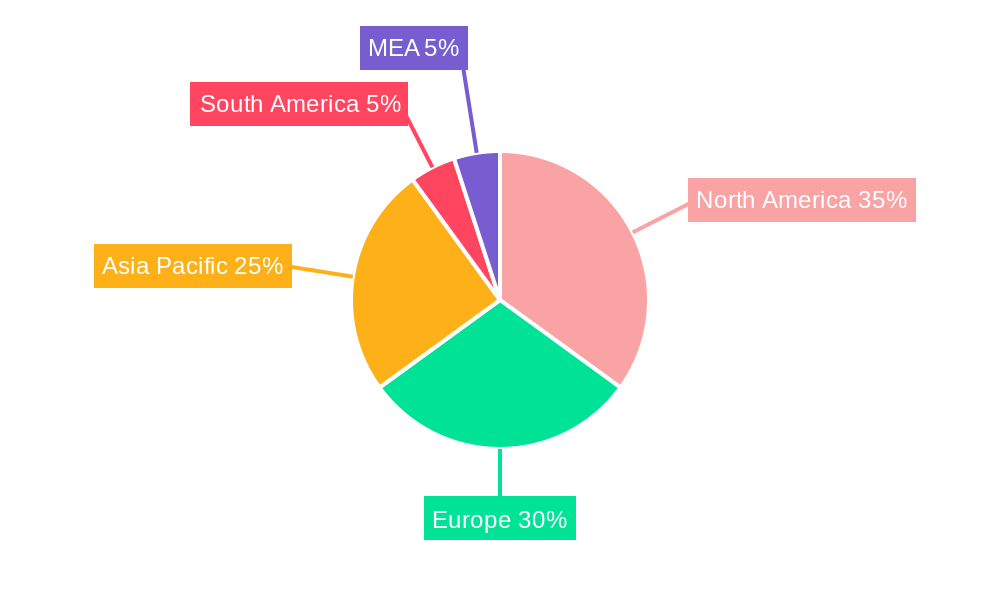
The market segmentation offers valuable insights into growth dynamics. While B2B events remain a significant segment, the rise of B2C and hybrid models demonstrates shifting preferences. Revenue diversification through sponsorship, entrance fees, and value-added services contributes to market resilience. Regionally, North America and Europe currently dominate, yet Asia-Pacific's rapid economic development positions it as a key growth engine in the coming years. The ongoing recovery from the pandemic underscores the market's adaptive nature and its ability to leverage technological advancements to enhance the overall experience and deliver tangible business outcomes for participants. This combination of factors suggests sustained and significant growth within the events and exhibitions industry throughout the forecast period.
Events and Exhibition Market Company Market Share
Events and Exhibition Market: A Comprehensive Report (2019-2033)
This insightful report provides a detailed analysis of the global Events and Exhibition Market, encompassing historical data (2019-2024), current estimations (2025), and future projections (2025-2033). It delves into market dynamics, competitive landscapes, and emerging trends, equipping stakeholders with crucial insights for strategic decision-making. The market is valued at xx Million in 2025 and is projected to reach xx Million by 2033, exhibiting a CAGR of xx%.
Events and Exhibition Market Market Composition & Trends
This section meticulously examines the structure and evolution of the Events and Exhibition Market. We analyze market concentration, revealing the leading players and their respective market share distributions. Key players like Deutsche Messe AG, Messe Frankfurt GmbH, GL Events, Viparis Holding, Comexposium Group, Koelnmesse GmbH, Messe Düsseldorf GmbH, Percept Limited, Fiera Milano SpA, and MCH Group AG are profiled, evaluating their strategies and contributions. The report further explores innovation catalysts, such as technological advancements in event management software and virtual/hybrid event platforms, and the regulatory landscape impacting event organization and safety. The impact of substitute products, such as virtual conferences and online webinars, is also assessed. Finally, the report details end-user profiles across diverse sectors (Consumer Goods and Retail, Automotive, Industrial, Entertainment, Real Estate, Hospitality, and Others) and provides an overview of recent mergers and acquisitions (M&A) activity within the industry, including deal values and their strategic implications. For instance, the merger between EventWorks and Quest Events in November 2023 signals a trend toward consolidation and expanded service offerings. We also analyze the changing competitive dynamics with data such as M&A deal values (xx Million) and Market share distribution (xx% for top 3 players).
Events and Exhibition Market Industry Evolution
This section meticulously traces the trajectory of the Events and Exhibition Market from 2019 to 2033. We analyze growth trajectories, identifying periods of expansion and contraction, influenced by factors such as economic cycles, global events, and technological disruptions. The adoption rate of new technologies, including virtual reality (VR) and augmented reality (AR) in events, is quantified. The shifting consumer demands, particularly the increasing preference for hybrid and virtual events, are examined. Specific data points, including growth rates for different event types (B2B, B2C, Hybrid) and adoption metrics for new technologies, are provided to illustrate the market's evolutionary path. We delve into the impact of the pandemic and its lasting effects on event formats and participant preferences, demonstrating clear shifts in growth rates and adoption of digital solutions. The analysis highlights a considerable increase in the adoption of hybrid and virtual event formats post-pandemic, with growth rates exceeding xx% year-on-year in the forecast period.
Leading Regions, Countries, or Segments in Events and Exhibition Market
This section identifies the dominant regions, countries, and market segments within the Events and Exhibition Market. We analyze the leading segments by:
- Type: B2B, B2C, Mixed/Hybrid (with detailed analysis of market share and growth drivers for each).
- Revenue Stream: Exhibitor Fee, Sponsorship Fee, Entrance Fee, Services (exploring the relative contribution of each revenue stream to overall market value).
- End User: Consumer Goods and Retail Sector, Automotive and Transportation Sector, Industrial, Entertainment, Real Estate and Property, Hospitality Sector, Other End Users (assessing market size and growth potential within each sector).
Dominance factors are explored in depth, considering investment trends, regulatory support, infrastructure development, and cultural preferences in each region and segment. For example, the strong presence of large-scale exhibition centers in certain regions contributes to their dominance in the market. We also highlight the influence of government initiatives and industry associations on the growth of specific segments, providing specific examples to underscore the analysis. The analysis reveals that the B2B segment currently holds the largest market share, while the Asia-Pacific region demonstrates the highest growth potential due to rapid economic expansion and increasing infrastructure investment.
Events and Exhibition Market Product Innovations
Recent innovations have significantly enhanced the Events and Exhibition Market. This includes advancements in event management software offering streamlined registration, scheduling, and attendee engagement tools. The integration of virtual reality (VR) and augmented reality (AR) technologies provides immersive experiences, expanding the reach and engagement of events. These technological advancements offer unique selling propositions, enhancing the overall event experience and attracting wider participation. Performance metrics such as improved attendee engagement rates and increased lead generation are documented to showcase the impact of these innovations.
Propelling Factors for Events and Exhibition Market Growth
Several factors are driving growth in the Events and Exhibition Market. Technological advancements such as AI-powered event planning tools and personalized attendee experiences are boosting efficiency and engagement. Favorable economic conditions in key regions fuel investment and participation. Supportive regulatory frameworks and government initiatives promoting tourism and industry events also contribute to market expansion. For example, tax incentives for event organizers in certain regions significantly boost participation and investment.
Obstacles in the Events and Exhibition Market Market
Challenges facing the Events and Exhibition Market include stringent regulatory compliance requirements imposing operational costs. Supply chain disruptions impact logistics and resource availability, potentially leading to cost increases and schedule delays. Intense competition among event organizers and venues necessitates innovative strategies to maintain market share. The quantifiable impact of these factors on market growth is analyzed, with specific examples such as supply chain disruptions in 2022 causing a xx% increase in event planning costs.
Future Opportunities in Events and Exhibition Market
Emerging opportunities include the expansion into new markets with high growth potential, such as developing economies in Africa and Latin America. The integration of advanced technologies like AI and blockchain offers enhanced security and personalization. Evolving consumer preferences for sustainable and ethical events create demand for eco-friendly practices and responsible sourcing.
Major Players in the Events and Exhibition Market Ecosystem
Key Developments in Events and Exhibition Market Industry
- November 2023: Art Design Chicago showcases the city's artistic heritage, highlighting the potential of community-focused events to boost cultural tourism and local artist recognition.
- November 2023: The merger of EventWorks and Quest Events creates a larger, more comprehensive event services provider, indicating industry consolidation and a move towards full-service offerings.
Strategic Events and Exhibition Market Market Forecast
The Events and Exhibition Market is poised for continued growth, driven by technological innovation, economic expansion in key regions, and the increasing popularity of hybrid and virtual events. Emerging markets and the adoption of sustainable practices present significant opportunities for expansion and differentiation. The market's potential for growth is substantial, particularly within niche sectors and emerging technologies. The forecast anticipates continued growth, with a focus on adaptation and innovation within the industry.
Events and Exhibition Market Segmentation
-
1. Type
- 1.1. B2B
- 1.2. B2C
- 1.3. Mixed/Hybrid
-
2. Revenue Stream
- 2.1. Exhibitor Fee
- 2.2. Sponsorship Fee
- 2.3. Entrance Fee
- 2.4. Services
-
3. End User
- 3.1. Consumer Goods and Retail Sector
- 3.2. Automotive and Transportation Sector
- 3.3. Industrial
- 3.4. Entertainment
- 3.5. Real Estate and Property
- 3.6. Hospitality Sector
- 3.7. Other End Users
Events and Exhibition Market Segmentation By Geography
-
1. North America
- 1.1. United States
- 1.2. Canada
-
2. Europe
- 2.1. Germany
- 2.2. United Kingdom
- 2.3. France
-
3. Asia Pacific
- 3.1. China
- 3.2. Japan
- 3.3. India
- 3.4. South Korea
- 3.5. Australia and New Zealand
- 4. Latin America
- 5. Middle East and Africa
Events and Exhibition Market Regional Market Share
Geographic Coverage of Events and Exhibition Market
Events and Exhibition Market REPORT HIGHLIGHTS
| Aspects | Details |
|---|---|
| Study Period | 2020-2034 |
| Base Year | 2025 |
| Estimated Year | 2026 |
| Forecast Period | 2026-2034 |
| Historical Period | 2020-2025 |
| Growth Rate | CAGR of 5.29% from 2020-2034 |
| Segmentation |
|
Table of Contents
- 1. Introduction
- 1.1. Research Scope
- 1.2. Market Segmentation
- 1.3. Research Objective
- 1.4. Definitions and Assumptions
- 2. Executive Summary
- 2.1. Market Snapshot
- 3. Market Dynamics
- 3.1. Market Drivers
- 3.2. Market Restrains
- 3.3. Market Trends
- 3.4. Market Opportunities
- 4. Market Factor Analysis
- 4.1. Porters Five Forces
- 4.1.1. Bargaining Power of Suppliers
- 4.1.2. Bargaining Power of Buyers
- 4.1.3. Threat of New Entrants
- 4.1.4. Threat of Substitutes
- 4.1.5. Competitive Rivalry
- 4.2. PESTEL analysis
- 4.3. BCG Analysis
- 4.3.1. Stars (High Growth, High Market Share)
- 4.3.2. Cash Cows (Low Growth, High Market Share)
- 4.3.3. Question Mark (High Growth, Low Market Share)
- 4.3.4. Dogs (Low Growth, Low Market Share)
- 4.4. Ansoff Matrix Analysis
- 4.5. Supply Chain Analysis
- 4.6. Regulatory Landscape
- 4.7. Current Market Potential and Opportunity Assessment (TAM–SAM–SOM Framework)
- 4.8. DMV Analyst Note
- 4.1. Porters Five Forces
- 5. Market Analysis, Insights and Forecast 2021-2033
- 5.1. Market Analysis, Insights and Forecast - by Type
- 5.1.1. B2B
- 5.1.2. B2C
- 5.1.3. Mixed/Hybrid
- 5.2. Market Analysis, Insights and Forecast - by Revenue Stream
- 5.2.1. Exhibitor Fee
- 5.2.2. Sponsorship Fee
- 5.2.3. Entrance Fee
- 5.2.4. Services
- 5.3. Market Analysis, Insights and Forecast - by End User
- 5.3.1. Consumer Goods and Retail Sector
- 5.3.2. Automotive and Transportation Sector
- 5.3.3. Industrial
- 5.3.4. Entertainment
- 5.3.5. Real Estate and Property
- 5.3.6. Hospitality Sector
- 5.3.7. Other End Users
- 5.4. Market Analysis, Insights and Forecast - by Region
- 5.4.1. North America
- 5.4.2. Europe
- 5.4.3. Asia Pacific
- 5.4.4. Latin America
- 5.4.5. Middle East and Africa
- 5.1. Market Analysis, Insights and Forecast - by Type
- 6. Global Events and Exhibition Market Analysis, Insights and Forecast, 2021-2033
- 6.1. Market Analysis, Insights and Forecast - by Type
- 6.1.1. B2B
- 6.1.2. B2C
- 6.1.3. Mixed/Hybrid
- 6.2. Market Analysis, Insights and Forecast - by Revenue Stream
- 6.2.1. Exhibitor Fee
- 6.2.2. Sponsorship Fee
- 6.2.3. Entrance Fee
- 6.2.4. Services
- 6.3. Market Analysis, Insights and Forecast - by End User
- 6.3.1. Consumer Goods and Retail Sector
- 6.3.2. Automotive and Transportation Sector
- 6.3.3. Industrial
- 6.3.4. Entertainment
- 6.3.5. Real Estate and Property
- 6.3.6. Hospitality Sector
- 6.3.7. Other End Users
- 6.1. Market Analysis, Insights and Forecast - by Type
- 7. North America Events and Exhibition Market Analysis, Insights and Forecast, 2020-2032
- 7.1. Market Analysis, Insights and Forecast - by Type
- 7.1.1. B2B
- 7.1.2. B2C
- 7.1.3. Mixed/Hybrid
- 7.2. Market Analysis, Insights and Forecast - by Revenue Stream
- 7.2.1. Exhibitor Fee
- 7.2.2. Sponsorship Fee
- 7.2.3. Entrance Fee
- 7.2.4. Services
- 7.3. Market Analysis, Insights and Forecast - by End User
- 7.3.1. Consumer Goods and Retail Sector
- 7.3.2. Automotive and Transportation Sector
- 7.3.3. Industrial
- 7.3.4. Entertainment
- 7.3.5. Real Estate and Property
- 7.3.6. Hospitality Sector
- 7.3.7. Other End Users
- 7.1. Market Analysis, Insights and Forecast - by Type
- 8. Europe Events and Exhibition Market Analysis, Insights and Forecast, 2020-2032
- 8.1. Market Analysis, Insights and Forecast - by Type
- 8.1.1. B2B
- 8.1.2. B2C
- 8.1.3. Mixed/Hybrid
- 8.2. Market Analysis, Insights and Forecast - by Revenue Stream
- 8.2.1. Exhibitor Fee
- 8.2.2. Sponsorship Fee
- 8.2.3. Entrance Fee
- 8.2.4. Services
- 8.3. Market Analysis, Insights and Forecast - by End User
- 8.3.1. Consumer Goods and Retail Sector
- 8.3.2. Automotive and Transportation Sector
- 8.3.3. Industrial
- 8.3.4. Entertainment
- 8.3.5. Real Estate and Property
- 8.3.6. Hospitality Sector
- 8.3.7. Other End Users
- 8.1. Market Analysis, Insights and Forecast - by Type
- 9. Asia Pacific Events and Exhibition Market Analysis, Insights and Forecast, 2020-2032
- 9.1. Market Analysis, Insights and Forecast - by Type
- 9.1.1. B2B
- 9.1.2. B2C
- 9.1.3. Mixed/Hybrid
- 9.2. Market Analysis, Insights and Forecast - by Revenue Stream
- 9.2.1. Exhibitor Fee
- 9.2.2. Sponsorship Fee
- 9.2.3. Entrance Fee
- 9.2.4. Services
- 9.3. Market Analysis, Insights and Forecast - by End User
- 9.3.1. Consumer Goods and Retail Sector
- 9.3.2. Automotive and Transportation Sector
- 9.3.3. Industrial
- 9.3.4. Entertainment
- 9.3.5. Real Estate and Property
- 9.3.6. Hospitality Sector
- 9.3.7. Other End Users
- 9.1. Market Analysis, Insights and Forecast - by Type
- 10. Latin America Events and Exhibition Market Analysis, Insights and Forecast, 2020-2032
- 10.1. Market Analysis, Insights and Forecast - by Type
- 10.1.1. B2B
- 10.1.2. B2C
- 10.1.3. Mixed/Hybrid
- 10.2. Market Analysis, Insights and Forecast - by Revenue Stream
- 10.2.1. Exhibitor Fee
- 10.2.2. Sponsorship Fee
- 10.2.3. Entrance Fee
- 10.2.4. Services
- 10.3. Market Analysis, Insights and Forecast - by End User
- 10.3.1. Consumer Goods and Retail Sector
- 10.3.2. Automotive and Transportation Sector
- 10.3.3. Industrial
- 10.3.4. Entertainment
- 10.3.5. Real Estate and Property
- 10.3.6. Hospitality Sector
- 10.3.7. Other End Users
- 10.1. Market Analysis, Insights and Forecast - by Type
- 11. Middle East and Africa Events and Exhibition Market Analysis, Insights and Forecast, 2020-2032
- 11.1. Market Analysis, Insights and Forecast - by Type
- 11.1.1. B2B
- 11.1.2. B2C
- 11.1.3. Mixed/Hybrid
- 11.2. Market Analysis, Insights and Forecast - by Revenue Stream
- 11.2.1. Exhibitor Fee
- 11.2.2. Sponsorship Fee
- 11.2.3. Entrance Fee
- 11.2.4. Services
- 11.3. Market Analysis, Insights and Forecast - by End User
- 11.3.1. Consumer Goods and Retail Sector
- 11.3.2. Automotive and Transportation Sector
- 11.3.3. Industrial
- 11.3.4. Entertainment
- 11.3.5. Real Estate and Property
- 11.3.6. Hospitality Sector
- 11.3.7. Other End Users
- 11.1. Market Analysis, Insights and Forecast - by Type
- 12. Competitive Analysis
- 12.1. Company Profiles
- 12.1.1 Deutsche Messe AG
- 12.1.1.1. Company Overview
- 12.1.1.2. Products
- 12.1.1.3. Company Financials
- 12.1.1.4. SWOT Analysis
- 12.1.2 GL Events
- 12.1.2.1. Company Overview
- 12.1.2.2. Products
- 12.1.2.3. Company Financials
- 12.1.2.4. SWOT Analysis
- 12.1.3 Messe Frankfurt GmbH
- 12.1.3.1. Company Overview
- 12.1.3.2. Products
- 12.1.3.3. Company Financials
- 12.1.3.4. SWOT Analysis
- 12.1.4 Viparis Holding
- 12.1.4.1. Company Overview
- 12.1.4.2. Products
- 12.1.4.3. Company Financials
- 12.1.4.4. SWOT Analysis
- 12.1.5 Comexposium Grou
- 12.1.5.1. Company Overview
- 12.1.5.2. Products
- 12.1.5.3. Company Financials
- 12.1.5.4. SWOT Analysis
- 12.1.6 Koelnmesse GmbH
- 12.1.6.1. Company Overview
- 12.1.6.2. Products
- 12.1.6.3. Company Financials
- 12.1.6.4. SWOT Analysis
- 12.1.7 Messe Dsseldorf GmbH
- 12.1.7.1. Company Overview
- 12.1.7.2. Products
- 12.1.7.3. Company Financials
- 12.1.7.4. SWOT Analysis
- 12.1.8 Percept Limited
- 12.1.8.1. Company Overview
- 12.1.8.2. Products
- 12.1.8.3. Company Financials
- 12.1.8.4. SWOT Analysis
- 12.1.9 Fiera Milano SpA
- 12.1.9.1. Company Overview
- 12.1.9.2. Products
- 12.1.9.3. Company Financials
- 12.1.9.4. SWOT Analysis
- 12.1.10 MCH Group AG
- 12.1.10.1. Company Overview
- 12.1.10.2. Products
- 12.1.10.3. Company Financials
- 12.1.10.4. SWOT Analysis
- 12.1.1 Deutsche Messe AG
- 12.2. Market Entropy
- 12.2.1 Company's Key Areas Served
- 12.2.2 Recent Developments
- 12.3. Company Market Share Analysis 2025
- 12.3.1 Top 5 Companies Market Share Analysis
- 12.3.2 Top 3 Companies Market Share Analysis
- 12.4. List of Potential Customers
- 13. Research Methodology
List of Figures
- Figure 1: Global Events and Exhibition Market Revenue Breakdown (Million, %) by Region 2025 & 2033
- Figure 2: North America Events and Exhibition Market Revenue (Million), by Type 2025 & 2033
- Figure 3: North America Events and Exhibition Market Revenue Share (%), by Type 2025 & 2033
- Figure 4: North America Events and Exhibition Market Revenue (Million), by Revenue Stream 2025 & 2033
- Figure 5: North America Events and Exhibition Market Revenue Share (%), by Revenue Stream 2025 & 2033
- Figure 6: North America Events and Exhibition Market Revenue (Million), by End User 2025 & 2033
- Figure 7: North America Events and Exhibition Market Revenue Share (%), by End User 2025 & 2033
- Figure 8: North America Events and Exhibition Market Revenue (Million), by Country 2025 & 2033
- Figure 9: North America Events and Exhibition Market Revenue Share (%), by Country 2025 & 2033
- Figure 10: Europe Events and Exhibition Market Revenue (Million), by Type 2025 & 2033
- Figure 11: Europe Events and Exhibition Market Revenue Share (%), by Type 2025 & 2033
- Figure 12: Europe Events and Exhibition Market Revenue (Million), by Revenue Stream 2025 & 2033
- Figure 13: Europe Events and Exhibition Market Revenue Share (%), by Revenue Stream 2025 & 2033
- Figure 14: Europe Events and Exhibition Market Revenue (Million), by End User 2025 & 2033
- Figure 15: Europe Events and Exhibition Market Revenue Share (%), by End User 2025 & 2033
- Figure 16: Europe Events and Exhibition Market Revenue (Million), by Country 2025 & 2033
- Figure 17: Europe Events and Exhibition Market Revenue Share (%), by Country 2025 & 2033
- Figure 18: Asia Pacific Events and Exhibition Market Revenue (Million), by Type 2025 & 2033
- Figure 19: Asia Pacific Events and Exhibition Market Revenue Share (%), by Type 2025 & 2033
- Figure 20: Asia Pacific Events and Exhibition Market Revenue (Million), by Revenue Stream 2025 & 2033
- Figure 21: Asia Pacific Events and Exhibition Market Revenue Share (%), by Revenue Stream 2025 & 2033
- Figure 22: Asia Pacific Events and Exhibition Market Revenue (Million), by End User 2025 & 2033
- Figure 23: Asia Pacific Events and Exhibition Market Revenue Share (%), by End User 2025 & 2033
- Figure 24: Asia Pacific Events and Exhibition Market Revenue (Million), by Country 2025 & 2033
- Figure 25: Asia Pacific Events and Exhibition Market Revenue Share (%), by Country 2025 & 2033
- Figure 26: Latin America Events and Exhibition Market Revenue (Million), by Type 2025 & 2033
- Figure 27: Latin America Events and Exhibition Market Revenue Share (%), by Type 2025 & 2033
- Figure 28: Latin America Events and Exhibition Market Revenue (Million), by Revenue Stream 2025 & 2033
- Figure 29: Latin America Events and Exhibition Market Revenue Share (%), by Revenue Stream 2025 & 2033
- Figure 30: Latin America Events and Exhibition Market Revenue (Million), by End User 2025 & 2033
- Figure 31: Latin America Events and Exhibition Market Revenue Share (%), by End User 2025 & 2033
- Figure 32: Latin America Events and Exhibition Market Revenue (Million), by Country 2025 & 2033
- Figure 33: Latin America Events and Exhibition Market Revenue Share (%), by Country 2025 & 2033
- Figure 34: Middle East and Africa Events and Exhibition Market Revenue (Million), by Type 2025 & 2033
- Figure 35: Middle East and Africa Events and Exhibition Market Revenue Share (%), by Type 2025 & 2033
- Figure 36: Middle East and Africa Events and Exhibition Market Revenue (Million), by Revenue Stream 2025 & 2033
- Figure 37: Middle East and Africa Events and Exhibition Market Revenue Share (%), by Revenue Stream 2025 & 2033
- Figure 38: Middle East and Africa Events and Exhibition Market Revenue (Million), by End User 2025 & 2033
- Figure 39: Middle East and Africa Events and Exhibition Market Revenue Share (%), by End User 2025 & 2033
- Figure 40: Middle East and Africa Events and Exhibition Market Revenue (Million), by Country 2025 & 2033
- Figure 41: Middle East and Africa Events and Exhibition Market Revenue Share (%), by Country 2025 & 2033
List of Tables
- Table 1: Global Events and Exhibition Market Revenue Million Forecast, by Type 2020 & 2033
- Table 2: Global Events and Exhibition Market Revenue Million Forecast, by Revenue Stream 2020 & 2033
- Table 3: Global Events and Exhibition Market Revenue Million Forecast, by End User 2020 & 2033
- Table 4: Global Events and Exhibition Market Revenue Million Forecast, by Region 2020 & 2033
- Table 5: Global Events and Exhibition Market Revenue Million Forecast, by Type 2020 & 2033
- Table 6: Global Events and Exhibition Market Revenue Million Forecast, by Revenue Stream 2020 & 2033
- Table 7: Global Events and Exhibition Market Revenue Million Forecast, by End User 2020 & 2033
- Table 8: Global Events and Exhibition Market Revenue Million Forecast, by Country 2020 & 2033
- Table 9: United States Events and Exhibition Market Revenue (Million) Forecast, by Application 2020 & 2033
- Table 10: Canada Events and Exhibition Market Revenue (Million) Forecast, by Application 2020 & 2033
- Table 11: Global Events and Exhibition Market Revenue Million Forecast, by Type 2020 & 2033
- Table 12: Global Events and Exhibition Market Revenue Million Forecast, by Revenue Stream 2020 & 2033
- Table 13: Global Events and Exhibition Market Revenue Million Forecast, by End User 2020 & 2033
- Table 14: Global Events and Exhibition Market Revenue Million Forecast, by Country 2020 & 2033
- Table 15: Germany Events and Exhibition Market Revenue (Million) Forecast, by Application 2020 & 2033
- Table 16: United Kingdom Events and Exhibition Market Revenue (Million) Forecast, by Application 2020 & 2033
- Table 17: France Events and Exhibition Market Revenue (Million) Forecast, by Application 2020 & 2033
- Table 18: Global Events and Exhibition Market Revenue Million Forecast, by Type 2020 & 2033
- Table 19: Global Events and Exhibition Market Revenue Million Forecast, by Revenue Stream 2020 & 2033
- Table 20: Global Events and Exhibition Market Revenue Million Forecast, by End User 2020 & 2033
- Table 21: Global Events and Exhibition Market Revenue Million Forecast, by Country 2020 & 2033
- Table 22: China Events and Exhibition Market Revenue (Million) Forecast, by Application 2020 & 2033
- Table 23: Japan Events and Exhibition Market Revenue (Million) Forecast, by Application 2020 & 2033
- Table 24: India Events and Exhibition Market Revenue (Million) Forecast, by Application 2020 & 2033
- Table 25: South Korea Events and Exhibition Market Revenue (Million) Forecast, by Application 2020 & 2033
- Table 26: Australia and New Zealand Events and Exhibition Market Revenue (Million) Forecast, by Application 2020 & 2033
- Table 27: Global Events and Exhibition Market Revenue Million Forecast, by Type 2020 & 2033
- Table 28: Global Events and Exhibition Market Revenue Million Forecast, by Revenue Stream 2020 & 2033
- Table 29: Global Events and Exhibition Market Revenue Million Forecast, by End User 2020 & 2033
- Table 30: Global Events and Exhibition Market Revenue Million Forecast, by Country 2020 & 2033
- Table 31: Global Events and Exhibition Market Revenue Million Forecast, by Type 2020 & 2033
- Table 32: Global Events and Exhibition Market Revenue Million Forecast, by Revenue Stream 2020 & 2033
- Table 33: Global Events and Exhibition Market Revenue Million Forecast, by End User 2020 & 2033
- Table 34: Global Events and Exhibition Market Revenue Million Forecast, by Country 2020 & 2033
Frequently Asked Questions
1. What is the projected Compound Annual Growth Rate (CAGR) of the Events and Exhibition Market?
The projected CAGR is approximately 5.29%.
2. Which companies are prominent players in the Events and Exhibition Market?
Key companies in the market include Deutsche Messe AG, GL Events, Messe Frankfurt GmbH, Viparis Holding, Comexposium Grou, Koelnmesse GmbH, Messe Dsseldorf GmbH, Percept Limited, Fiera Milano SpA, MCH Group AG.
3. What are the main segments of the Events and Exhibition Market?
The market segments include Type, Revenue Stream, End User.
4. Can you provide details about the market size?
The market size is estimated to be USD 54.30 Million as of 2022.
5. What are some drivers contributing to market growth?
Growing Adoption of Geo-Cloning for Exhibition Organizers; Increasing Growth of Consumer Goods Penetrates the Growth of B2C Exhibition.
6. What are the notable trends driving market growth?
Entertainment Sector to Witness Fastest Growth.
7. Are there any restraints impacting market growth?
Loss Due to Restrictions of Smaller Players to Participate Owing to Potential Low Turnouts.
8. Can you provide examples of recent developments in the market?
November 2023 - Art Design Chicago, an initiative of the Terra Foundation for American Art in partnership with local artists and arts organizations, is a citywide collaboration and series of events and exhibitions that highlight the voices and stories that are part of the city's unique artistic heritage and creative communities. Continuing into 2025, more than 50 Chicago-area arts organizations across 30 Chicago neighborhoods and several suburban communities showcase the work of hundreds of artists.
9. What pricing options are available for accessing the report?
Pricing options include single-user, multi-user, and enterprise licenses priced at USD 4750, USD 5250, and USD 8750 respectively.
10. Is the market size provided in terms of value or volume?
The market size is provided in terms of value, measured in Million.
11. Are there any specific market keywords associated with the report?
Yes, the market keyword associated with the report is "Events and Exhibition Market," which aids in identifying and referencing the specific market segment covered.
12. How do I determine which pricing option suits my needs best?
The pricing options vary based on user requirements and access needs. Individual users may opt for single-user licenses, while businesses requiring broader access may choose multi-user or enterprise licenses for cost-effective access to the report.
13. Are there any additional resources or data provided in the Events and Exhibition Market report?
While the report offers comprehensive insights, it's advisable to review the specific contents or supplementary materials provided to ascertain if additional resources or data are available.
14. How can I stay updated on further developments or reports in the Events and Exhibition Market?
To stay informed about further developments, trends, and reports in the Events and Exhibition Market, consider subscribing to industry newsletters, following relevant companies and organizations, or regularly checking reputable industry news sources and publications.
Methodology
Step 1 - Identification of Relevant Samples Size from Population Database


Step 2 - Approaches for Defining Global Market Size (Value, Volume* & Price*)

Note*: In applicable scenarios
Step 3 - Data Sources
Primary Research
- Web Analytics
- Survey Reports
- Research Institute
- Latest Research Reports
- Opinion Leaders
Secondary Research
- Annual Reports
- White Paper
- Latest Press Release
- Industry Association
- Paid Database
- Investor Presentations

Step 4 - Data Triangulation
Involves using different sources of information in order to increase the validity of a study
These sources are likely to be stakeholders in a program - participants, other researchers, program staff, other community members, and so on.
Then we put all data in single framework & apply various statistical tools to find out the dynamic on the market.
During the analysis stage, feedback from the stakeholder groups would be compared to determine areas of agreement as well as areas of divergence