

Key Insights
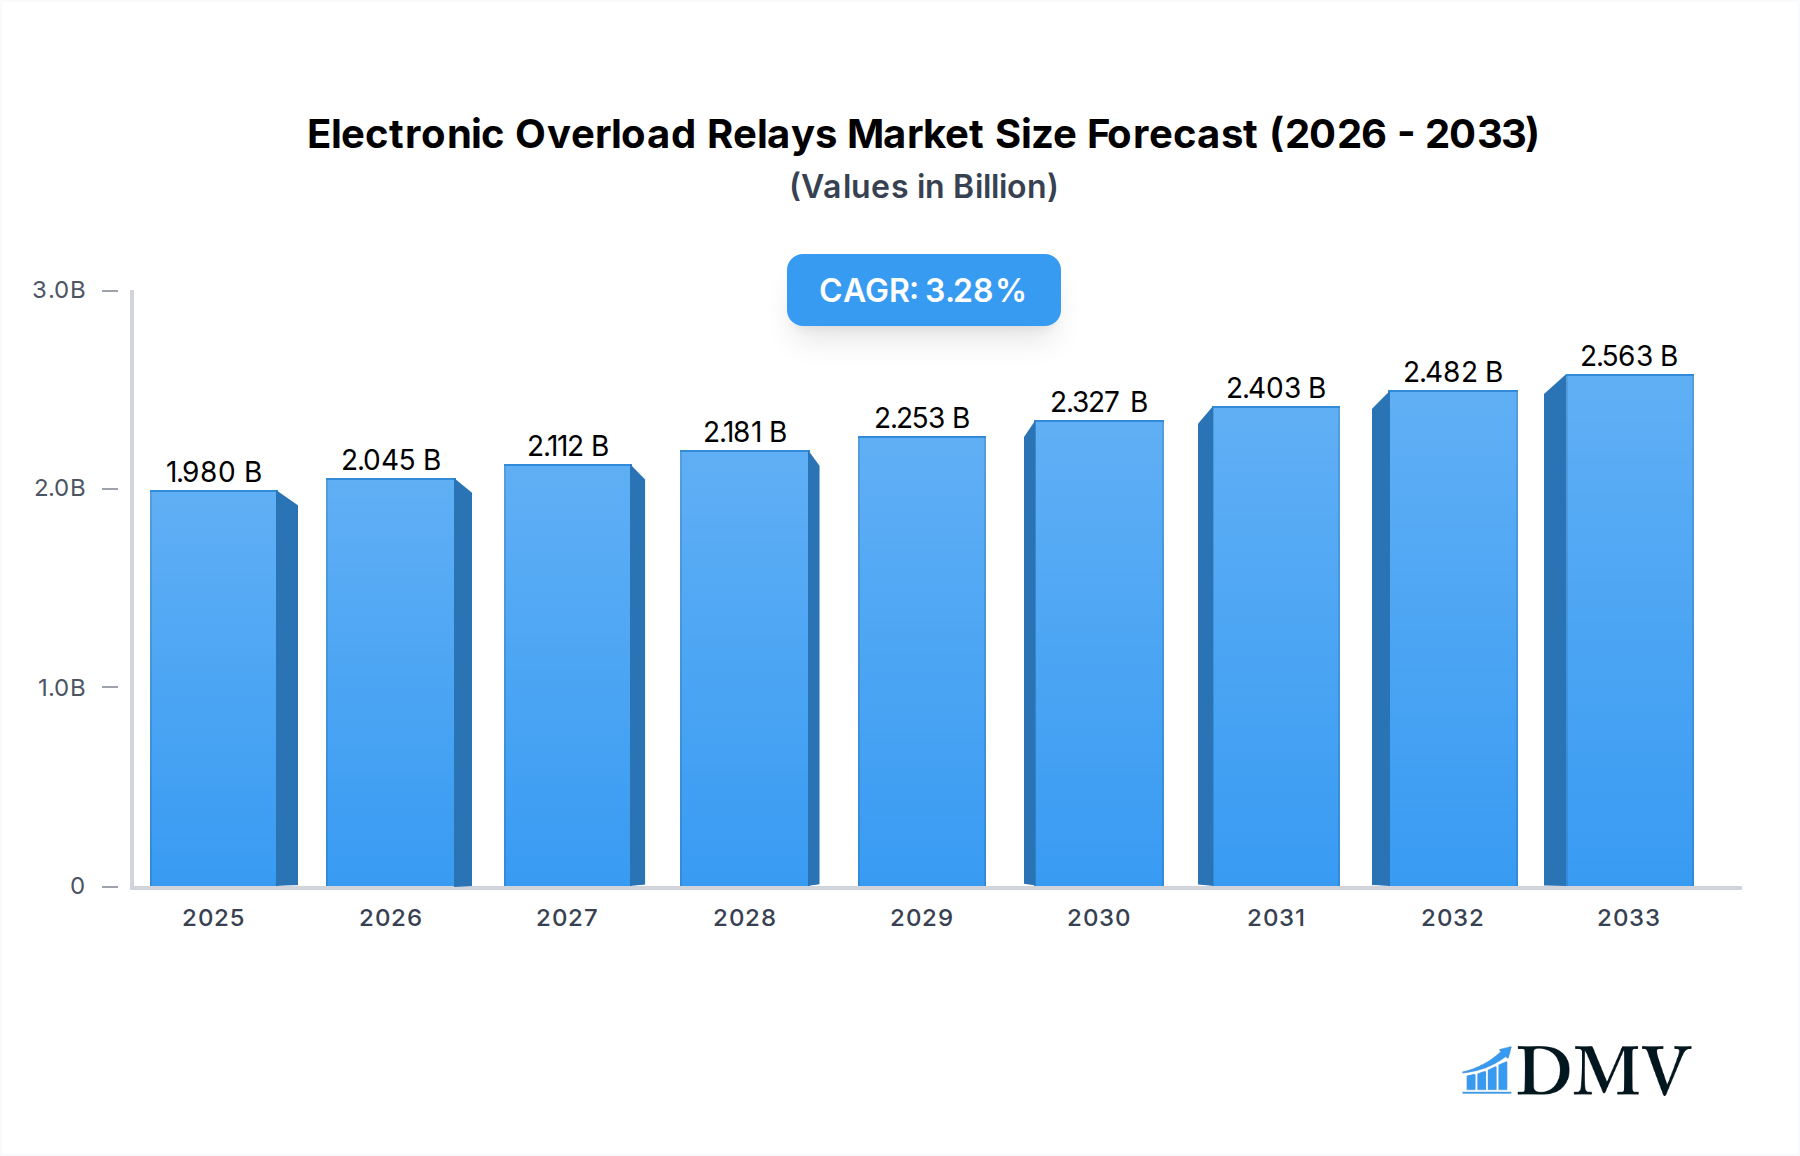
The global Electronic Overload Relays market is poised for robust expansion, projected to reach an estimated USD 1.98 billion in 2025. This growth is underpinned by a healthy Compound Annual Growth Rate (CAGR) of 3.3% over the forecast period of 2025-2033. The increasing demand for advanced motor control and protection systems across various industries, including manufacturing, utilities, and oil & gas, serves as a primary driver. As industrial automation intensifies, the need for reliable and precise overload protection to prevent equipment damage and ensure operational continuity becomes paramount. Furthermore, the growing adoption of smart grids and the subsequent integration of electronic overload relays in power distribution networks are contributing significantly to market expansion. The trend towards energy efficiency and the deployment of sophisticated machinery with integrated safety features further bolster the market's upward trajectory.

Electronic Overload Relays Market Size (In Billion)
The market segmentation reveals a strong focus on the Generators, Motors, and Transformers applications, which are expected to drive substantial demand for electronic overload relays. Within types, both Automatic Reset and Manual Reset Electronic Overload Relays cater to diverse operational needs, with increasing adoption of automatic reset variants in automated industrial environments. Key players such as ABB, Rockwell Automation, GE Industrial Solutions, Eaton, Siemens, and Schneider Electric are actively innovating and expanding their product portfolios to capture market share. Geographically, Asia Pacific, particularly China and India, is emerging as a significant growth hub due to rapid industrialization and infrastructure development. North America and Europe continue to represent mature yet substantial markets driven by technological advancements and stringent safety regulations. While the market demonstrates strong growth potential, challenges such as initial cost of advanced electronic relays and the presence of established electromechanical relay solutions in some legacy systems, might present localized restraints.
Electronic Overload Relays Company Market Share
Electronic Overload Relays Market Composition & Trends
The global electronic overload relays market exhibits a moderately concentrated landscape, with key players like ABB, Rockwell Automation, Siemens, and Eaton holding significant market share. This concentration is driven by substantial R&D investments and established distribution networks. Innovation catalysts include the increasing demand for intelligent motor control, enhanced safety features, and energy efficiency solutions across various industrial applications such as motors, generators, and transformers. The regulatory landscape is also a significant influence, with evolving industrial safety standards and directives pushing for more advanced protection mechanisms. Substitute products, primarily thermal overload relays, are gradually being phased out due to the superior precision and diagnostic capabilities of their electronic counterparts. End-user profiles are diverse, spanning manufacturing, power generation, oil & gas, and building automation. Mergers and acquisitions (M&A) activity, while not excessively high, plays a role in market consolidation and expansion of product portfolios. For instance, recent M&A deal values in the industrial automation sector have ranged from tens of millions to several billion dollars, impacting the competitive dynamics of the electronic overload relays segment. Market share distribution indicates a strong presence of established global players, with emerging manufacturers like DELIXI GROUP and CHINT gaining traction in specific geographical regions. The study forecasts a CAGR of approximately 7.50% during the forecast period, with the market size projected to reach over $6.5 billion by 2033.
- Market Concentration: Moderate, dominated by established players like ABB, Rockwell Automation, Siemens, and Eaton.
- Innovation Catalysts: Demand for intelligent motor control, enhanced safety, energy efficiency.
- Regulatory Influence: Evolving industrial safety standards and directives.
- Substitute Products: Thermal overload relays, increasingly being replaced by electronic alternatives.
- End-User Industries: Manufacturing, power generation, oil & gas, building automation.
- M&A Activity: Strategic acquisitions for portfolio expansion and market consolidation.
- Projected Market Size (2033): Over $6.5 billion.
- Projected CAGR (2025-2033): Approximately 7.50%.
Electronic Overload Relays Industry Evolution
The electronic overload relays industry has undergone a significant transformation over the historical period (2019-2024) and is poised for continued robust growth through the forecast period (2025-2033). During the historical period, the market witnessed steady expansion, fueled by increasing industrial automation adoption and a growing emphasis on equipment protection and operational reliability. The base year, 2025, marks a pivotal point where technological advancements have matured, and market penetration has deepened across various sectors. Early adoption was primarily driven by high-demand industries like manufacturing and power generation, where the cost of downtime due to motor failure far outweighed the investment in advanced protection devices.
Technological advancements have been a primary engine of this evolution. Initial electronic overload relays offered basic overcurrent and phase loss protection. However, over time, manufacturers have integrated sophisticated features such as thermal memory, ground fault detection, communication capabilities (e.g., Modbus, PROFINET), and diagnostic tools. This shift towards smart overload relays has enabled predictive maintenance, reduced unplanned outages, and optimized energy consumption. The transition from traditional thermal overloads to electronic variants has been a gradual but definitive trend, driven by their superior accuracy, faster response times, and wider range of adjustable settings.
Shifting consumer demands have also played a crucial role. End-users are increasingly seeking integrated solutions that not only provide protection but also offer data insights for process optimization and energy management. The rise of Industry 4.0 and the Industrial Internet of Things (IIoT) has further accelerated this demand, with electronic overload relays becoming integral components of smart factory ecosystems. This has spurred innovation in connectivity and data analytics capabilities. For instance, during the historical period, the adoption rate of overload relays with integrated communication modules saw an impressive increase of over 15% annually.
Looking ahead to the forecast period (2025-2033), the market is expected to experience accelerated growth. The estimated year, 2025, will see a market size of approximately $4.0 billion. The growth trajectory is anticipated to remain strong, with a projected CAGR of around 7.50%. This sustained growth will be propelled by the expansion of renewable energy projects (requiring reliable generator protection), the increasing electrification of industries, and the growing adoption of sophisticated automation in emerging economies. The development of more compact, cost-effective, and feature-rich electronic overload relays will further broaden their application scope. The market size is projected to reach over $6.5 billion by 2033. The increasing need for energy efficiency across all industrial sectors will also drive demand for advanced protection relays that can help optimize motor performance and reduce energy wastage, contributing to an estimated annual growth of over 8% in energy-efficient relay solutions.
- Historical Period (2019-2024): Steady growth driven by industrial automation and equipment protection needs.
- Base Year (2025): Market size estimated at $4.0 billion.
- Technological Advancements: Shift from basic protection to smart relays with communication, diagnostics, and predictive maintenance features.
- Consumer Demands: Integration with IIoT, data analytics for optimization and energy management.
- Adoption Rate of Communication Modules (Historical): Over 15% annual increase.
- Forecast Period (2025-2033): Accelerated growth expected.
- Projected Market Size (2033): Over $6.5 billion.
- Projected CAGR (2025-2033): Approximately 7.50%.
- Annual Growth in Energy-Efficient Solutions: Over 8%.
Leading Regions, Countries, or Segments in Electronic Overload Relays
The Motors segment stands out as the dominant application within the global electronic overload relays market, consistently demonstrating the highest demand and market share. This dominance is intrinsically linked to the widespread use of electric motors across virtually every industrial sector, from heavy manufacturing and mining to commercial building management and utilities. The sheer volume of motor installations, coupled with the critical need for reliable motor protection to prevent costly downtime and equipment damage, positions motors as the primary growth driver for electronic overload relays.
In terms of geographical regions, North America and Europe have historically led the market due to their mature industrial bases, strong emphasis on safety regulations, and high adoption rates of advanced automation technologies. However, the Asia-Pacific region is rapidly emerging as a powerhouse, exhibiting the fastest growth trajectory. This surge is attributed to significant industrial expansion, increasing foreign investment in manufacturing, a growing focus on upgrading existing infrastructure with modern safety and efficiency solutions, and a burgeoning demand for advanced motor control in sectors like automotive, electronics, and renewable energy.
Analyzing the dominant segment further, the Motors application benefits from several key drivers. Investment trends in industrial automation are particularly strong in Asia-Pacific, with countries like China, India, and South Korea channeling substantial capital into upgrading their manufacturing capabilities. Regulatory support for industrial safety and energy efficiency is also a significant factor, pushing businesses to adopt the most reliable and advanced protection systems available. The sub-segment of Manual Reset Electronic Overload Relays within the Motors application often sees higher adoption rates due to the safety imperative that requires manual intervention after a fault, ensuring thorough inspection before restarting operations. However, Automatic Reset Electronic Overload Relays are gaining significant traction in applications where continuous operation is paramount and minor, self-rectifying faults are common, leading to an estimated 10% annual growth in this sub-segment within the motors application.
- Dominant Application Segment: Motors.
- Leading Regions: North America, Europe, with Asia-Pacific showing the fastest growth.
- Key Drivers in Asia-Pacific: Industrial expansion, foreign investment, infrastructure upgrades, demand for advanced motor control.
- Dominant Type within Motors (Historical): Manual Reset Electronic Overload Relays.
- Fastest Growing Type within Motors: Automatic Reset Electronic Overload Relays.
- Projected Annual Growth (Automatic Reset in Motors): Approximately 10%.
Electronic Overload Relays Product Innovations
Product innovation in electronic overload relays is currently focused on enhancing intelligence, connectivity, and predictive capabilities. Manufacturers are integrating advanced diagnostic features that monitor motor health in real-time, providing early warnings of potential failures. The incorporation of IoT-enabled communication protocols allows for seamless integration into smart factory systems, enabling remote monitoring, control, and data analysis. These innovations lead to improved operational efficiency, reduced downtime, and optimized energy consumption. For instance, newer models offer advanced trip classes and adjustable thermal memory, allowing for precise protection tailored to specific motor applications, thereby extending motor lifespan by an estimated 15%. The development of ultra-compact designs and multi-functional relays is also a key trend, catering to space-constrained applications and reducing overall system complexity and cost. The estimated market value for innovative smart overload relays is projected to exceed $3 billion by 2028.
Propelling Factors for Electronic Overload Relays Growth
Several key factors are propelling the growth of the electronic overload relays market. The relentless drive towards industrial automation and the adoption of Industry 4.0 principles necessitate advanced motor protection for ensuring operational continuity and preventing costly equipment failures. Stringent industrial safety regulations worldwide are mandating the use of reliable protection devices, boosting demand for sophisticated electronic overload relays. Furthermore, the increasing emphasis on energy efficiency in industrial operations encourages the adoption of these relays, as they contribute to optimizing motor performance and reducing energy wastage. For example, government incentives promoting energy-efficient industrial practices have seen a 20% rise in the adoption of smart overload relays in the past two years. The expansion of renewable energy projects also contributes significantly, requiring robust protection for generator and motor systems.
- Industrial Automation & Industry 4.0: Driving demand for advanced motor protection.
- Stringent Safety Regulations: Mandating reliable protection devices.
- Energy Efficiency Focus: Optimizing motor performance and reducing energy waste.
- Government Incentives: Promoting energy-efficient industrial practices, leading to a 20% rise in smart relay adoption.
- Renewable Energy Expansion: Requiring robust protection for generator and motor systems.
Obstacles in the Electronic Overload Relays Market
Despite the robust growth prospects, the electronic overload relays market faces several obstacles. The higher initial cost of electronic overload relays compared to traditional thermal relays can be a deterrent for some small and medium-sized enterprises (SMEs), particularly in cost-sensitive emerging markets. Supply chain disruptions, as experienced in recent years, can impact the availability of critical components and raw materials, leading to production delays and increased costs. The competitive landscape, while moderately concentrated, also features intense price competition among manufacturers, which can squeeze profit margins. Furthermore, the lack of technical expertise and awareness regarding the full benefits of advanced electronic overload relays in certain industries or regions can hinder adoption. For instance, the perceived complexity of installation and configuration for some advanced features has been cited as a barrier in approximately 15% of potential customer inquiries.
- Higher Initial Cost: Compared to traditional thermal relays, especially for SMEs.
- Supply Chain Disruptions: Impacting component availability and production timelines.
- Intense Price Competition: Affecting profit margins.
- Lack of Technical Expertise/Awareness: Hindering adoption in some sectors.
- Perceived Complexity: Of installation and configuration for advanced features.
Future Opportunities in Electronic Overload Relays
The future holds significant opportunities for the electronic overload relays market. The increasing penetration of renewable energy sources, such as wind and solar power, presents a substantial opportunity for relays used in generator and motor protection within these installations. The growing trend of electric vehicle (EV) charging infrastructure also creates new avenues for motor protection applications. Furthermore, the ongoing development of smart grids and the demand for enhanced grid stability will drive the need for intelligent protection devices in power distribution systems. The miniaturization and cost reduction of electronic overload relays will unlock new markets and applications, including integration into smaller machinery and portable equipment. The expanding use of specialized relays for capacitor banks and other ancillary equipment in industrial settings also represents a growth area, with an estimated market potential of over $500 million by 2030.
- Renewable Energy Sector: Growing demand for generator and motor protection.
- Electric Vehicle (EV) Charging Infrastructure: New application areas.
- Smart Grids & Grid Stability: Need for intelligent protection devices.
- Miniaturization & Cost Reduction: Unlocking new markets and applications.
- Capacitor Banks & Ancillary Equipment: Emerging growth area, estimated market potential over $500 million by 2030.
Major Players in the Electronic Overload Relays Ecosystem
ABB Rockwell Automation GE Industrial Solutions Eaton Siemens Schneider Electric DELIXI GROUP CHINT Sprecher+Schuh Littelfuse GREEGOO Finder MTE
Key Developments in Electronic Overload Relays Industry
- 2023: ABB launches a new series of intelligent overload relays with enhanced IoT connectivity and predictive maintenance capabilities.
- 2023: Rockwell Automation expands its motor control portfolio with advanced electronic overload relays offering integrated diagnostics.
- 2024: Siemens introduces a compact and cost-effective range of overload relays designed for smaller industrial applications.
- 2024: Eaton acquires a specialized manufacturer of smart motor protection devices, strengthening its offering in the IIoT space.
- 2024: DELIXI GROUP announces significant expansion of its production capacity for electronic overload relays, targeting emerging markets.
- 2024: CHINT focuses on developing energy-efficient overload relay solutions to meet growing sustainability demands.
- 2025: Littelfuse introduces new overload relays with improved thermal runaway protection features.
- 2025: Schneider Electric unveils a new generation of modular overload relays with advanced communication options.
Strategic Electronic Overload Relays Market Forecast
The strategic forecast for the electronic overload relays market is overwhelmingly positive, driven by the confluence of technological innovation, stringent safety mandates, and the global push for industrial efficiency. The increasing integration of smart capabilities, enabling predictive maintenance and IIoT connectivity, will continue to be a primary growth catalyst. As industries worldwide embrace digital transformation, the demand for advanced motor protection that seamlessly integrates into automated systems will escalate significantly. Furthermore, the expanding renewable energy sector and the ongoing electrification of industries present substantial untapped potential. The continuous evolution of product features, coupled with efforts to reduce costs and improve accessibility, will further solidify the market's upward trajectory. The market is strategically positioned for sustained growth, with innovations in connectivity, diagnostics, and energy efficiency leading the charge, projected to reach over $6.5 billion by 2033.
Electronic Overload Relays Segmentation
-
1. Application
- 1.1. Generators
- 1.2. Motors
- 1.3. Transformers
- 1.4. Capacitor
- 1.5. Other
-
2. Types
- 2.1. Automatic Reset Electronic Overload Relays
- 2.2. Manual Reset Electronic Overload Relays
Electronic Overload Relays Segmentation By Geography
-
1. North America
- 1.1. United States
- 1.2. Canada
- 1.3. Mexico
-
2. South America
- 2.1. Brazil
- 2.2. Argentina
- 2.3. Rest of South America
-
3. Europe
- 3.1. United Kingdom
- 3.2. Germany
- 3.3. France
- 3.4. Italy
- 3.5. Spain
- 3.6. Russia
- 3.7. Benelux
- 3.8. Nordics
- 3.9. Rest of Europe
-
4. Middle East & Africa
- 4.1. Turkey
- 4.2. Israel
- 4.3. GCC
- 4.4. North Africa
- 4.5. South Africa
- 4.6. Rest of Middle East & Africa
-
5. Asia Pacific
- 5.1. China
- 5.2. India
- 5.3. Japan
- 5.4. South Korea
- 5.5. ASEAN
- 5.6. Oceania
- 5.7. Rest of Asia Pacific
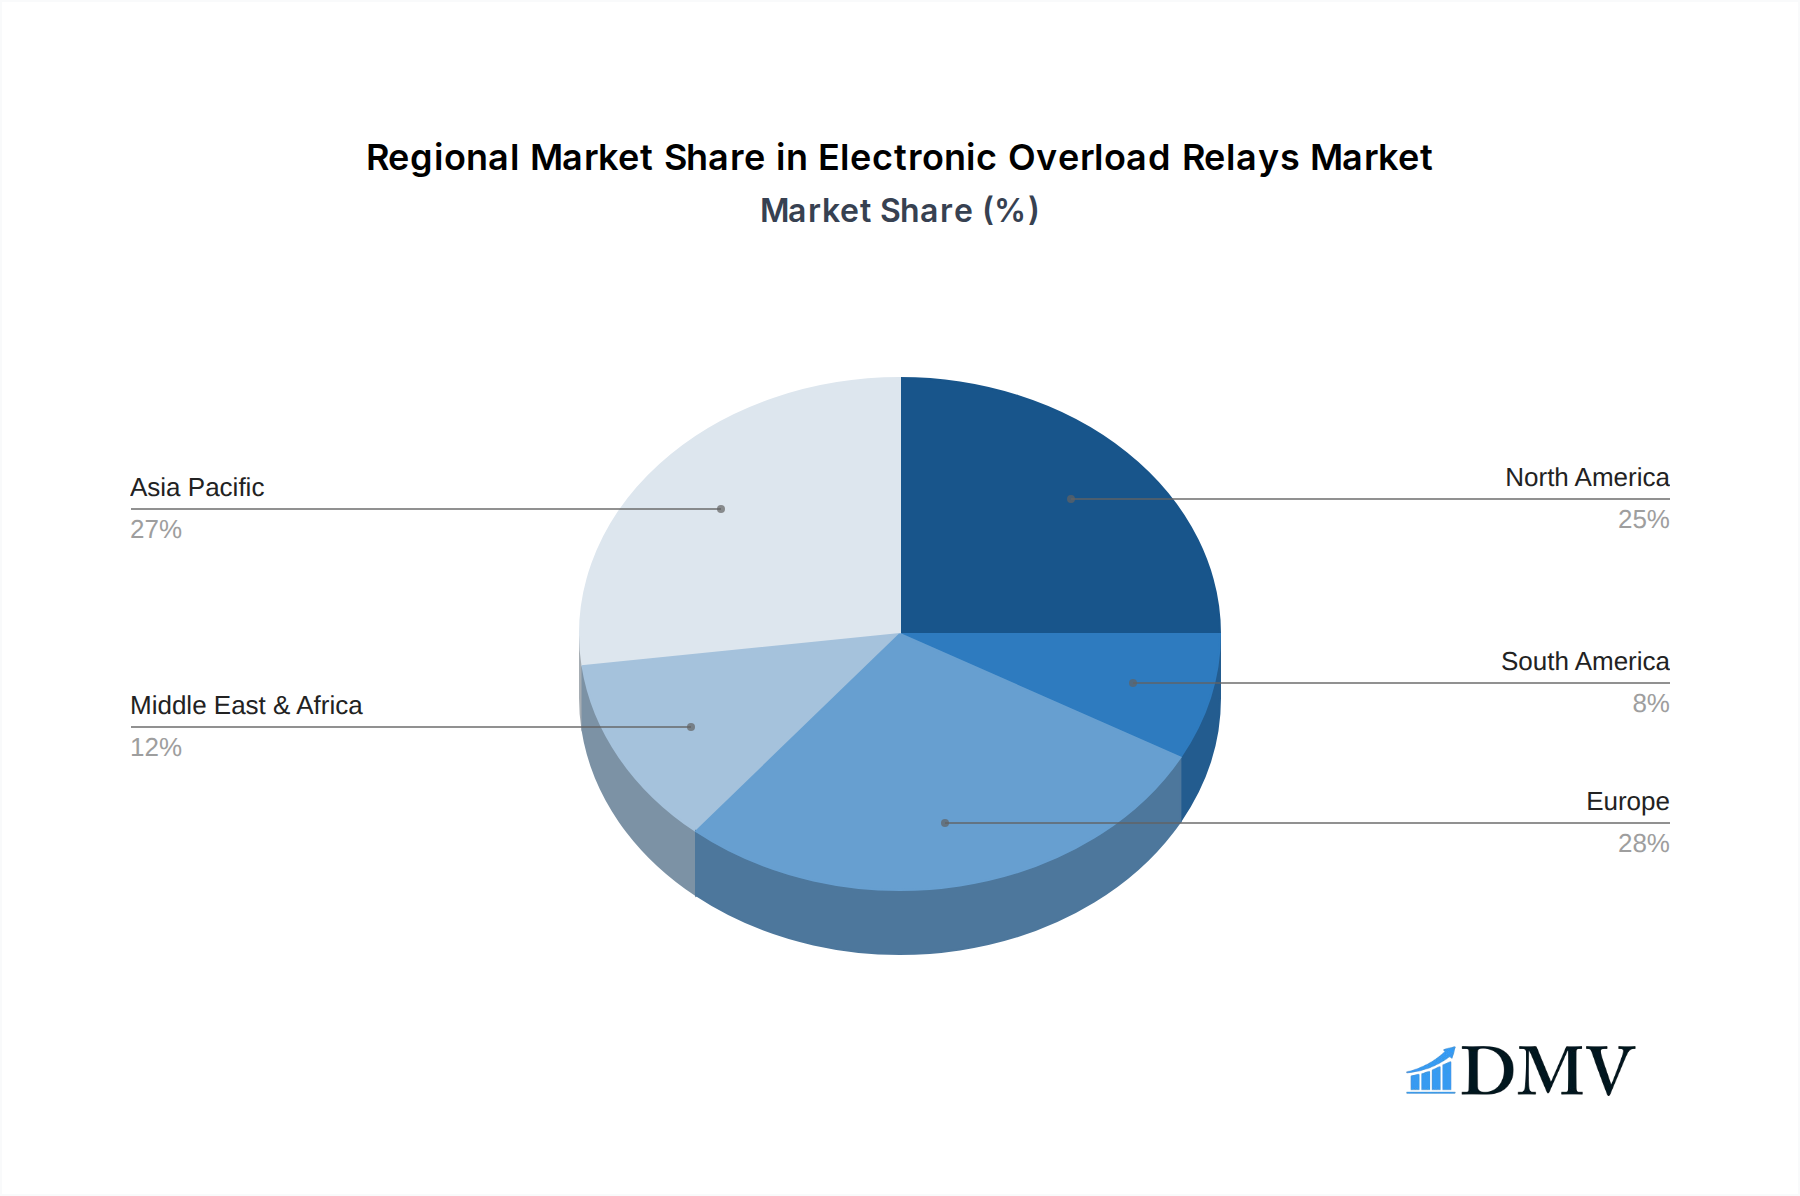
Electronic Overload Relays Regional Market Share
Geographic Coverage of Electronic Overload Relays
Electronic Overload Relays REPORT HIGHLIGHTS
| Aspects | Details |
|---|---|
| Study Period | 2020-2034 |
| Base Year | 2025 |
| Estimated Year | 2026 |
| Forecast Period | 2026-2034 |
| Historical Period | 2020-2025 |
| Growth Rate | CAGR of 3.3% from 2020-2034 |
| Segmentation |
|
Table of Contents
- 1. Introduction
- 1.1. Research Scope
- 1.2. Market Segmentation
- 1.3. Research Methodology
- 1.4. Definitions and Assumptions
- 2. Executive Summary
- 2.1. Introduction
- 3. Market Dynamics
- 3.1. Introduction
- 3.2. Market Drivers
- 3.3. Market Restrains
- 3.4. Market Trends
- 4. Market Factor Analysis
- 4.1. Porters Five Forces
- 4.2. Supply/Value Chain
- 4.3. PESTEL analysis
- 4.4. Market Entropy
- 4.5. Patent/Trademark Analysis
- 5. Global Electronic Overload Relays Analysis, Insights and Forecast, 2020-2032
- 5.1. Market Analysis, Insights and Forecast - by Application
- 5.1.1. Generators
- 5.1.2. Motors
- 5.1.3. Transformers
- 5.1.4. Capacitor
- 5.1.5. Other
- 5.2. Market Analysis, Insights and Forecast - by Types
- 5.2.1. Automatic Reset Electronic Overload Relays
- 5.2.2. Manual Reset Electronic Overload Relays
- 5.3. Market Analysis, Insights and Forecast - by Region
- 5.3.1. North America
- 5.3.2. South America
- 5.3.3. Europe
- 5.3.4. Middle East & Africa
- 5.3.5. Asia Pacific
- 5.1. Market Analysis, Insights and Forecast - by Application
- 6. North America Electronic Overload Relays Analysis, Insights and Forecast, 2020-2032
- 6.1. Market Analysis, Insights and Forecast - by Application
- 6.1.1. Generators
- 6.1.2. Motors
- 6.1.3. Transformers
- 6.1.4. Capacitor
- 6.1.5. Other
- 6.2. Market Analysis, Insights and Forecast - by Types
- 6.2.1. Automatic Reset Electronic Overload Relays
- 6.2.2. Manual Reset Electronic Overload Relays
- 6.1. Market Analysis, Insights and Forecast - by Application
- 7. South America Electronic Overload Relays Analysis, Insights and Forecast, 2020-2032
- 7.1. Market Analysis, Insights and Forecast - by Application
- 7.1.1. Generators
- 7.1.2. Motors
- 7.1.3. Transformers
- 7.1.4. Capacitor
- 7.1.5. Other
- 7.2. Market Analysis, Insights and Forecast - by Types
- 7.2.1. Automatic Reset Electronic Overload Relays
- 7.2.2. Manual Reset Electronic Overload Relays
- 7.1. Market Analysis, Insights and Forecast - by Application
- 8. Europe Electronic Overload Relays Analysis, Insights and Forecast, 2020-2032
- 8.1. Market Analysis, Insights and Forecast - by Application
- 8.1.1. Generators
- 8.1.2. Motors
- 8.1.3. Transformers
- 8.1.4. Capacitor
- 8.1.5. Other
- 8.2. Market Analysis, Insights and Forecast - by Types
- 8.2.1. Automatic Reset Electronic Overload Relays
- 8.2.2. Manual Reset Electronic Overload Relays
- 8.1. Market Analysis, Insights and Forecast - by Application
- 9. Middle East & Africa Electronic Overload Relays Analysis, Insights and Forecast, 2020-2032
- 9.1. Market Analysis, Insights and Forecast - by Application
- 9.1.1. Generators
- 9.1.2. Motors
- 9.1.3. Transformers
- 9.1.4. Capacitor
- 9.1.5. Other
- 9.2. Market Analysis, Insights and Forecast - by Types
- 9.2.1. Automatic Reset Electronic Overload Relays
- 9.2.2. Manual Reset Electronic Overload Relays
- 9.1. Market Analysis, Insights and Forecast - by Application
- 10. Asia Pacific Electronic Overload Relays Analysis, Insights and Forecast, 2020-2032
- 10.1. Market Analysis, Insights and Forecast - by Application
- 10.1.1. Generators
- 10.1.2. Motors
- 10.1.3. Transformers
- 10.1.4. Capacitor
- 10.1.5. Other
- 10.2. Market Analysis, Insights and Forecast - by Types
- 10.2.1. Automatic Reset Electronic Overload Relays
- 10.2.2. Manual Reset Electronic Overload Relays
- 10.1. Market Analysis, Insights and Forecast - by Application
- 11. Competitive Analysis
- 11.1. Global Market Share Analysis 2025
- 11.2. Company Profiles
- 11.2.1 ABB
- 11.2.1.1. Overview
- 11.2.1.2. Products
- 11.2.1.3. SWOT Analysis
- 11.2.1.4. Recent Developments
- 11.2.1.5. Financials (Based on Availability)
- 11.2.2 Rockwell Automation
- 11.2.2.1. Overview
- 11.2.2.2. Products
- 11.2.2.3. SWOT Analysis
- 11.2.2.4. Recent Developments
- 11.2.2.5. Financials (Based on Availability)
- 11.2.3 GE Industrial Solutions
- 11.2.3.1. Overview
- 11.2.3.2. Products
- 11.2.3.3. SWOT Analysis
- 11.2.3.4. Recent Developments
- 11.2.3.5. Financials (Based on Availability)
- 11.2.4 Eaton
- 11.2.4.1. Overview
- 11.2.4.2. Products
- 11.2.4.3. SWOT Analysis
- 11.2.4.4. Recent Developments
- 11.2.4.5. Financials (Based on Availability)
- 11.2.5 Siemens
- 11.2.5.1. Overview
- 11.2.5.2. Products
- 11.2.5.3. SWOT Analysis
- 11.2.5.4. Recent Developments
- 11.2.5.5. Financials (Based on Availability)
- 11.2.6 Schneider Electric
- 11.2.6.1. Overview
- 11.2.6.2. Products
- 11.2.6.3. SWOT Analysis
- 11.2.6.4. Recent Developments
- 11.2.6.5. Financials (Based on Availability)
- 11.2.7 DELIXI GROUP
- 11.2.7.1. Overview
- 11.2.7.2. Products
- 11.2.7.3. SWOT Analysis
- 11.2.7.4. Recent Developments
- 11.2.7.5. Financials (Based on Availability)
- 11.2.8 CHINT
- 11.2.8.1. Overview
- 11.2.8.2. Products
- 11.2.8.3. SWOT Analysis
- 11.2.8.4. Recent Developments
- 11.2.8.5. Financials (Based on Availability)
- 11.2.9 Sprecher+Schuh
- 11.2.9.1. Overview
- 11.2.9.2. Products
- 11.2.9.3. SWOT Analysis
- 11.2.9.4. Recent Developments
- 11.2.9.5. Financials (Based on Availability)
- 11.2.10 Littelfuse
- 11.2.10.1. Overview
- 11.2.10.2. Products
- 11.2.10.3. SWOT Analysis
- 11.2.10.4. Recent Developments
- 11.2.10.5. Financials (Based on Availability)
- 11.2.11 GREEGOO
- 11.2.11.1. Overview
- 11.2.11.2. Products
- 11.2.11.3. SWOT Analysis
- 11.2.11.4. Recent Developments
- 11.2.11.5. Financials (Based on Availability)
- 11.2.12 Finder
- 11.2.12.1. Overview
- 11.2.12.2. Products
- 11.2.12.3. SWOT Analysis
- 11.2.12.4. Recent Developments
- 11.2.12.5. Financials (Based on Availability)
- 11.2.13 MTE
- 11.2.13.1. Overview
- 11.2.13.2. Products
- 11.2.13.3. SWOT Analysis
- 11.2.13.4. Recent Developments
- 11.2.13.5. Financials (Based on Availability)
- 11.2.1 ABB
List of Figures
- Figure 1: Global Electronic Overload Relays Revenue Breakdown (billion, %) by Region 2025 & 2033
- Figure 2: North America Electronic Overload Relays Revenue (billion), by Application 2025 & 2033
- Figure 3: North America Electronic Overload Relays Revenue Share (%), by Application 2025 & 2033
- Figure 4: North America Electronic Overload Relays Revenue (billion), by Types 2025 & 2033
- Figure 5: North America Electronic Overload Relays Revenue Share (%), by Types 2025 & 2033
- Figure 6: North America Electronic Overload Relays Revenue (billion), by Country 2025 & 2033
- Figure 7: North America Electronic Overload Relays Revenue Share (%), by Country 2025 & 2033
- Figure 8: South America Electronic Overload Relays Revenue (billion), by Application 2025 & 2033
- Figure 9: South America Electronic Overload Relays Revenue Share (%), by Application 2025 & 2033
- Figure 10: South America Electronic Overload Relays Revenue (billion), by Types 2025 & 2033
- Figure 11: South America Electronic Overload Relays Revenue Share (%), by Types 2025 & 2033
- Figure 12: South America Electronic Overload Relays Revenue (billion), by Country 2025 & 2033
- Figure 13: South America Electronic Overload Relays Revenue Share (%), by Country 2025 & 2033
- Figure 14: Europe Electronic Overload Relays Revenue (billion), by Application 2025 & 2033
- Figure 15: Europe Electronic Overload Relays Revenue Share (%), by Application 2025 & 2033
- Figure 16: Europe Electronic Overload Relays Revenue (billion), by Types 2025 & 2033
- Figure 17: Europe Electronic Overload Relays Revenue Share (%), by Types 2025 & 2033
- Figure 18: Europe Electronic Overload Relays Revenue (billion), by Country 2025 & 2033
- Figure 19: Europe Electronic Overload Relays Revenue Share (%), by Country 2025 & 2033
- Figure 20: Middle East & Africa Electronic Overload Relays Revenue (billion), by Application 2025 & 2033
- Figure 21: Middle East & Africa Electronic Overload Relays Revenue Share (%), by Application 2025 & 2033
- Figure 22: Middle East & Africa Electronic Overload Relays Revenue (billion), by Types 2025 & 2033
- Figure 23: Middle East & Africa Electronic Overload Relays Revenue Share (%), by Types 2025 & 2033
- Figure 24: Middle East & Africa Electronic Overload Relays Revenue (billion), by Country 2025 & 2033
- Figure 25: Middle East & Africa Electronic Overload Relays Revenue Share (%), by Country 2025 & 2033
- Figure 26: Asia Pacific Electronic Overload Relays Revenue (billion), by Application 2025 & 2033
- Figure 27: Asia Pacific Electronic Overload Relays Revenue Share (%), by Application 2025 & 2033
- Figure 28: Asia Pacific Electronic Overload Relays Revenue (billion), by Types 2025 & 2033
- Figure 29: Asia Pacific Electronic Overload Relays Revenue Share (%), by Types 2025 & 2033
- Figure 30: Asia Pacific Electronic Overload Relays Revenue (billion), by Country 2025 & 2033
- Figure 31: Asia Pacific Electronic Overload Relays Revenue Share (%), by Country 2025 & 2033
List of Tables
- Table 1: Global Electronic Overload Relays Revenue billion Forecast, by Application 2020 & 2033
- Table 2: Global Electronic Overload Relays Revenue billion Forecast, by Types 2020 & 2033
- Table 3: Global Electronic Overload Relays Revenue billion Forecast, by Region 2020 & 2033
- Table 4: Global Electronic Overload Relays Revenue billion Forecast, by Application 2020 & 2033
- Table 5: Global Electronic Overload Relays Revenue billion Forecast, by Types 2020 & 2033
- Table 6: Global Electronic Overload Relays Revenue billion Forecast, by Country 2020 & 2033
- Table 7: United States Electronic Overload Relays Revenue (billion) Forecast, by Application 2020 & 2033
- Table 8: Canada Electronic Overload Relays Revenue (billion) Forecast, by Application 2020 & 2033
- Table 9: Mexico Electronic Overload Relays Revenue (billion) Forecast, by Application 2020 & 2033
- Table 10: Global Electronic Overload Relays Revenue billion Forecast, by Application 2020 & 2033
- Table 11: Global Electronic Overload Relays Revenue billion Forecast, by Types 2020 & 2033
- Table 12: Global Electronic Overload Relays Revenue billion Forecast, by Country 2020 & 2033
- Table 13: Brazil Electronic Overload Relays Revenue (billion) Forecast, by Application 2020 & 2033
- Table 14: Argentina Electronic Overload Relays Revenue (billion) Forecast, by Application 2020 & 2033
- Table 15: Rest of South America Electronic Overload Relays Revenue (billion) Forecast, by Application 2020 & 2033
- Table 16: Global Electronic Overload Relays Revenue billion Forecast, by Application 2020 & 2033
- Table 17: Global Electronic Overload Relays Revenue billion Forecast, by Types 2020 & 2033
- Table 18: Global Electronic Overload Relays Revenue billion Forecast, by Country 2020 & 2033
- Table 19: United Kingdom Electronic Overload Relays Revenue (billion) Forecast, by Application 2020 & 2033
- Table 20: Germany Electronic Overload Relays Revenue (billion) Forecast, by Application 2020 & 2033
- Table 21: France Electronic Overload Relays Revenue (billion) Forecast, by Application 2020 & 2033
- Table 22: Italy Electronic Overload Relays Revenue (billion) Forecast, by Application 2020 & 2033
- Table 23: Spain Electronic Overload Relays Revenue (billion) Forecast, by Application 2020 & 2033
- Table 24: Russia Electronic Overload Relays Revenue (billion) Forecast, by Application 2020 & 2033
- Table 25: Benelux Electronic Overload Relays Revenue (billion) Forecast, by Application 2020 & 2033
- Table 26: Nordics Electronic Overload Relays Revenue (billion) Forecast, by Application 2020 & 2033
- Table 27: Rest of Europe Electronic Overload Relays Revenue (billion) Forecast, by Application 2020 & 2033
- Table 28: Global Electronic Overload Relays Revenue billion Forecast, by Application 2020 & 2033
- Table 29: Global Electronic Overload Relays Revenue billion Forecast, by Types 2020 & 2033
- Table 30: Global Electronic Overload Relays Revenue billion Forecast, by Country 2020 & 2033
- Table 31: Turkey Electronic Overload Relays Revenue (billion) Forecast, by Application 2020 & 2033
- Table 32: Israel Electronic Overload Relays Revenue (billion) Forecast, by Application 2020 & 2033
- Table 33: GCC Electronic Overload Relays Revenue (billion) Forecast, by Application 2020 & 2033
- Table 34: North Africa Electronic Overload Relays Revenue (billion) Forecast, by Application 2020 & 2033
- Table 35: South Africa Electronic Overload Relays Revenue (billion) Forecast, by Application 2020 & 2033
- Table 36: Rest of Middle East & Africa Electronic Overload Relays Revenue (billion) Forecast, by Application 2020 & 2033
- Table 37: Global Electronic Overload Relays Revenue billion Forecast, by Application 2020 & 2033
- Table 38: Global Electronic Overload Relays Revenue billion Forecast, by Types 2020 & 2033
- Table 39: Global Electronic Overload Relays Revenue billion Forecast, by Country 2020 & 2033
- Table 40: China Electronic Overload Relays Revenue (billion) Forecast, by Application 2020 & 2033
- Table 41: India Electronic Overload Relays Revenue (billion) Forecast, by Application 2020 & 2033
- Table 42: Japan Electronic Overload Relays Revenue (billion) Forecast, by Application 2020 & 2033
- Table 43: South Korea Electronic Overload Relays Revenue (billion) Forecast, by Application 2020 & 2033
- Table 44: ASEAN Electronic Overload Relays Revenue (billion) Forecast, by Application 2020 & 2033
- Table 45: Oceania Electronic Overload Relays Revenue (billion) Forecast, by Application 2020 & 2033
- Table 46: Rest of Asia Pacific Electronic Overload Relays Revenue (billion) Forecast, by Application 2020 & 2033
Frequently Asked Questions
1. What is the projected Compound Annual Growth Rate (CAGR) of the Electronic Overload Relays?
The projected CAGR is approximately 3.3%.
2. Which companies are prominent players in the Electronic Overload Relays?
Key companies in the market include ABB, Rockwell Automation, GE Industrial Solutions, Eaton, Siemens, Schneider Electric, DELIXI GROUP, CHINT, Sprecher+Schuh, Littelfuse, GREEGOO, Finder, MTE.
3. What are the main segments of the Electronic Overload Relays?
The market segments include Application, Types.
4. Can you provide details about the market size?
The market size is estimated to be USD 1.98 billion as of 2022.
5. What are some drivers contributing to market growth?
N/A
6. What are the notable trends driving market growth?
N/A
7. Are there any restraints impacting market growth?
N/A
8. Can you provide examples of recent developments in the market?
N/A
9. What pricing options are available for accessing the report?
Pricing options include single-user, multi-user, and enterprise licenses priced at USD 4900.00, USD 7350.00, and USD 9800.00 respectively.
10. Is the market size provided in terms of value or volume?
The market size is provided in terms of value, measured in billion.
11. Are there any specific market keywords associated with the report?
Yes, the market keyword associated with the report is "Electronic Overload Relays," which aids in identifying and referencing the specific market segment covered.
12. How do I determine which pricing option suits my needs best?
The pricing options vary based on user requirements and access needs. Individual users may opt for single-user licenses, while businesses requiring broader access may choose multi-user or enterprise licenses for cost-effective access to the report.
13. Are there any additional resources or data provided in the Electronic Overload Relays report?
While the report offers comprehensive insights, it's advisable to review the specific contents or supplementary materials provided to ascertain if additional resources or data are available.
14. How can I stay updated on further developments or reports in the Electronic Overload Relays?
To stay informed about further developments, trends, and reports in the Electronic Overload Relays, consider subscribing to industry newsletters, following relevant companies and organizations, or regularly checking reputable industry news sources and publications.
Methodology
Step 1 - Identification of Relevant Samples Size from Population Database


Step 2 - Approaches for Defining Global Market Size (Value, Volume* & Price*)

Note*: In applicable scenarios
Step 3 - Data Sources
Primary Research
- Web Analytics
- Survey Reports
- Research Institute
- Latest Research Reports
- Opinion Leaders
Secondary Research
- Annual Reports
- White Paper
- Latest Press Release
- Industry Association
- Paid Database
- Investor Presentations

Step 4 - Data Triangulation
Involves using different sources of information in order to increase the validity of a study
These sources are likely to be stakeholders in a program - participants, other researchers, program staff, other community members, and so on.
Then we put all data in single framework & apply various statistical tools to find out the dynamic on the market.
During the analysis stage, feedback from the stakeholder groups would be compared to determine areas of agreement as well as areas of divergence