

Key Insights
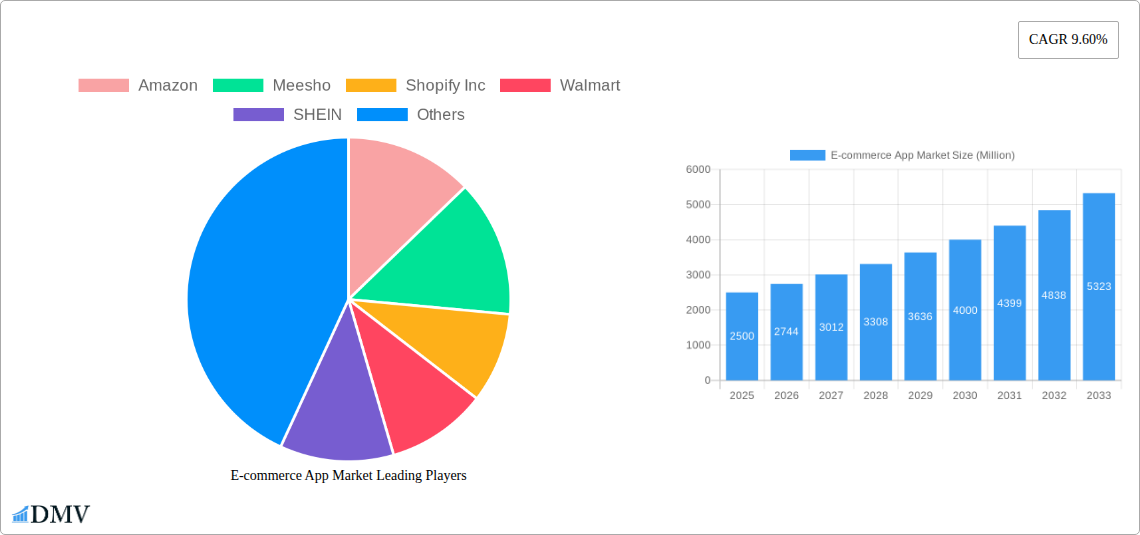
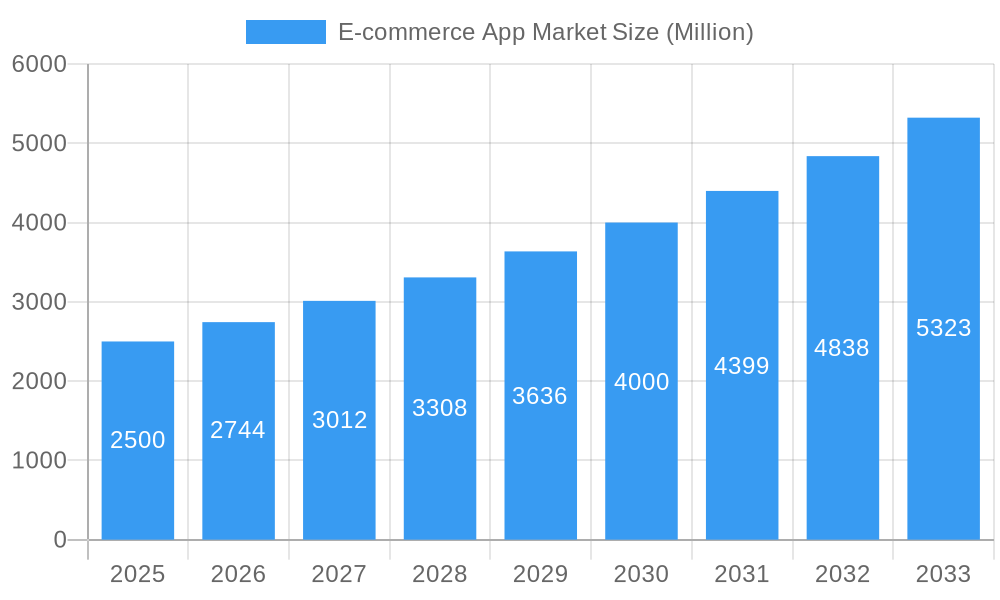
The global e-commerce app market is experiencing robust growth, driven by the increasing adoption of smartphones, rising internet penetration, and the convenience offered by mobile shopping. The market's Compound Annual Growth Rate (CAGR) of 9.60% from 2019 to 2024 suggests a significant expansion, and this trajectory is expected to continue throughout the forecast period (2025-2033). Key market drivers include the proliferation of mobile payment systems, personalized shopping experiences enabled by AI and machine learning, and the growing preference for omnichannel retail strategies that seamlessly integrate online and offline channels. The market is segmented by type (in-app purchases, advertisement, and other types) and platform (Android and iPhone), with in-app purchases and Android platforms currently holding significant market share due to their widespread adoption and ease of use. Major players such as Amazon, Meesho, Shopify, Walmart, SHEIN, AJIO, Tata Cliq, eBay, Alibaba, and Etsy are intensely competing, leveraging advanced technologies and strategic partnerships to enhance user experience and expand their market presence. The competitive landscape is further characterized by ongoing innovation in areas such as augmented reality (AR) and virtual reality (VR) for product visualization, and the integration of social commerce features to drive engagement and sales. The Asia Pacific region is projected to witness substantial growth due to its burgeoning middle class and increasing smartphone penetration, while North America and Europe maintain significant market shares due to their established e-commerce ecosystems.
E-commerce App Market Market Size (In Billion)
The market's growth, however, is not without its challenges. Rising data security concerns and the increasing prevalence of fraudulent activities pose significant restraints on market expansion. Further constraints include the need for robust logistics and delivery infrastructure, especially in developing economies, and the ongoing competition for user attention in a crowded app marketplace. To mitigate these challenges, e-commerce app developers are increasingly investing in secure payment gateways, robust fraud detection mechanisms, and enhanced customer service capabilities. Future growth is expected to be further fueled by the integration of 5G technology and the development of increasingly sophisticated personalization algorithms, leading to more tailored and engaging shopping experiences. The continued evolution of mobile technology and consumer behavior will be crucial drivers in shaping the future of this dynamic market.
E-commerce App Market Company Market Share
E-commerce App Market: A Comprehensive Report (2019-2033)
This insightful report provides a detailed analysis of the global E-commerce App Market, projecting a market value of $xx Million by 2033. We delve into market composition, industry evolution, leading players, and future opportunities, offering crucial insights for stakeholders across the e-commerce landscape. The study period covers 2019-2033, with 2025 serving as the base and estimated year. The forecast period is 2025-2033, and the historical period analyzed is 2019-2024.
E-commerce App Market Composition & Trends
This section examines the competitive landscape, innovation drivers, regulatory influences, and market dynamics within the e-commerce app sector. The market is characterized by significant concentration, with key players like Amazon, Walmart, and Alibaba commanding substantial market share. However, emerging players like Meesho and SHEIN are rapidly gaining traction, fueled by innovative business models and targeted marketing strategies.
Market Concentration & Innovation:
- Market Share Distribution (2024): Amazon (xx%), Alibaba (xx%), Walmart (xx%), Others (xx%). Note: These percentages are predictions, not confirmed data.
- Innovation Catalysts: AI-powered personalization, augmented reality (AR) shopping experiences, and blockchain technology for enhanced security and transparency.
- Regulatory Landscape: Varying regulations across regions regarding data privacy, consumer protection, and antitrust concerns significantly impact market operations.
- Substitute Products: Traditional retail channels still pose a considerable threat, although the e-commerce app market continues to expand rapidly.
- End-User Profiles: The target audience comprises diverse demographics, with significant growth observed across age groups and geographical regions, driven by increased smartphone penetration and internet access.
- M&A Activities: The sector has witnessed numerous mergers and acquisitions in recent years, with total deal values exceeding $xx Million in the past five years (estimated). Notable transactions include [insert specific examples if available, otherwise use predicted examples, for example: a predicted acquisition of a smaller app developer by a larger player].
E-commerce App Market Industry Evolution
The e-commerce app market has experienced exponential growth since 2019, driven by technological advancements, shifting consumer preferences, and a surge in mobile commerce. From 2019 to 2024, the market witnessed a Compound Annual Growth Rate (CAGR) of xx%, with the trend projected to continue into the forecast period.
- Market Growth Trajectories: The market has shown consistent growth across key segments, including in-app purchases, advertisements, and other revenue streams. The growth in adoption rates of smartphones and mobile internet has been a significant contributing factor.
- Technological Advancements: The introduction of advanced features, including seamless payment gateways, personalized recommendations, and improved user interfaces, has enhanced the overall customer experience and significantly increased user engagement. The emergence of Web3 technology and its integration into e-commerce platforms is expected to transform future shopping experiences.
- Shifting Consumer Demands: Consumers are increasingly demanding personalized and convenient shopping experiences, pushing app developers to integrate innovative features to cater to this need. The growing preference for mobile-first shopping and the increasing usage of mobile payment options fuels market expansion.
Leading Regions, Countries, or Segments in E-commerce App Market
The e-commerce app market exhibits strong regional variations. Asia-Pacific currently dominates the market, with countries like India and China exhibiting exceptional growth. North America and Europe are also major markets. The In-app Purchases segment remains the largest revenue generator, followed by Advertisement and Other revenue streams.
Key Drivers:
Investment Trends: Significant venture capital investment in e-commerce app startups and established companies fuels innovation and market growth, especially in developing economies.
Regulatory Support: Supportive government policies and incentives in several regions promote e-commerce development, creating a conducive environment for the industry. Dominance Factors:
Asia-Pacific: High smartphone penetration, increasing internet access, and a large young population contribute to the region's market dominance. India's booming e-commerce sector, exemplified by the success of Meesho and Flipkart, exemplifies this trend.
In-app Purchases: This revenue model remains the most popular and lucrative, driven by the high conversion rates achieved through targeted promotions and user engagement strategies. The proliferation of subscription models has further fueled this segment's growth.
Android Platform: Android's global market share dominance translates to a larger user base for e-commerce apps, making it a crucial platform for expansion and revenue generation.
E-commerce App Market Product Innovations
Recent innovations in e-commerce apps focus on enhancing user experience through advanced features like AI-powered recommendations, augmented reality (AR) try-on features, personalized shopping experiences, and frictionless payment gateways. These innovations aim to provide greater convenience and engagement, boosting conversion rates and customer loyalty. Integration with social media platforms for shopping and live-streaming shopping events also represents significant advancements.
Propelling Factors for E-commerce App Market Growth
Several factors drive the growth of the e-commerce app market. These include:
- Technological advancements: Improved mobile technology, faster internet speeds, and the widespread adoption of smartphones fuel market expansion.
- Economic factors: Increased disposable incomes in developing economies coupled with changing consumer preferences towards online shopping are driving significant growth.
- Regulatory support: Government initiatives aimed at promoting digital commerce foster a favorable environment for industry growth.
Obstacles in the E-commerce App Market
Despite its potential, the e-commerce app market faces challenges. These include:
- Regulatory hurdles: Varying data privacy regulations and cross-border compliance issues pose significant operational challenges.
- Supply chain disruptions: Global supply chain issues can impact the availability of products and negatively affect sales.
- Intense competition: The market is highly competitive, with established players and new entrants constantly vying for market share.
Future Opportunities in E-commerce App Market
Future opportunities in the e-commerce app market lie in:
- Expansion into new markets: Untapped markets in developing economies present significant growth potential.
- Adoption of new technologies: Integrating innovative technologies, such as blockchain and AR/VR, can enhance user experience and create new revenue streams.
- Catering to evolving consumer trends: Responding to evolving consumer demands and preferences will be crucial for maintaining a competitive edge.
Major Players in the E-commerce App Market Ecosystem
- Amazon
- Meesho
- Shopify Inc
- Walmart
- SHEIN
- AJIO
- Tata Cliq
- eBay
- Alibaba com
- Etsy Inc
Key Developments in E-commerce App Market Industry
- October 2022: Flipkart launched Flipverse, a metaverse shopping experience, showcasing the integration of Web3 technologies in e-commerce.
- June 2022: eBay introduced eBay Live, a real-time interactive shopping platform, demonstrating the increasing popularity of live-streaming commerce.
Strategic E-commerce App Market Forecast
The e-commerce app market is poised for continued robust growth, driven by technological innovation, changing consumer behavior, and expanding market penetration in developing economies. The integration of advanced technologies like AI and AR/VR will further enhance user experience and drive revenue growth. The market is expected to witness a CAGR of xx% during the forecast period (2025-2033), reaching a projected value of $xx Million by 2033. The continued rise of mobile commerce and the expansion of e-commerce into new markets will be key drivers of this growth.
E-commerce App Market Segmentation
-
1. Type
- 1.1. In-app Purchases
- 1.2. Advertisement
- 1.3. Other Types
-
2. Platform
- 2.1. Android
- 2.2. iPhone
E-commerce App Market Segmentation By Geography
- 1. North America
- 2. Europe
- 3. Asia Pacific
- 4. Latin America
- 5. Middle East and Africa
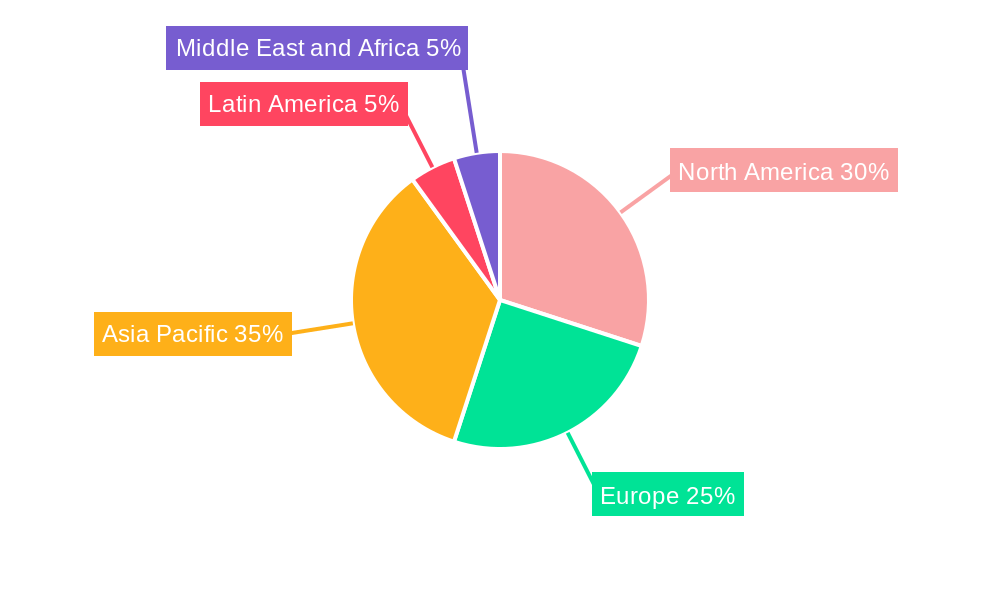
E-commerce App Market Regional Market Share
Geographic Coverage of E-commerce App Market
E-commerce App Market REPORT HIGHLIGHTS
| Aspects | Details |
|---|---|
| Study Period | 2020-2034 |
| Base Year | 2025 |
| Estimated Year | 2026 |
| Forecast Period | 2026-2034 |
| Historical Period | 2020-2025 |
| Growth Rate | CAGR of 9.60% from 2020-2034 |
| Segmentation |
|
Table of Contents
- 1. Introduction
- 1.1. Research Scope
- 1.2. Market Segmentation
- 1.3. Research Methodology
- 1.4. Definitions and Assumptions
- 2. Executive Summary
- 2.1. Introduction
- 3. Market Dynamics
- 3.1. Introduction
- 3.2. Market Drivers
- 3.2.1. Utilizing Emerging Technologies Drives Market Growth; Huge Penetration of Smartphones in the Market
- 3.3. Market Restrains
- 3.3.1. Consumers Security Related Concerns
- 3.4. Market Trends
- 3.4.1. Use of Emerging Technologies Aids Market Growth
- 4. Market Factor Analysis
- 4.1. Porters Five Forces
- 4.2. Supply/Value Chain
- 4.3. PESTEL analysis
- 4.4. Market Entropy
- 4.5. Patent/Trademark Analysis
- 5. Global E-commerce App Market Analysis, Insights and Forecast, 2020-2032
- 5.1. Market Analysis, Insights and Forecast - by Type
- 5.1.1. In-app Purchases
- 5.1.2. Advertisement
- 5.1.3. Other Types
- 5.2. Market Analysis, Insights and Forecast - by Platform
- 5.2.1. Android
- 5.2.2. iPhone
- 5.3. Market Analysis, Insights and Forecast - by Region
- 5.3.1. North America
- 5.3.2. Europe
- 5.3.3. Asia Pacific
- 5.3.4. Latin America
- 5.3.5. Middle East and Africa
- 5.1. Market Analysis, Insights and Forecast - by Type
- 6. North America E-commerce App Market Analysis, Insights and Forecast, 2020-2032
- 6.1. Market Analysis, Insights and Forecast - by Type
- 6.1.1. In-app Purchases
- 6.1.2. Advertisement
- 6.1.3. Other Types
- 6.2. Market Analysis, Insights and Forecast - by Platform
- 6.2.1. Android
- 6.2.2. iPhone
- 6.1. Market Analysis, Insights and Forecast - by Type
- 7. Europe E-commerce App Market Analysis, Insights and Forecast, 2020-2032
- 7.1. Market Analysis, Insights and Forecast - by Type
- 7.1.1. In-app Purchases
- 7.1.2. Advertisement
- 7.1.3. Other Types
- 7.2. Market Analysis, Insights and Forecast - by Platform
- 7.2.1. Android
- 7.2.2. iPhone
- 7.1. Market Analysis, Insights and Forecast - by Type
- 8. Asia Pacific E-commerce App Market Analysis, Insights and Forecast, 2020-2032
- 8.1. Market Analysis, Insights and Forecast - by Type
- 8.1.1. In-app Purchases
- 8.1.2. Advertisement
- 8.1.3. Other Types
- 8.2. Market Analysis, Insights and Forecast - by Platform
- 8.2.1. Android
- 8.2.2. iPhone
- 8.1. Market Analysis, Insights and Forecast - by Type
- 9. Latin America E-commerce App Market Analysis, Insights and Forecast, 2020-2032
- 9.1. Market Analysis, Insights and Forecast - by Type
- 9.1.1. In-app Purchases
- 9.1.2. Advertisement
- 9.1.3. Other Types
- 9.2. Market Analysis, Insights and Forecast - by Platform
- 9.2.1. Android
- 9.2.2. iPhone
- 9.1. Market Analysis, Insights and Forecast - by Type
- 10. Middle East and Africa E-commerce App Market Analysis, Insights and Forecast, 2020-2032
- 10.1. Market Analysis, Insights and Forecast - by Type
- 10.1.1. In-app Purchases
- 10.1.2. Advertisement
- 10.1.3. Other Types
- 10.2. Market Analysis, Insights and Forecast - by Platform
- 10.2.1. Android
- 10.2.2. iPhone
- 10.1. Market Analysis, Insights and Forecast - by Type
- 11. Competitive Analysis
- 11.1. Global Market Share Analysis 2025
- 11.2. Company Profiles
- 11.2.1 Amazon
- 11.2.1.1. Overview
- 11.2.1.2. Products
- 11.2.1.3. SWOT Analysis
- 11.2.1.4. Recent Developments
- 11.2.1.5. Financials (Based on Availability)
- 11.2.2 Meesho
- 11.2.2.1. Overview
- 11.2.2.2. Products
- 11.2.2.3. SWOT Analysis
- 11.2.2.4. Recent Developments
- 11.2.2.5. Financials (Based on Availability)
- 11.2.3 Shopify Inc
- 11.2.3.1. Overview
- 11.2.3.2. Products
- 11.2.3.3. SWOT Analysis
- 11.2.3.4. Recent Developments
- 11.2.3.5. Financials (Based on Availability)
- 11.2.4 Walmart
- 11.2.4.1. Overview
- 11.2.4.2. Products
- 11.2.4.3. SWOT Analysis
- 11.2.4.4. Recent Developments
- 11.2.4.5. Financials (Based on Availability)
- 11.2.5 SHEIN
- 11.2.5.1. Overview
- 11.2.5.2. Products
- 11.2.5.3. SWOT Analysis
- 11.2.5.4. Recent Developments
- 11.2.5.5. Financials (Based on Availability)
- 11.2.6 AJIO
- 11.2.6.1. Overview
- 11.2.6.2. Products
- 11.2.6.3. SWOT Analysis
- 11.2.6.4. Recent Developments
- 11.2.6.5. Financials (Based on Availability)
- 11.2.7 Tata Cliq
- 11.2.7.1. Overview
- 11.2.7.2. Products
- 11.2.7.3. SWOT Analysis
- 11.2.7.4. Recent Developments
- 11.2.7.5. Financials (Based on Availability)
- 11.2.8 eBay
- 11.2.8.1. Overview
- 11.2.8.2. Products
- 11.2.8.3. SWOT Analysis
- 11.2.8.4. Recent Developments
- 11.2.8.5. Financials (Based on Availability)
- 11.2.9 Alibaba com
- 11.2.9.1. Overview
- 11.2.9.2. Products
- 11.2.9.3. SWOT Analysis
- 11.2.9.4. Recent Developments
- 11.2.9.5. Financials (Based on Availability)
- 11.2.10 Etsy Inc
- 11.2.10.1. Overview
- 11.2.10.2. Products
- 11.2.10.3. SWOT Analysis
- 11.2.10.4. Recent Developments
- 11.2.10.5. Financials (Based on Availability)
- 11.2.1 Amazon
List of Figures
- Figure 1: Global E-commerce App Market Revenue Breakdown (Million, %) by Region 2025 & 2033
- Figure 2: Global E-commerce App Market Volume Breakdown (K Unit, %) by Region 2025 & 2033
- Figure 3: North America E-commerce App Market Revenue (Million), by Type 2025 & 2033
- Figure 4: North America E-commerce App Market Volume (K Unit), by Type 2025 & 2033
- Figure 5: North America E-commerce App Market Revenue Share (%), by Type 2025 & 2033
- Figure 6: North America E-commerce App Market Volume Share (%), by Type 2025 & 2033
- Figure 7: North America E-commerce App Market Revenue (Million), by Platform 2025 & 2033
- Figure 8: North America E-commerce App Market Volume (K Unit), by Platform 2025 & 2033
- Figure 9: North America E-commerce App Market Revenue Share (%), by Platform 2025 & 2033
- Figure 10: North America E-commerce App Market Volume Share (%), by Platform 2025 & 2033
- Figure 11: North America E-commerce App Market Revenue (Million), by Country 2025 & 2033
- Figure 12: North America E-commerce App Market Volume (K Unit), by Country 2025 & 2033
- Figure 13: North America E-commerce App Market Revenue Share (%), by Country 2025 & 2033
- Figure 14: North America E-commerce App Market Volume Share (%), by Country 2025 & 2033
- Figure 15: Europe E-commerce App Market Revenue (Million), by Type 2025 & 2033
- Figure 16: Europe E-commerce App Market Volume (K Unit), by Type 2025 & 2033
- Figure 17: Europe E-commerce App Market Revenue Share (%), by Type 2025 & 2033
- Figure 18: Europe E-commerce App Market Volume Share (%), by Type 2025 & 2033
- Figure 19: Europe E-commerce App Market Revenue (Million), by Platform 2025 & 2033
- Figure 20: Europe E-commerce App Market Volume (K Unit), by Platform 2025 & 2033
- Figure 21: Europe E-commerce App Market Revenue Share (%), by Platform 2025 & 2033
- Figure 22: Europe E-commerce App Market Volume Share (%), by Platform 2025 & 2033
- Figure 23: Europe E-commerce App Market Revenue (Million), by Country 2025 & 2033
- Figure 24: Europe E-commerce App Market Volume (K Unit), by Country 2025 & 2033
- Figure 25: Europe E-commerce App Market Revenue Share (%), by Country 2025 & 2033
- Figure 26: Europe E-commerce App Market Volume Share (%), by Country 2025 & 2033
- Figure 27: Asia Pacific E-commerce App Market Revenue (Million), by Type 2025 & 2033
- Figure 28: Asia Pacific E-commerce App Market Volume (K Unit), by Type 2025 & 2033
- Figure 29: Asia Pacific E-commerce App Market Revenue Share (%), by Type 2025 & 2033
- Figure 30: Asia Pacific E-commerce App Market Volume Share (%), by Type 2025 & 2033
- Figure 31: Asia Pacific E-commerce App Market Revenue (Million), by Platform 2025 & 2033
- Figure 32: Asia Pacific E-commerce App Market Volume (K Unit), by Platform 2025 & 2033
- Figure 33: Asia Pacific E-commerce App Market Revenue Share (%), by Platform 2025 & 2033
- Figure 34: Asia Pacific E-commerce App Market Volume Share (%), by Platform 2025 & 2033
- Figure 35: Asia Pacific E-commerce App Market Revenue (Million), by Country 2025 & 2033
- Figure 36: Asia Pacific E-commerce App Market Volume (K Unit), by Country 2025 & 2033
- Figure 37: Asia Pacific E-commerce App Market Revenue Share (%), by Country 2025 & 2033
- Figure 38: Asia Pacific E-commerce App Market Volume Share (%), by Country 2025 & 2033
- Figure 39: Latin America E-commerce App Market Revenue (Million), by Type 2025 & 2033
- Figure 40: Latin America E-commerce App Market Volume (K Unit), by Type 2025 & 2033
- Figure 41: Latin America E-commerce App Market Revenue Share (%), by Type 2025 & 2033
- Figure 42: Latin America E-commerce App Market Volume Share (%), by Type 2025 & 2033
- Figure 43: Latin America E-commerce App Market Revenue (Million), by Platform 2025 & 2033
- Figure 44: Latin America E-commerce App Market Volume (K Unit), by Platform 2025 & 2033
- Figure 45: Latin America E-commerce App Market Revenue Share (%), by Platform 2025 & 2033
- Figure 46: Latin America E-commerce App Market Volume Share (%), by Platform 2025 & 2033
- Figure 47: Latin America E-commerce App Market Revenue (Million), by Country 2025 & 2033
- Figure 48: Latin America E-commerce App Market Volume (K Unit), by Country 2025 & 2033
- Figure 49: Latin America E-commerce App Market Revenue Share (%), by Country 2025 & 2033
- Figure 50: Latin America E-commerce App Market Volume Share (%), by Country 2025 & 2033
- Figure 51: Middle East and Africa E-commerce App Market Revenue (Million), by Type 2025 & 2033
- Figure 52: Middle East and Africa E-commerce App Market Volume (K Unit), by Type 2025 & 2033
- Figure 53: Middle East and Africa E-commerce App Market Revenue Share (%), by Type 2025 & 2033
- Figure 54: Middle East and Africa E-commerce App Market Volume Share (%), by Type 2025 & 2033
- Figure 55: Middle East and Africa E-commerce App Market Revenue (Million), by Platform 2025 & 2033
- Figure 56: Middle East and Africa E-commerce App Market Volume (K Unit), by Platform 2025 & 2033
- Figure 57: Middle East and Africa E-commerce App Market Revenue Share (%), by Platform 2025 & 2033
- Figure 58: Middle East and Africa E-commerce App Market Volume Share (%), by Platform 2025 & 2033
- Figure 59: Middle East and Africa E-commerce App Market Revenue (Million), by Country 2025 & 2033
- Figure 60: Middle East and Africa E-commerce App Market Volume (K Unit), by Country 2025 & 2033
- Figure 61: Middle East and Africa E-commerce App Market Revenue Share (%), by Country 2025 & 2033
- Figure 62: Middle East and Africa E-commerce App Market Volume Share (%), by Country 2025 & 2033
List of Tables
- Table 1: Global E-commerce App Market Revenue Million Forecast, by Type 2020 & 2033
- Table 2: Global E-commerce App Market Volume K Unit Forecast, by Type 2020 & 2033
- Table 3: Global E-commerce App Market Revenue Million Forecast, by Platform 2020 & 2033
- Table 4: Global E-commerce App Market Volume K Unit Forecast, by Platform 2020 & 2033
- Table 5: Global E-commerce App Market Revenue Million Forecast, by Region 2020 & 2033
- Table 6: Global E-commerce App Market Volume K Unit Forecast, by Region 2020 & 2033
- Table 7: Global E-commerce App Market Revenue Million Forecast, by Type 2020 & 2033
- Table 8: Global E-commerce App Market Volume K Unit Forecast, by Type 2020 & 2033
- Table 9: Global E-commerce App Market Revenue Million Forecast, by Platform 2020 & 2033
- Table 10: Global E-commerce App Market Volume K Unit Forecast, by Platform 2020 & 2033
- Table 11: Global E-commerce App Market Revenue Million Forecast, by Country 2020 & 2033
- Table 12: Global E-commerce App Market Volume K Unit Forecast, by Country 2020 & 2033
- Table 13: Global E-commerce App Market Revenue Million Forecast, by Type 2020 & 2033
- Table 14: Global E-commerce App Market Volume K Unit Forecast, by Type 2020 & 2033
- Table 15: Global E-commerce App Market Revenue Million Forecast, by Platform 2020 & 2033
- Table 16: Global E-commerce App Market Volume K Unit Forecast, by Platform 2020 & 2033
- Table 17: Global E-commerce App Market Revenue Million Forecast, by Country 2020 & 2033
- Table 18: Global E-commerce App Market Volume K Unit Forecast, by Country 2020 & 2033
- Table 19: Global E-commerce App Market Revenue Million Forecast, by Type 2020 & 2033
- Table 20: Global E-commerce App Market Volume K Unit Forecast, by Type 2020 & 2033
- Table 21: Global E-commerce App Market Revenue Million Forecast, by Platform 2020 & 2033
- Table 22: Global E-commerce App Market Volume K Unit Forecast, by Platform 2020 & 2033
- Table 23: Global E-commerce App Market Revenue Million Forecast, by Country 2020 & 2033
- Table 24: Global E-commerce App Market Volume K Unit Forecast, by Country 2020 & 2033
- Table 25: Global E-commerce App Market Revenue Million Forecast, by Type 2020 & 2033
- Table 26: Global E-commerce App Market Volume K Unit Forecast, by Type 2020 & 2033
- Table 27: Global E-commerce App Market Revenue Million Forecast, by Platform 2020 & 2033
- Table 28: Global E-commerce App Market Volume K Unit Forecast, by Platform 2020 & 2033
- Table 29: Global E-commerce App Market Revenue Million Forecast, by Country 2020 & 2033
- Table 30: Global E-commerce App Market Volume K Unit Forecast, by Country 2020 & 2033
- Table 31: Global E-commerce App Market Revenue Million Forecast, by Type 2020 & 2033
- Table 32: Global E-commerce App Market Volume K Unit Forecast, by Type 2020 & 2033
- Table 33: Global E-commerce App Market Revenue Million Forecast, by Platform 2020 & 2033
- Table 34: Global E-commerce App Market Volume K Unit Forecast, by Platform 2020 & 2033
- Table 35: Global E-commerce App Market Revenue Million Forecast, by Country 2020 & 2033
- Table 36: Global E-commerce App Market Volume K Unit Forecast, by Country 2020 & 2033
Frequently Asked Questions
1. What is the projected Compound Annual Growth Rate (CAGR) of the E-commerce App Market?
The projected CAGR is approximately 9.60%.
2. Which companies are prominent players in the E-commerce App Market?
Key companies in the market include Amazon, Meesho, Shopify Inc, Walmart, SHEIN, AJIO, Tata Cliq, eBay, Alibaba com, Etsy Inc.
3. What are the main segments of the E-commerce App Market?
The market segments include Type, Platform.
4. Can you provide details about the market size?
The market size is estimated to be USD XX Million as of 2022.
5. What are some drivers contributing to market growth?
Utilizing Emerging Technologies Drives Market Growth; Huge Penetration of Smartphones in the Market.
6. What are the notable trends driving market growth?
Use of Emerging Technologies Aids Market Growth.
7. Are there any restraints impacting market growth?
Consumers Security Related Concerns.
8. Can you provide examples of recent developments in the market?
In October 2022, Flipkart, a Walmart subsidiary and a major Indian online retailer, introduced a metaverse purchasing experience. The latest venture from the Indian e-commerce giant experiments with web3 solutions to enhance its customer experience and offer them a more interactive way to find and shop new products. The business is launching the metaverse service, Flipverse, in collaboration with eDAO, a Polygon-incubated business.
9. What pricing options are available for accessing the report?
Pricing options include single-user, multi-user, and enterprise licenses priced at USD 4750, USD 5250, and USD 8750 respectively.
10. Is the market size provided in terms of value or volume?
The market size is provided in terms of value, measured in Million and volume, measured in K Unit.
11. Are there any specific market keywords associated with the report?
Yes, the market keyword associated with the report is "E-commerce App Market," which aids in identifying and referencing the specific market segment covered.
12. How do I determine which pricing option suits my needs best?
The pricing options vary based on user requirements and access needs. Individual users may opt for single-user licenses, while businesses requiring broader access may choose multi-user or enterprise licenses for cost-effective access to the report.
13. Are there any additional resources or data provided in the E-commerce App Market report?
While the report offers comprehensive insights, it's advisable to review the specific contents or supplementary materials provided to ascertain if additional resources or data are available.
14. How can I stay updated on further developments or reports in the E-commerce App Market?
To stay informed about further developments, trends, and reports in the E-commerce App Market, consider subscribing to industry newsletters, following relevant companies and organizations, or regularly checking reputable industry news sources and publications.
Methodology
Step 1 - Identification of Relevant Samples Size from Population Database


Step 2 - Approaches for Defining Global Market Size (Value, Volume* & Price*)

Note*: In applicable scenarios
Step 3 - Data Sources
Primary Research
- Web Analytics
- Survey Reports
- Research Institute
- Latest Research Reports
- Opinion Leaders
Secondary Research
- Annual Reports
- White Paper
- Latest Press Release
- Industry Association
- Paid Database
- Investor Presentations

Step 4 - Data Triangulation
Involves using different sources of information in order to increase the validity of a study
These sources are likely to be stakeholders in a program - participants, other researchers, program staff, other community members, and so on.
Then we put all data in single framework & apply various statistical tools to find out the dynamic on the market.
During the analysis stage, feedback from the stakeholder groups would be compared to determine areas of agreement as well as areas of divergence