

Key Insights
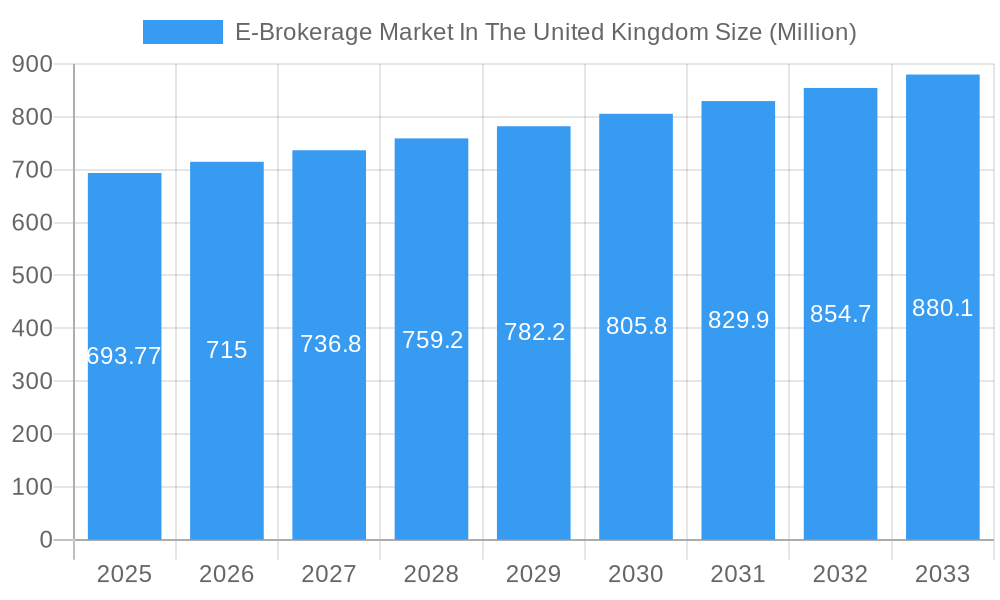
The UK e-brokerage market, valued at £693.77 million in 2025, is projected to experience steady growth, driven primarily by increasing mobile penetration, the rise of fintech innovations offering user-friendly platforms, and a growing interest in online investing among younger demographics. The market's Compound Annual Growth Rate (CAGR) of 2.83% from 2025 to 2033 reflects a consistent, albeit moderate, expansion. This growth is further fueled by regulatory advancements promoting transparency and investor protection, alongside competitive pricing strategies adopted by established players like eToro and IG Group, and newer entrants vying for market share. However, challenges remain, including concerns over market volatility, cybersecurity threats, and the potential for regulatory changes that could impact operating costs and profitability.
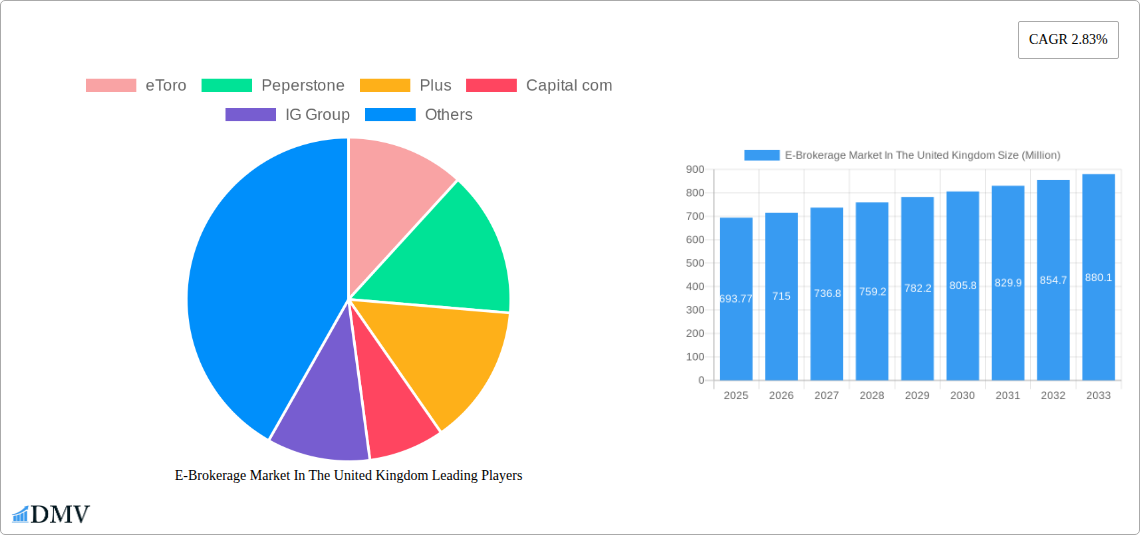
E-Brokerage Market In The United Kingdom Market Size (In Million)
The competitive landscape is dynamic, with both established international players and localized UK firms competing for clients. The success of individual e-brokerage firms hinges on their ability to deliver a seamless user experience, offer competitive pricing and trading fees, provide access to a diverse range of investment instruments, and maintain strong cybersecurity measures to build trust and protect client assets. Future growth will likely be influenced by the integration of artificial intelligence (AI) and advanced analytics to enhance personalized investment advice and risk management tools. The continued adoption of mobile trading applications and the expansion into new investment products, such as cryptocurrencies and fractional shares, will also significantly shape the market's trajectory in the coming years. The period from 2019-2024 provides a strong foundation for the forecast to 2033, showcasing consistent growth throughout that period that is expected to continue.
E-Brokerage Market In The United Kingdom Company Market Share
E-Brokerage Market in the United Kingdom: A Comprehensive Market Report (2019-2033)
This insightful report provides a detailed analysis of the UK e-brokerage market, offering a comprehensive overview of its current state, future trajectory, and key players. The study period covers 2019-2033, with a base year of 2025 and a forecast period of 2025-2033. We delve into market composition, technological advancements, competitive landscape, and regulatory influences, providing stakeholders with critical data for informed decision-making. The report incorporates valuable insights on market concentration, M&A activities, and emerging opportunities, with a specific focus on leading companies like eToro, Peperstone, Plus500, Capital.com, IG Group, City Index, Robinhood, AvaTrade, Monesta Markets, and Stocktrade. The report's findings are crucial for investors, businesses, and policymakers seeking a deep understanding of this dynamic market. The total market value is estimated at £XX Million in 2025 and projected to reach £XX Million by 2033.
E-Brokerage Market In The United Kingdom Market Composition & Trends
This section analyzes the UK e-brokerage market's structure, highlighting key trends influencing its evolution. We examine market concentration, evaluating the market share distribution amongst leading players such as eToro, IG Group, and Plus500. The report further explores innovation catalysts driving market expansion, including technological advancements, regulatory changes, and evolving consumer preferences. We also consider the impact of substitute products and the changing end-user profile. Finally, we examine recent M&A activities, including deal values and their implications for market consolidation. The analysis incorporates data from the historical period (2019-2024) to establish a strong foundation for the forecast.
- Market Concentration: The UK e-brokerage market exhibits a moderately concentrated structure, with the top five players holding approximately XX% of the market share in 2025.
- Innovation Catalysts: AI-powered trading tools, mobile-first platforms, and fractional share trading are key innovation drivers.
- Regulatory Landscape: FCA regulations significantly influence market operations and player behavior.
- Substitute Products: Traditional brokerage services and other investment options pose competitive pressures.
- End-User Profile: Millennials and Gen Z are increasingly adopting online brokerage platforms.
- M&A Activity: The Cenkos-FinnCap merger (March 2023), valued at approximately £XX Million, exemplifies the ongoing consolidation within the sector. Further significant M&A activity is anticipated, with projected deal values reaching £XX Million annually by 2030.
E-Brokerage Market In The United Kingdom Industry Evolution
This section offers a comprehensive analysis of the UK e-brokerage market's dynamic evolution, spanning from 2019 to an extended forecast reaching 2033. We meticulously track market growth trajectories, revealing a Compound Annual Growth Rate (CAGR) of [Insert specific CAGR for 2019-2024] during the historical period (2019-2024) and a projected CAGR of [Insert specific CAGR for 2025-2033] during the forecast period (2025-2033). The report delves into the profound impact of accelerating technological advancements, such as the sophisticated rise of AI-driven robo-advisors and advanced algorithmic trading strategies, on shaping core market dynamics. Concurrently, we conduct a thorough exploration of evolving consumer demands, highlighting the increasing preference for accessible commission-free trading models and highly personalized, tailored investment solutions. The strategic entrance of disruptive new players, exemplified by the July 2023 debut of Public, is meticulously analyzed for its influence on intensifying competition and potential shifts in market share. This section further scrutinizes the adoption rates of various transformative technological innovations by established and emerging brokerage firms, assessing their subsequent and significant influence on overall market growth. Rich data points and insightful metrics illustrating the market's sustained expansion and the rapid adoption rates of cutting-edge technologies are seamlessly integrated throughout this detailed analysis.
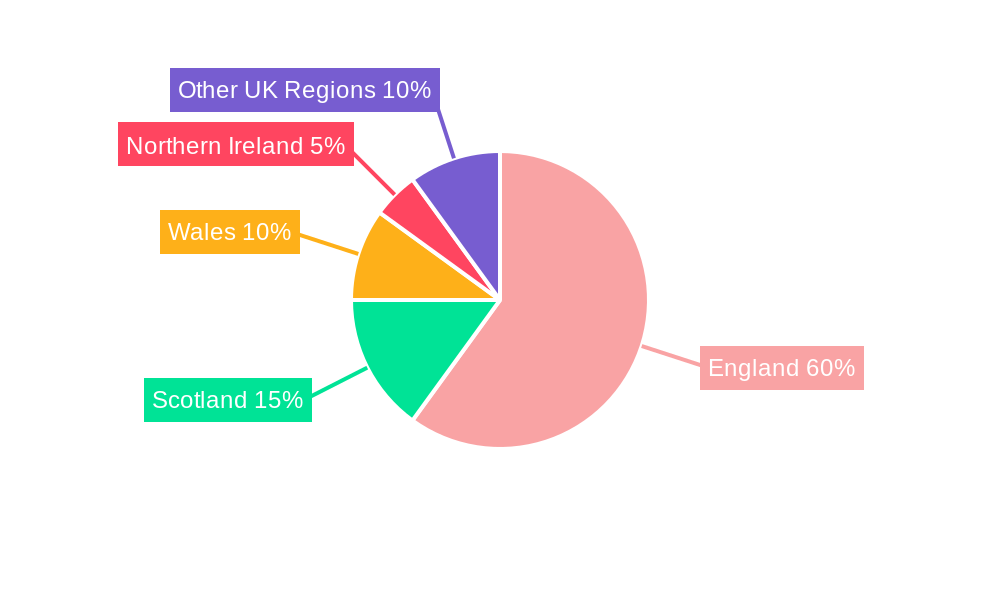
Leading Regions, Countries, or Segments in E-Brokerage Market In The United Kingdom
The UK e-brokerage market is largely concentrated within England, driven primarily by the high concentration of financial institutions and a sophisticated investor base. London, in particular, stands as a significant hub.
- Key Drivers for England's Dominance:
- High concentration of financial institutions and investment professionals.
- A robust regulatory framework promoting market stability and investor confidence.
- High levels of digital literacy and tech adoption among investors.
- Strong financial literacy and a culture of active investing.
London's dominance is further cemented by its status as a global financial center, attracting both domestic and international investment. The presence of numerous financial technology companies and a supportive regulatory environment further contributes to the region's leading position. The concentration of wealth and higher per capita income also contribute to increased demand for e-brokerage services within this region.
E-Brokerage Market In The United Kingdom Product Innovations
The UK e-brokerage market is experiencing a wave of groundbreaking innovations. Key advancements include the widespread introduction of truly commission-free trading platforms, the integration of sophisticated AI-powered portfolio management tools designed for optimal performance, and the continuous enhancement of intuitive and feature-rich mobile trading applications. These advanced platforms now offer a compelling suite of features, including highly personalized investment advice tailored to individual risk profiles, advanced and dynamic charting capabilities for in-depth market analysis, and access to real-time market data streams, collectively enhancing the overall trading experience and significantly attracting a broader and more diverse range of investors. The burgeoning popularity of fractional share trading is also a pivotal contributor to product innovation, dramatically improving market accessibility for a wider investor demographic. These relentless innovations are not merely incremental improvements; they represent a significant and sustainable competitive advantage for forward-thinking providers, demonstrably enhancing customer engagement, fostering loyalty, and attracting an ever-widening user base.
Propelling Factors for E-Brokerage Market In The United Kingdom Growth
A confluence of powerful factors is significantly fueling the robust growth of the UK e-brokerage market. Paramount among these are ongoing technological advancements, most notably the development of exceptionally user-friendly mobile applications and the deployment of increasingly sophisticated and powerful trading platforms. The escalating affordability of online trading, directly coupled with the surging popularity of commission-free trading models, also plays an indispensable role in market expansion. Furthermore, a consistently favorable and evolving regulatory environment, alongside supportive government policies designed to foster financial innovation, actively encourages sustained market expansion. The palpable increase in financial literacy and the growing technological proficiency observed among younger generations of investors are also identified as crucial and ongoing contributors to the market's upward trajectory.
Obstacles in the E-Brokerage Market In The United Kingdom Market
Despite significant growth, the UK e-brokerage market faces challenges. Stringent regulatory compliance requirements pose a substantial hurdle for businesses. Cybersecurity threats and data breaches represent a major concern, potentially impacting investor trust. Intense competition, both from established players and new entrants, puts pressure on profit margins. Furthermore, economic downturns can lead to decreased investor activity, impacting market growth.
Future Opportunities in E-Brokerage Market In The United Kingdom
The UK e-brokerage market presents numerous opportunities. Expansion into underserved demographics, such as those with lower investment capital, holds significant potential. The integration of innovative technologies, such as blockchain and artificial intelligence, can enhance platform functionality and attract new investors. The growing popularity of ESG investing presents an opportunity for brokers to offer specialized products and services.
Major Players in the E-Brokerage Market In The United Kingdom Ecosystem
- eToro
- Pepperstone
- Plus500
- Capital.com
- IG Group
- City Index
- Robinhood
- AvaTrade
- Monesta Markets
- Stocktrade
- [Consider adding other prominent emerging players if applicable]
Key Developments in E-Brokerage Market In The United Kingdom Industry
- March 2023: Cenkos merges with FinnCap, creating a stronger entity with increased client base.
- July 2023: Public, an American brokerage firm, launches in the UK, offering commission-free trading on US stocks.
Strategic E-Brokerage Market In The United Kingdom Market Forecast
The UK e-brokerage market is strategically poised for sustained and accelerated growth, propelled by the relentless pace of technological innovation, a demonstrable increase in broad-based investor participation, and the continued presence of supportive and adaptive regulatory frameworks. Emerging opportunities within the domain of highly personalized investment solutions, alongside the seamless integration of cutting-edge and disruptive technologies, are set to further shape and redefine market dynamics. The market's future trajectory unequivocally suggests a period of robust expansion, characterized by ongoing strategic consolidation among established players and the exciting emergence of novel, agile new entrants that will undoubtedly contribute to a dynamic and intensely competitive landscape.
E-Brokerage Market In The United Kingdom Segmentation
-
1. Investor
- 1.1. Retail
- 1.2. Institutional
-
2. Operation
- 2.1. Domestic
- 2.2. Foreign
E-Brokerage Market In The United Kingdom Segmentation By Geography
-
1. North America
- 1.1. United States
- 1.2. Canada
- 1.3. Mexico
-
2. South America
- 2.1. Brazil
- 2.2. Argentina
- 2.3. Rest of South America
-
3. Europe
- 3.1. United Kingdom
- 3.2. Germany
- 3.3. France
- 3.4. Italy
- 3.5. Spain
- 3.6. Russia
- 3.7. Benelux
- 3.8. Nordics
- 3.9. Rest of Europe
-
4. Middle East & Africa
- 4.1. Turkey
- 4.2. Israel
- 4.3. GCC
- 4.4. North Africa
- 4.5. South Africa
- 4.6. Rest of Middle East & Africa
-
5. Asia Pacific
- 5.1. China
- 5.2. India
- 5.3. Japan
- 5.4. South Korea
- 5.5. ASEAN
- 5.6. Oceania
- 5.7. Rest of Asia Pacific
E-Brokerage Market In The United Kingdom Regional Market Share
Geographic Coverage of E-Brokerage Market In The United Kingdom
E-Brokerage Market In The United Kingdom REPORT HIGHLIGHTS
| Aspects | Details |
|---|---|
| Study Period | 2020-2034 |
| Base Year | 2025 |
| Estimated Year | 2026 |
| Forecast Period | 2026-2034 |
| Historical Period | 2020-2025 |
| Growth Rate | CAGR of 2.83% from 2020-2034 |
| Segmentation |
|
Table of Contents
- 1. Introduction
- 1.1. Research Scope
- 1.2. Market Segmentation
- 1.3. Research Objective
- 1.4. Definitions and Assumptions
- 2. Executive Summary
- 2.1. Market Snapshot
- 3. Market Dynamics
- 3.1. Market Drivers
- 3.2. Market Restrains
- 3.3. Market Trends
- 3.4. Market Opportunities
- 4. Market Factor Analysis
- 4.1. Porters Five Forces
- 4.1.1. Bargaining Power of Suppliers
- 4.1.2. Bargaining Power of Buyers
- 4.1.3. Threat of New Entrants
- 4.1.4. Threat of Substitutes
- 4.1.5. Competitive Rivalry
- 4.2. PESTEL analysis
- 4.3. BCG Analysis
- 4.3.1. Stars (High Growth, High Market Share)
- 4.3.2. Cash Cows (Low Growth, High Market Share)
- 4.3.3. Question Mark (High Growth, Low Market Share)
- 4.3.4. Dogs (Low Growth, Low Market Share)
- 4.4. Ansoff Matrix Analysis
- 4.5. Supply Chain Analysis
- 4.6. Regulatory Landscape
- 4.7. Current Market Potential and Opportunity Assessment (TAM–SAM–SOM Framework)
- 4.8. DMV Analyst Note
- 4.1. Porters Five Forces
- 5. Market Analysis, Insights and Forecast 2021-2033
- 5.1. Market Analysis, Insights and Forecast - by Investor
- 5.1.1. Retail
- 5.1.2. Institutional
- 5.2. Market Analysis, Insights and Forecast - by Operation
- 5.2.1. Domestic
- 5.2.2. Foreign
- 5.3. Market Analysis, Insights and Forecast - by Region
- 5.3.1. North America
- 5.3.2. South America
- 5.3.3. Europe
- 5.3.4. Middle East & Africa
- 5.3.5. Asia Pacific
- 5.1. Market Analysis, Insights and Forecast - by Investor
- 6. Global E-Brokerage Market In The United Kingdom Analysis, Insights and Forecast, 2021-2033
- 6.1. Market Analysis, Insights and Forecast - by Investor
- 6.1.1. Retail
- 6.1.2. Institutional
- 6.2. Market Analysis, Insights and Forecast - by Operation
- 6.2.1. Domestic
- 6.2.2. Foreign
- 6.1. Market Analysis, Insights and Forecast - by Investor
- 7. North America E-Brokerage Market In The United Kingdom Analysis, Insights and Forecast, 2020-2032
- 7.1. Market Analysis, Insights and Forecast - by Investor
- 7.1.1. Retail
- 7.1.2. Institutional
- 7.2. Market Analysis, Insights and Forecast - by Operation
- 7.2.1. Domestic
- 7.2.2. Foreign
- 7.1. Market Analysis, Insights and Forecast - by Investor
- 8. South America E-Brokerage Market In The United Kingdom Analysis, Insights and Forecast, 2020-2032
- 8.1. Market Analysis, Insights and Forecast - by Investor
- 8.1.1. Retail
- 8.1.2. Institutional
- 8.2. Market Analysis, Insights and Forecast - by Operation
- 8.2.1. Domestic
- 8.2.2. Foreign
- 8.1. Market Analysis, Insights and Forecast - by Investor
- 9. Europe E-Brokerage Market In The United Kingdom Analysis, Insights and Forecast, 2020-2032
- 9.1. Market Analysis, Insights and Forecast - by Investor
- 9.1.1. Retail
- 9.1.2. Institutional
- 9.2. Market Analysis, Insights and Forecast - by Operation
- 9.2.1. Domestic
- 9.2.2. Foreign
- 9.1. Market Analysis, Insights and Forecast - by Investor
- 10. Middle East & Africa E-Brokerage Market In The United Kingdom Analysis, Insights and Forecast, 2020-2032
- 10.1. Market Analysis, Insights and Forecast - by Investor
- 10.1.1. Retail
- 10.1.2. Institutional
- 10.2. Market Analysis, Insights and Forecast - by Operation
- 10.2.1. Domestic
- 10.2.2. Foreign
- 10.1. Market Analysis, Insights and Forecast - by Investor
- 11. Asia Pacific E-Brokerage Market In The United Kingdom Analysis, Insights and Forecast, 2020-2032
- 11.1. Market Analysis, Insights and Forecast - by Investor
- 11.1.1. Retail
- 11.1.2. Institutional
- 11.2. Market Analysis, Insights and Forecast - by Operation
- 11.2.1. Domestic
- 11.2.2. Foreign
- 11.1. Market Analysis, Insights and Forecast - by Investor
- 12. Competitive Analysis
- 12.1. Company Profiles
- 12.1.1 eToro
- 12.1.1.1. Company Overview
- 12.1.1.2. Products
- 12.1.1.3. Company Financials
- 12.1.1.4. SWOT Analysis
- 12.1.2 Peperstone
- 12.1.2.1. Company Overview
- 12.1.2.2. Products
- 12.1.2.3. Company Financials
- 12.1.2.4. SWOT Analysis
- 12.1.3 Plus
- 12.1.3.1. Company Overview
- 12.1.3.2. Products
- 12.1.3.3. Company Financials
- 12.1.3.4. SWOT Analysis
- 12.1.4 Capital com
- 12.1.4.1. Company Overview
- 12.1.4.2. Products
- 12.1.4.3. Company Financials
- 12.1.4.4. SWOT Analysis
- 12.1.5 IG Group
- 12.1.5.1. Company Overview
- 12.1.5.2. Products
- 12.1.5.3. Company Financials
- 12.1.5.4. SWOT Analysis
- 12.1.6 City Index
- 12.1.6.1. Company Overview
- 12.1.6.2. Products
- 12.1.6.3. Company Financials
- 12.1.6.4. SWOT Analysis
- 12.1.7 Robinhood
- 12.1.7.1. Company Overview
- 12.1.7.2. Products
- 12.1.7.3. Company Financials
- 12.1.7.4. SWOT Analysis
- 12.1.8 AvaTrade
- 12.1.8.1. Company Overview
- 12.1.8.2. Products
- 12.1.8.3. Company Financials
- 12.1.8.4. SWOT Analysis
- 12.1.9 Monesta Markets
- 12.1.9.1. Company Overview
- 12.1.9.2. Products
- 12.1.9.3. Company Financials
- 12.1.9.4. SWOT Analysis
- 12.1.10 Stocktrade
- 12.1.10.1. Company Overview
- 12.1.10.2. Products
- 12.1.10.3. Company Financials
- 12.1.10.4. SWOT Analysis
- 12.1.1 eToro
- 12.2. Market Entropy
- 12.2.1 Company's Key Areas Served
- 12.2.2 Recent Developments
- 12.3. Company Market Share Analysis 2025
- 12.3.1 Top 5 Companies Market Share Analysis
- 12.3.2 Top 3 Companies Market Share Analysis
- 12.4. List of Potential Customers
- 13. Research Methodology
List of Figures
- Figure 1: Global E-Brokerage Market In The United Kingdom Revenue Breakdown (Million, %) by Region 2025 & 2033
- Figure 2: Global E-Brokerage Market In The United Kingdom Volume Breakdown (Million, %) by Region 2025 & 2033
- Figure 3: North America E-Brokerage Market In The United Kingdom Revenue (Million), by Investor 2025 & 2033
- Figure 4: North America E-Brokerage Market In The United Kingdom Volume (Million), by Investor 2025 & 2033
- Figure 5: North America E-Brokerage Market In The United Kingdom Revenue Share (%), by Investor 2025 & 2033
- Figure 6: North America E-Brokerage Market In The United Kingdom Volume Share (%), by Investor 2025 & 2033
- Figure 7: North America E-Brokerage Market In The United Kingdom Revenue (Million), by Operation 2025 & 2033
- Figure 8: North America E-Brokerage Market In The United Kingdom Volume (Million), by Operation 2025 & 2033
- Figure 9: North America E-Brokerage Market In The United Kingdom Revenue Share (%), by Operation 2025 & 2033
- Figure 10: North America E-Brokerage Market In The United Kingdom Volume Share (%), by Operation 2025 & 2033
- Figure 11: North America E-Brokerage Market In The United Kingdom Revenue (Million), by Country 2025 & 2033
- Figure 12: North America E-Brokerage Market In The United Kingdom Volume (Million), by Country 2025 & 2033
- Figure 13: North America E-Brokerage Market In The United Kingdom Revenue Share (%), by Country 2025 & 2033
- Figure 14: North America E-Brokerage Market In The United Kingdom Volume Share (%), by Country 2025 & 2033
- Figure 15: South America E-Brokerage Market In The United Kingdom Revenue (Million), by Investor 2025 & 2033
- Figure 16: South America E-Brokerage Market In The United Kingdom Volume (Million), by Investor 2025 & 2033
- Figure 17: South America E-Brokerage Market In The United Kingdom Revenue Share (%), by Investor 2025 & 2033
- Figure 18: South America E-Brokerage Market In The United Kingdom Volume Share (%), by Investor 2025 & 2033
- Figure 19: South America E-Brokerage Market In The United Kingdom Revenue (Million), by Operation 2025 & 2033
- Figure 20: South America E-Brokerage Market In The United Kingdom Volume (Million), by Operation 2025 & 2033
- Figure 21: South America E-Brokerage Market In The United Kingdom Revenue Share (%), by Operation 2025 & 2033
- Figure 22: South America E-Brokerage Market In The United Kingdom Volume Share (%), by Operation 2025 & 2033
- Figure 23: South America E-Brokerage Market In The United Kingdom Revenue (Million), by Country 2025 & 2033
- Figure 24: South America E-Brokerage Market In The United Kingdom Volume (Million), by Country 2025 & 2033
- Figure 25: South America E-Brokerage Market In The United Kingdom Revenue Share (%), by Country 2025 & 2033
- Figure 26: South America E-Brokerage Market In The United Kingdom Volume Share (%), by Country 2025 & 2033
- Figure 27: Europe E-Brokerage Market In The United Kingdom Revenue (Million), by Investor 2025 & 2033
- Figure 28: Europe E-Brokerage Market In The United Kingdom Volume (Million), by Investor 2025 & 2033
- Figure 29: Europe E-Brokerage Market In The United Kingdom Revenue Share (%), by Investor 2025 & 2033
- Figure 30: Europe E-Brokerage Market In The United Kingdom Volume Share (%), by Investor 2025 & 2033
- Figure 31: Europe E-Brokerage Market In The United Kingdom Revenue (Million), by Operation 2025 & 2033
- Figure 32: Europe E-Brokerage Market In The United Kingdom Volume (Million), by Operation 2025 & 2033
- Figure 33: Europe E-Brokerage Market In The United Kingdom Revenue Share (%), by Operation 2025 & 2033
- Figure 34: Europe E-Brokerage Market In The United Kingdom Volume Share (%), by Operation 2025 & 2033
- Figure 35: Europe E-Brokerage Market In The United Kingdom Revenue (Million), by Country 2025 & 2033
- Figure 36: Europe E-Brokerage Market In The United Kingdom Volume (Million), by Country 2025 & 2033
- Figure 37: Europe E-Brokerage Market In The United Kingdom Revenue Share (%), by Country 2025 & 2033
- Figure 38: Europe E-Brokerage Market In The United Kingdom Volume Share (%), by Country 2025 & 2033
- Figure 39: Middle East & Africa E-Brokerage Market In The United Kingdom Revenue (Million), by Investor 2025 & 2033
- Figure 40: Middle East & Africa E-Brokerage Market In The United Kingdom Volume (Million), by Investor 2025 & 2033
- Figure 41: Middle East & Africa E-Brokerage Market In The United Kingdom Revenue Share (%), by Investor 2025 & 2033
- Figure 42: Middle East & Africa E-Brokerage Market In The United Kingdom Volume Share (%), by Investor 2025 & 2033
- Figure 43: Middle East & Africa E-Brokerage Market In The United Kingdom Revenue (Million), by Operation 2025 & 2033
- Figure 44: Middle East & Africa E-Brokerage Market In The United Kingdom Volume (Million), by Operation 2025 & 2033
- Figure 45: Middle East & Africa E-Brokerage Market In The United Kingdom Revenue Share (%), by Operation 2025 & 2033
- Figure 46: Middle East & Africa E-Brokerage Market In The United Kingdom Volume Share (%), by Operation 2025 & 2033
- Figure 47: Middle East & Africa E-Brokerage Market In The United Kingdom Revenue (Million), by Country 2025 & 2033
- Figure 48: Middle East & Africa E-Brokerage Market In The United Kingdom Volume (Million), by Country 2025 & 2033
- Figure 49: Middle East & Africa E-Brokerage Market In The United Kingdom Revenue Share (%), by Country 2025 & 2033
- Figure 50: Middle East & Africa E-Brokerage Market In The United Kingdom Volume Share (%), by Country 2025 & 2033
- Figure 51: Asia Pacific E-Brokerage Market In The United Kingdom Revenue (Million), by Investor 2025 & 2033
- Figure 52: Asia Pacific E-Brokerage Market In The United Kingdom Volume (Million), by Investor 2025 & 2033
- Figure 53: Asia Pacific E-Brokerage Market In The United Kingdom Revenue Share (%), by Investor 2025 & 2033
- Figure 54: Asia Pacific E-Brokerage Market In The United Kingdom Volume Share (%), by Investor 2025 & 2033
- Figure 55: Asia Pacific E-Brokerage Market In The United Kingdom Revenue (Million), by Operation 2025 & 2033
- Figure 56: Asia Pacific E-Brokerage Market In The United Kingdom Volume (Million), by Operation 2025 & 2033
- Figure 57: Asia Pacific E-Brokerage Market In The United Kingdom Revenue Share (%), by Operation 2025 & 2033
- Figure 58: Asia Pacific E-Brokerage Market In The United Kingdom Volume Share (%), by Operation 2025 & 2033
- Figure 59: Asia Pacific E-Brokerage Market In The United Kingdom Revenue (Million), by Country 2025 & 2033
- Figure 60: Asia Pacific E-Brokerage Market In The United Kingdom Volume (Million), by Country 2025 & 2033
- Figure 61: Asia Pacific E-Brokerage Market In The United Kingdom Revenue Share (%), by Country 2025 & 2033
- Figure 62: Asia Pacific E-Brokerage Market In The United Kingdom Volume Share (%), by Country 2025 & 2033
List of Tables
- Table 1: Global E-Brokerage Market In The United Kingdom Revenue Million Forecast, by Investor 2020 & 2033
- Table 2: Global E-Brokerage Market In The United Kingdom Volume Million Forecast, by Investor 2020 & 2033
- Table 3: Global E-Brokerage Market In The United Kingdom Revenue Million Forecast, by Operation 2020 & 2033
- Table 4: Global E-Brokerage Market In The United Kingdom Volume Million Forecast, by Operation 2020 & 2033
- Table 5: Global E-Brokerage Market In The United Kingdom Revenue Million Forecast, by Region 2020 & 2033
- Table 6: Global E-Brokerage Market In The United Kingdom Volume Million Forecast, by Region 2020 & 2033
- Table 7: Global E-Brokerage Market In The United Kingdom Revenue Million Forecast, by Investor 2020 & 2033
- Table 8: Global E-Brokerage Market In The United Kingdom Volume Million Forecast, by Investor 2020 & 2033
- Table 9: Global E-Brokerage Market In The United Kingdom Revenue Million Forecast, by Operation 2020 & 2033
- Table 10: Global E-Brokerage Market In The United Kingdom Volume Million Forecast, by Operation 2020 & 2033
- Table 11: Global E-Brokerage Market In The United Kingdom Revenue Million Forecast, by Country 2020 & 2033
- Table 12: Global E-Brokerage Market In The United Kingdom Volume Million Forecast, by Country 2020 & 2033
- Table 13: United States E-Brokerage Market In The United Kingdom Revenue (Million) Forecast, by Application 2020 & 2033
- Table 14: United States E-Brokerage Market In The United Kingdom Volume (Million) Forecast, by Application 2020 & 2033
- Table 15: Canada E-Brokerage Market In The United Kingdom Revenue (Million) Forecast, by Application 2020 & 2033
- Table 16: Canada E-Brokerage Market In The United Kingdom Volume (Million) Forecast, by Application 2020 & 2033
- Table 17: Mexico E-Brokerage Market In The United Kingdom Revenue (Million) Forecast, by Application 2020 & 2033
- Table 18: Mexico E-Brokerage Market In The United Kingdom Volume (Million) Forecast, by Application 2020 & 2033
- Table 19: Global E-Brokerage Market In The United Kingdom Revenue Million Forecast, by Investor 2020 & 2033
- Table 20: Global E-Brokerage Market In The United Kingdom Volume Million Forecast, by Investor 2020 & 2033
- Table 21: Global E-Brokerage Market In The United Kingdom Revenue Million Forecast, by Operation 2020 & 2033
- Table 22: Global E-Brokerage Market In The United Kingdom Volume Million Forecast, by Operation 2020 & 2033
- Table 23: Global E-Brokerage Market In The United Kingdom Revenue Million Forecast, by Country 2020 & 2033
- Table 24: Global E-Brokerage Market In The United Kingdom Volume Million Forecast, by Country 2020 & 2033
- Table 25: Brazil E-Brokerage Market In The United Kingdom Revenue (Million) Forecast, by Application 2020 & 2033
- Table 26: Brazil E-Brokerage Market In The United Kingdom Volume (Million) Forecast, by Application 2020 & 2033
- Table 27: Argentina E-Brokerage Market In The United Kingdom Revenue (Million) Forecast, by Application 2020 & 2033
- Table 28: Argentina E-Brokerage Market In The United Kingdom Volume (Million) Forecast, by Application 2020 & 2033
- Table 29: Rest of South America E-Brokerage Market In The United Kingdom Revenue (Million) Forecast, by Application 2020 & 2033
- Table 30: Rest of South America E-Brokerage Market In The United Kingdom Volume (Million) Forecast, by Application 2020 & 2033
- Table 31: Global E-Brokerage Market In The United Kingdom Revenue Million Forecast, by Investor 2020 & 2033
- Table 32: Global E-Brokerage Market In The United Kingdom Volume Million Forecast, by Investor 2020 & 2033
- Table 33: Global E-Brokerage Market In The United Kingdom Revenue Million Forecast, by Operation 2020 & 2033
- Table 34: Global E-Brokerage Market In The United Kingdom Volume Million Forecast, by Operation 2020 & 2033
- Table 35: Global E-Brokerage Market In The United Kingdom Revenue Million Forecast, by Country 2020 & 2033
- Table 36: Global E-Brokerage Market In The United Kingdom Volume Million Forecast, by Country 2020 & 2033
- Table 37: United Kingdom E-Brokerage Market In The United Kingdom Revenue (Million) Forecast, by Application 2020 & 2033
- Table 38: United Kingdom E-Brokerage Market In The United Kingdom Volume (Million) Forecast, by Application 2020 & 2033
- Table 39: Germany E-Brokerage Market In The United Kingdom Revenue (Million) Forecast, by Application 2020 & 2033
- Table 40: Germany E-Brokerage Market In The United Kingdom Volume (Million) Forecast, by Application 2020 & 2033
- Table 41: France E-Brokerage Market In The United Kingdom Revenue (Million) Forecast, by Application 2020 & 2033
- Table 42: France E-Brokerage Market In The United Kingdom Volume (Million) Forecast, by Application 2020 & 2033
- Table 43: Italy E-Brokerage Market In The United Kingdom Revenue (Million) Forecast, by Application 2020 & 2033
- Table 44: Italy E-Brokerage Market In The United Kingdom Volume (Million) Forecast, by Application 2020 & 2033
- Table 45: Spain E-Brokerage Market In The United Kingdom Revenue (Million) Forecast, by Application 2020 & 2033
- Table 46: Spain E-Brokerage Market In The United Kingdom Volume (Million) Forecast, by Application 2020 & 2033
- Table 47: Russia E-Brokerage Market In The United Kingdom Revenue (Million) Forecast, by Application 2020 & 2033
- Table 48: Russia E-Brokerage Market In The United Kingdom Volume (Million) Forecast, by Application 2020 & 2033
- Table 49: Benelux E-Brokerage Market In The United Kingdom Revenue (Million) Forecast, by Application 2020 & 2033
- Table 50: Benelux E-Brokerage Market In The United Kingdom Volume (Million) Forecast, by Application 2020 & 2033
- Table 51: Nordics E-Brokerage Market In The United Kingdom Revenue (Million) Forecast, by Application 2020 & 2033
- Table 52: Nordics E-Brokerage Market In The United Kingdom Volume (Million) Forecast, by Application 2020 & 2033
- Table 53: Rest of Europe E-Brokerage Market In The United Kingdom Revenue (Million) Forecast, by Application 2020 & 2033
- Table 54: Rest of Europe E-Brokerage Market In The United Kingdom Volume (Million) Forecast, by Application 2020 & 2033
- Table 55: Global E-Brokerage Market In The United Kingdom Revenue Million Forecast, by Investor 2020 & 2033
- Table 56: Global E-Brokerage Market In The United Kingdom Volume Million Forecast, by Investor 2020 & 2033
- Table 57: Global E-Brokerage Market In The United Kingdom Revenue Million Forecast, by Operation 2020 & 2033
- Table 58: Global E-Brokerage Market In The United Kingdom Volume Million Forecast, by Operation 2020 & 2033
- Table 59: Global E-Brokerage Market In The United Kingdom Revenue Million Forecast, by Country 2020 & 2033
- Table 60: Global E-Brokerage Market In The United Kingdom Volume Million Forecast, by Country 2020 & 2033
- Table 61: Turkey E-Brokerage Market In The United Kingdom Revenue (Million) Forecast, by Application 2020 & 2033
- Table 62: Turkey E-Brokerage Market In The United Kingdom Volume (Million) Forecast, by Application 2020 & 2033
- Table 63: Israel E-Brokerage Market In The United Kingdom Revenue (Million) Forecast, by Application 2020 & 2033
- Table 64: Israel E-Brokerage Market In The United Kingdom Volume (Million) Forecast, by Application 2020 & 2033
- Table 65: GCC E-Brokerage Market In The United Kingdom Revenue (Million) Forecast, by Application 2020 & 2033
- Table 66: GCC E-Brokerage Market In The United Kingdom Volume (Million) Forecast, by Application 2020 & 2033
- Table 67: North Africa E-Brokerage Market In The United Kingdom Revenue (Million) Forecast, by Application 2020 & 2033
- Table 68: North Africa E-Brokerage Market In The United Kingdom Volume (Million) Forecast, by Application 2020 & 2033
- Table 69: South Africa E-Brokerage Market In The United Kingdom Revenue (Million) Forecast, by Application 2020 & 2033
- Table 70: South Africa E-Brokerage Market In The United Kingdom Volume (Million) Forecast, by Application 2020 & 2033
- Table 71: Rest of Middle East & Africa E-Brokerage Market In The United Kingdom Revenue (Million) Forecast, by Application 2020 & 2033
- Table 72: Rest of Middle East & Africa E-Brokerage Market In The United Kingdom Volume (Million) Forecast, by Application 2020 & 2033
- Table 73: Global E-Brokerage Market In The United Kingdom Revenue Million Forecast, by Investor 2020 & 2033
- Table 74: Global E-Brokerage Market In The United Kingdom Volume Million Forecast, by Investor 2020 & 2033
- Table 75: Global E-Brokerage Market In The United Kingdom Revenue Million Forecast, by Operation 2020 & 2033
- Table 76: Global E-Brokerage Market In The United Kingdom Volume Million Forecast, by Operation 2020 & 2033
- Table 77: Global E-Brokerage Market In The United Kingdom Revenue Million Forecast, by Country 2020 & 2033
- Table 78: Global E-Brokerage Market In The United Kingdom Volume Million Forecast, by Country 2020 & 2033
- Table 79: China E-Brokerage Market In The United Kingdom Revenue (Million) Forecast, by Application 2020 & 2033
- Table 80: China E-Brokerage Market In The United Kingdom Volume (Million) Forecast, by Application 2020 & 2033
- Table 81: India E-Brokerage Market In The United Kingdom Revenue (Million) Forecast, by Application 2020 & 2033
- Table 82: India E-Brokerage Market In The United Kingdom Volume (Million) Forecast, by Application 2020 & 2033
- Table 83: Japan E-Brokerage Market In The United Kingdom Revenue (Million) Forecast, by Application 2020 & 2033
- Table 84: Japan E-Brokerage Market In The United Kingdom Volume (Million) Forecast, by Application 2020 & 2033
- Table 85: South Korea E-Brokerage Market In The United Kingdom Revenue (Million) Forecast, by Application 2020 & 2033
- Table 86: South Korea E-Brokerage Market In The United Kingdom Volume (Million) Forecast, by Application 2020 & 2033
- Table 87: ASEAN E-Brokerage Market In The United Kingdom Revenue (Million) Forecast, by Application 2020 & 2033
- Table 88: ASEAN E-Brokerage Market In The United Kingdom Volume (Million) Forecast, by Application 2020 & 2033
- Table 89: Oceania E-Brokerage Market In The United Kingdom Revenue (Million) Forecast, by Application 2020 & 2033
- Table 90: Oceania E-Brokerage Market In The United Kingdom Volume (Million) Forecast, by Application 2020 & 2033
- Table 91: Rest of Asia Pacific E-Brokerage Market In The United Kingdom Revenue (Million) Forecast, by Application 2020 & 2033
- Table 92: Rest of Asia Pacific E-Brokerage Market In The United Kingdom Volume (Million) Forecast, by Application 2020 & 2033
Frequently Asked Questions
1. What is the projected Compound Annual Growth Rate (CAGR) of the E-Brokerage Market In The United Kingdom?
The projected CAGR is approximately 2.83%.
2. Which companies are prominent players in the E-Brokerage Market In The United Kingdom?
Key companies in the market include eToro, Peperstone, Plus, Capital com, IG Group, City Index, Robinhood, AvaTrade, Monesta Markets, Stocktrade.
3. What are the main segments of the E-Brokerage Market In The United Kingdom?
The market segments include Investor, Operation.
4. Can you provide details about the market size?
The market size is estimated to be USD 693.77 Million as of 2022.
5. What are some drivers contributing to market growth?
Convenience and Cost-Effectiveness; Real Time Analysis of Market Available In E-Brokerage Platforms.
6. What are the notable trends driving market growth?
Rising Digital Innovation & Adoption of Artificial Intelligence (AI) and Machine Learning (ML).
7. Are there any restraints impacting market growth?
Convenience and Cost-Effectiveness; Real Time Analysis of Market Available In E-Brokerage Platforms.
8. Can you provide examples of recent developments in the market?
In March 2023, the United Kingdom broking firm Cenkos merged with FinnCap. Post merger both companies own a 50% share of the new firm with the company being named FinnCap. The merger will strengthen the position of both firms with an increase in clients and new customers.
9. What pricing options are available for accessing the report?
Pricing options include single-user, multi-user, and enterprise licenses priced at USD 3800, USD 4500, and USD 5800 respectively.
10. Is the market size provided in terms of value or volume?
The market size is provided in terms of value, measured in Million and volume, measured in Million.
11. Are there any specific market keywords associated with the report?
Yes, the market keyword associated with the report is "E-Brokerage Market In The United Kingdom," which aids in identifying and referencing the specific market segment covered.
12. How do I determine which pricing option suits my needs best?
The pricing options vary based on user requirements and access needs. Individual users may opt for single-user licenses, while businesses requiring broader access may choose multi-user or enterprise licenses for cost-effective access to the report.
13. Are there any additional resources or data provided in the E-Brokerage Market In The United Kingdom report?
While the report offers comprehensive insights, it's advisable to review the specific contents or supplementary materials provided to ascertain if additional resources or data are available.
14. How can I stay updated on further developments or reports in the E-Brokerage Market In The United Kingdom?
To stay informed about further developments, trends, and reports in the E-Brokerage Market In The United Kingdom, consider subscribing to industry newsletters, following relevant companies and organizations, or regularly checking reputable industry news sources and publications.
Methodology
Step 1 - Identification of Relevant Samples Size from Population Database


Step 2 - Approaches for Defining Global Market Size (Value, Volume* & Price*)

Note*: In applicable scenarios
Step 3 - Data Sources
Primary Research
- Web Analytics
- Survey Reports
- Research Institute
- Latest Research Reports
- Opinion Leaders
Secondary Research
- Annual Reports
- White Paper
- Latest Press Release
- Industry Association
- Paid Database
- Investor Presentations

Step 4 - Data Triangulation
Involves using different sources of information in order to increase the validity of a study
These sources are likely to be stakeholders in a program - participants, other researchers, program staff, other community members, and so on.
Then we put all data in single framework & apply various statistical tools to find out the dynamic on the market.
During the analysis stage, feedback from the stakeholder groups would be compared to determine areas of agreement as well as areas of divergence