

Key Insights
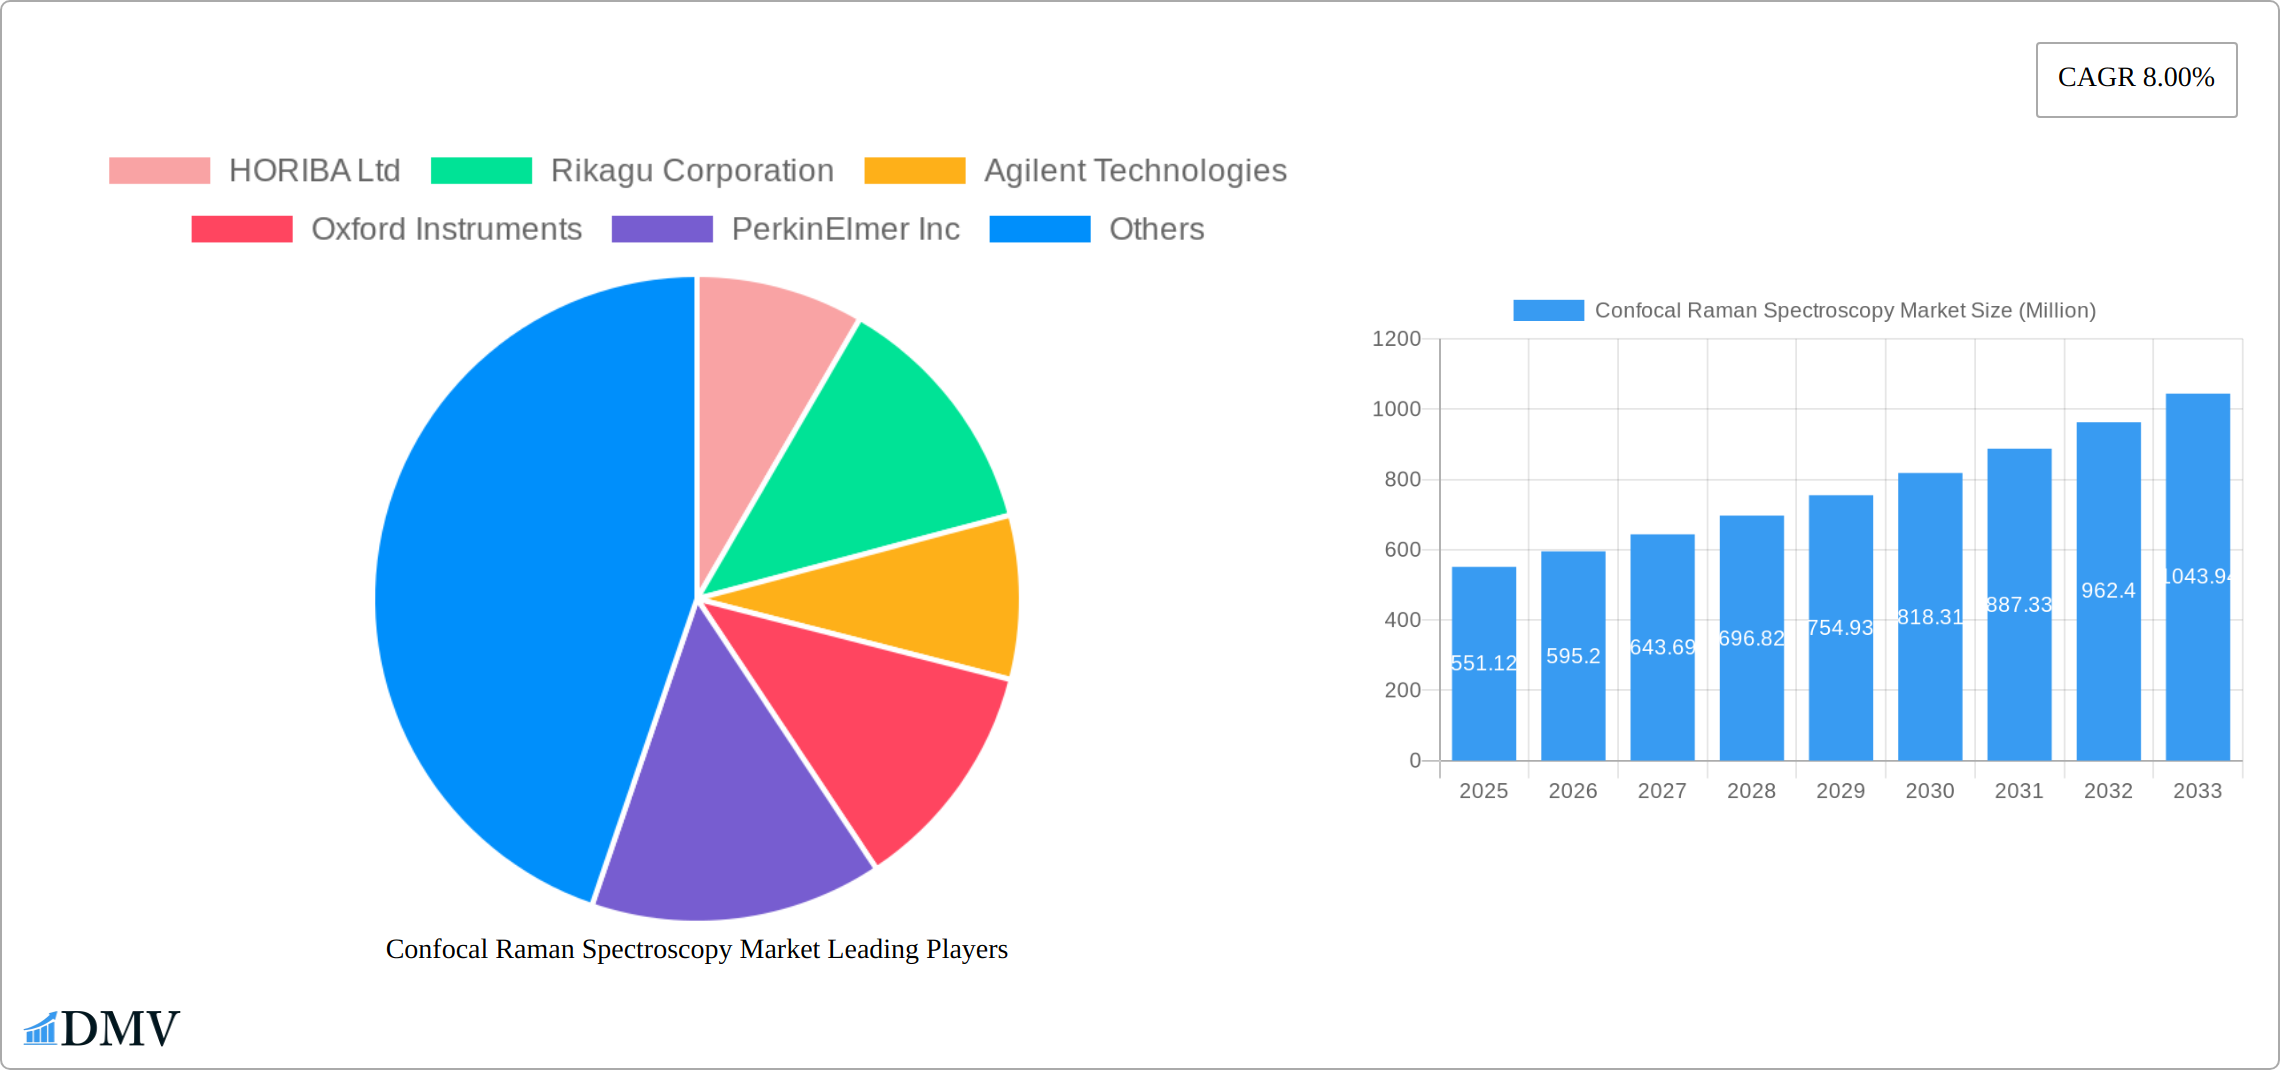
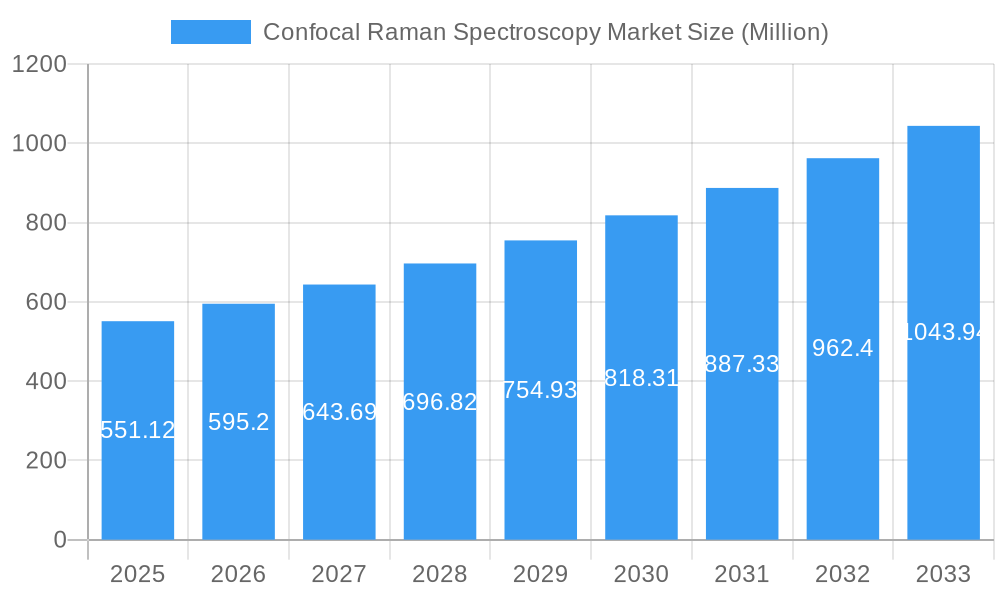
The confocal Raman spectroscopy market, valued at $551.12 million in 2025, is projected to experience robust growth, driven by a compound annual growth rate (CAGR) of 8% from 2025 to 2033. This expansion is fueled by several key factors. The increasing demand for advanced materials characterization across diverse sectors such as pharmaceuticals, semiconductors, and biomedical research is a significant driver. Confocal Raman spectroscopy offers unparalleled capabilities for non-destructive, high-resolution chemical imaging, making it an indispensable tool for quality control, process optimization, and research & development. Furthermore, technological advancements resulting in improved sensitivity, higher spatial resolution, and user-friendly software are contributing to market growth. The development of portable and miniaturized confocal Raman systems is expanding accessibility and applicability across various settings, including field studies and point-of-care diagnostics. This trend is expected to further propel market expansion throughout the forecast period.
Confocal Raman Spectroscopy Market Market Size (In Million)
Competition in the market is intense, with established players like HORIBA Ltd, Renishaw PLC, and Thermo Fisher Scientific Inc. alongside other significant players such as Bruker Corporation, Agilent Technologies, and PerkinElmer Inc. constantly innovating to maintain their market share. These companies are focusing on strategic partnerships, acquisitions, and product development to cater to the growing demand and expand their market reach. While the market faces challenges such as high equipment costs and the need for specialized expertise, the overwhelming benefits of confocal Raman spectroscopy, particularly in terms of its analytical power and versatility, are expected to outweigh these restraints, ensuring continued strong market growth in the coming years. The market is expected to witness a continuous improvement in technology, including new advancements in laser sources and detectors, leading to better sensitivity and faster data acquisition.
Confocal Raman Spectroscopy Market Company Market Share
Confocal Raman Spectroscopy Market: A Comprehensive Report (2019-2033)
This insightful report provides a comprehensive analysis of the Confocal Raman Spectroscopy market, offering a detailed examination of its current state, future trajectory, and key players. The study period spans from 2019 to 2033, with 2025 serving as the base and estimated year. The report unveils crucial market trends, technological advancements, and competitive dynamics, equipping stakeholders with actionable intelligence for strategic decision-making. The market is projected to reach xx Million by 2033, exhibiting a CAGR of xx% during the forecast period (2025-2033).
Confocal Raman Spectroscopy Market Market Composition & Trends
The Confocal Raman Spectroscopy market is characterized by a dynamic interplay of technological advancements, regulatory considerations, and diverse end-user demands. While the market exhibits a moderately concentrated structure, with the top five key players projected to hold approximately XX% of the market share by 2025, there is a robust landscape of innovation driving its evolution. Core innovation drivers include continuous improvements in laser source efficiency and stability, the development of highly sensitive and low-noise detectors (such as InGaAs or deep-depletion CCDs), and the sophistication of data processing and analysis software, including AI-driven interpretation tools. Stringent regulatory frameworks, particularly those governing the safety and environmental impact of scientific instrumentation and their applications in sensitive fields like pharmaceuticals and food safety, are paramount and influence product development and market access. While competing techniques like Atomic Force Microscopy (AFM) offer complementary nanoscale imaging capabilities and Near-Infrared (NIR) spectroscopy provides rapid bulk analysis, confocal Raman spectroscopy retains its unique advantage in providing high-resolution chemical and molecular information from specific sub-micron regions. End-users are primarily concentrated in high-value sectors such as pharmaceuticals (for drug discovery, formulation analysis, and quality control), materials science (for characterization of polymers, composites, and nanomaterials), life sciences (for cell biology, tissue analysis, and disease diagnostics), and increasingly in niche areas like forensics and environmental science. The market has witnessed significant consolidation through Mergers & Acquisitions (M&A) activities, with deals collectively valued at over XX Million USD in the past five years, underscoring strategic moves to broaden portfolios, gain market share, and acquire specialized technological expertise.
- Market Share Distribution (2025 Projection): Top 5 players - XX%; Other players - XX%.
- M&A Deal Value (2019-2024): Exceeding XX Million USD.
- Key End-User Segments: Pharmaceuticals, Materials Science, Life Sciences, Academia, Chemical Industry, Food & Beverage, Forensics, Environmental Monitoring, etc.
Confocal Raman Spectroscopy Market Industry Evolution
The Confocal Raman Spectroscopy market has witnessed substantial growth during the historical period (2019-2024), fueled by technological advancements, increasing demand for non-destructive testing, and rising research investments. The market expanded at a CAGR of xx% from 2019 to 2024, reaching xx Million in 2024. Technological advancements such as the development of higher-resolution detectors, improved spatial resolution, and advanced data processing algorithms have significantly expanded the applications of confocal Raman spectroscopy. The growing adoption of this technology across various industries, driven by the need for detailed material characterization and precise chemical analysis, is further boosting market growth. Consumer demand is increasingly focused on faster analysis times, enhanced data quality, and user-friendly interfaces. This report forecasts a continued positive trajectory, projecting significant market expansion in the years to come.
Leading Regions, Countries, or Segments in Confocal Raman Spectroscopy Market
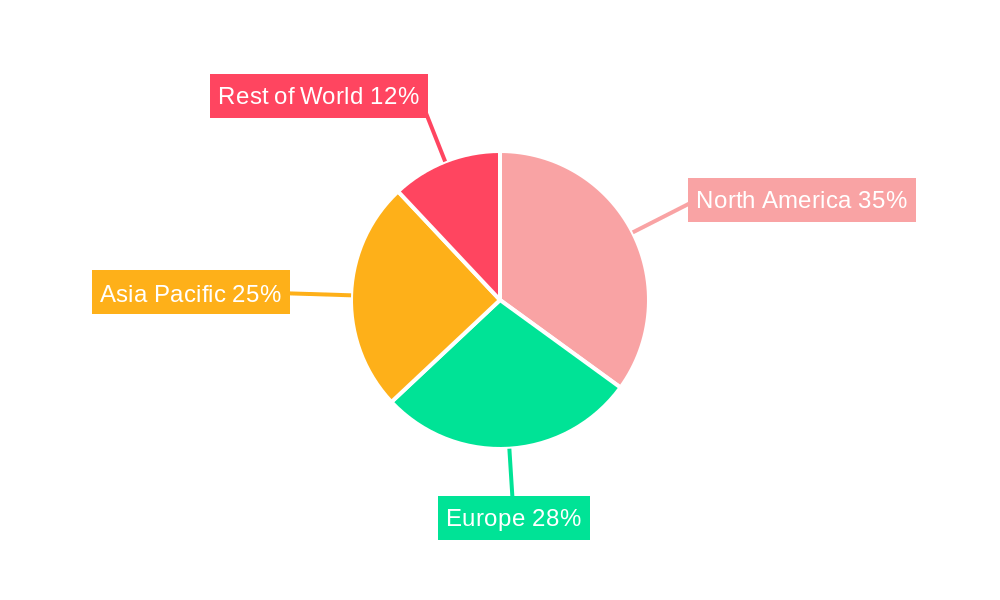
North America currently dominates the Confocal Raman Spectroscopy market, driven by robust research funding, a mature technological landscape, and a strong presence of major market players. Europe holds a significant share, fueled by investments in advanced materials research and pharmaceutical development. Asia-Pacific is experiencing rapid growth, supported by expanding industries and increasing government initiatives to foster scientific and technological development.
- Key Drivers for North American Dominance: High R&D spending, presence of major players, strong regulatory support.
- Asia-Pacific Growth Catalysts: Expanding industrial base, government investments in R&D, increasing adoption in various applications.
- European Market Drivers: Strong focus on materials science and pharmaceutical R&D, substantial government funding.
Confocal Raman Spectroscopy Market Product Innovations
Recent product innovations in the Confocal Raman Spectroscopy market are intensely focused on pushing the boundaries of spatial resolution, significantly enhancing signal sensitivity and detection limits, and accelerating the speed of analysis. Key advancements include the development of high-performance laser systems with tunable wavelengths and improved stability, alongside ultra-sensitive detectors capable of capturing weak Raman signals with minimal background noise. Miniaturization of confocal Raman instruments is a growing trend, leading to more portable and user-friendly systems suitable for on-site analysis and fieldwork. Furthermore, the integration of advanced software with intuitive graphical user interfaces, real-time data processing algorithms, and AI-powered spectral interpretation capabilities is democratizing access to this powerful technique. These innovations are crucial for expanding the applications of confocal Raman spectroscopy into previously challenging areas, such as in vivo biological imaging with minimal phototoxicity, detailed analysis of single nanoparticles, and rapid on-site material identification and characterization. The unique selling propositions of these new instruments lie in their ability to deliver superior signal-to-noise ratios, sophisticated multi-dimensional data analysis, improved spectral resolution, and enhanced ease of operation, ultimately enabling researchers and industrial users to obtain deeper insights with greater efficiency.
Propelling Factors for Confocal Raman Spectroscopy Market Growth
The growth of the Confocal Raman Spectroscopy market is propelled by several factors. Advancements in laser technology, enabling higher resolution and sensitivity, are paramount. The increasing demand for non-destructive testing and analysis across various industries further fuels market growth. Government initiatives and research funding focused on nanotechnology and advanced materials research also contribute significantly.
Obstacles in the Confocal Raman Spectroscopy Market Market
Despite its significant analytical capabilities, the Confocal Raman Spectroscopy market faces several notable obstacles that can impede its widespread adoption and market growth. A primary barrier remains the considerable capital investment required for high-performance confocal Raman systems, often ranging from tens of thousands to hundreds of thousands of dollars, making them less accessible for smaller laboratories or academic institutions with limited budgets. Additionally, operating and maintaining these sophisticated instruments necessitates specialized technical expertise and training, which can be a limiting factor for organizations without dedicated scientific support staff. Competition from established and emerging alternative analytical techniques, each with its own strengths and cost-effectiveness for specific applications, also presents a challenge. Potential supply chain disruptions, exacerbated by global geopolitical factors, can impact the availability of critical components and lead to increased manufacturing costs or delivery delays. Furthermore, navigating the complex and often evolving regulatory landscapes in certain regions, particularly concerning instrument validation, data integrity, and specific application approvals (e.g., in pharmaceutical manufacturing), can prolong market penetration and add to the overall cost of compliance.
Future Opportunities in Confocal Raman Spectroscopy Market
The future of the Confocal Raman Spectroscopy market is brimming with exciting opportunities driven by technological convergence and the exploration of new application frontiers. A significant area of growth lies in the seamless integration of confocal Raman spectroscopy with other complementary analytical techniques. Combining its chemical fingerprinting capabilities with the high-resolution imaging of electron microscopy (e.g., correlative light and electron microscopy - CLEM), the elemental analysis of X-ray diffraction (XRD), or the mass identification capabilities of mass spectrometry (MS) offers unparalleled analytical power for complex sample analysis. Expansion into novel and high-growth application areas, such as forensic science (for trace evidence analysis, counterfeit detection), environmental monitoring (for pollutant identification and characterization), and food safety (for adulterant detection and quality assessment), presents substantial potential. The development of more portable, cost-effective, and automated confocal Raman instruments is a crucial trend that will further democratize access to this technology, driving adoption beyond traditional research labs and into field applications and industrial quality control settings.
Major Players in the Confocal Raman Spectroscopy Market Ecosystem
- HORIBA Ltd
- Rigaku Corporation
- Agilent Technologies
- Oxford Instruments
- PerkinElmer Inc
- Renishaw PLC
- Bruker Corporation
- Thermo Fisher Scientific Inc
- Mettler Toledo
- Hamamatsu Photonics KK
- B&W Tek, Inc.
- JASCO Corporation
- *List Not Exhaustive
Key Developments in Confocal Raman Spectroscopy Market Industry
- June 2024: Shimadzu launched the AIRsight Infrared/Raman Microscope, merging FTIR and Raman spectroscopy for enhanced molecular analysis.
- February 2024: Bruker Corporation acquired Nanophoton Corporation, expanding its Raman microscopy portfolio globally.
Strategic Confocal Raman Spectroscopy Market Market Forecast
The Confocal Raman Spectroscopy market is poised for continued expansion, driven by technological advancements, increasing applications across diverse sectors, and significant R&D investments. The market's future growth trajectory is projected to remain positive, presenting lucrative opportunities for existing players and potential market entrants alike. The convergence of various analytical techniques and the development of user-friendly, cost-effective solutions will further propel market expansion in the coming years.
Confocal Raman Spectroscopy Market Segmentation
-
1. Type
- 1.1. Desktop
- 1.2. Portable
-
2. End User
- 2.1. Pharmaceuticals
- 2.2. R&D in Academia
- 2.3. Industrial Sectors
- 2.4. Others
Confocal Raman Spectroscopy Market Segmentation By Geography
- 1. North America
- 2. Europe
- 3. Asia
- 4. Australia and New Zealand
- 5. Latin America
- 6. Middle East and Africa
Confocal Raman Spectroscopy Market Regional Market Share
Geographic Coverage of Confocal Raman Spectroscopy Market
Confocal Raman Spectroscopy Market REPORT HIGHLIGHTS
| Aspects | Details |
|---|---|
| Study Period | 2020-2034 |
| Base Year | 2025 |
| Estimated Year | 2026 |
| Forecast Period | 2026-2034 |
| Historical Period | 2020-2025 |
| Growth Rate | CAGR of 8.00% from 2020-2034 |
| Segmentation |
|
Table of Contents
- 1. Introduction
- 1.1. Research Scope
- 1.2. Market Segmentation
- 1.3. Research Methodology
- 1.4. Definitions and Assumptions
- 2. Executive Summary
- 2.1. Introduction
- 3. Market Dynamics
- 3.1. Introduction
- 3.2. Market Drivers
- 3.2.1 Rising Investment Towards Drug Development; Growing Application in Forensic Science
- 3.2.2 Food Safety
- 3.2.3 and Gemology
- 3.3. Market Restrains
- 3.3.1 Rising Investment Towards Drug Development; Growing Application in Forensic Science
- 3.3.2 Food Safety
- 3.3.3 and Gemology
- 3.4. Market Trends
- 3.4.1. The Portable Segment is Driving Popularity
- 4. Market Factor Analysis
- 4.1. Porters Five Forces
- 4.2. Supply/Value Chain
- 4.3. PESTEL analysis
- 4.4. Market Entropy
- 4.5. Patent/Trademark Analysis
- 5. Global Confocal Raman Spectroscopy Market Analysis, Insights and Forecast, 2020-2032
- 5.1. Market Analysis, Insights and Forecast - by Type
- 5.1.1. Desktop
- 5.1.2. Portable
- 5.2. Market Analysis, Insights and Forecast - by End User
- 5.2.1. Pharmaceuticals
- 5.2.2. R&D in Academia
- 5.2.3. Industrial Sectors
- 5.2.4. Others
- 5.3. Market Analysis, Insights and Forecast - by Region
- 5.3.1. North America
- 5.3.2. Europe
- 5.3.3. Asia
- 5.3.4. Australia and New Zealand
- 5.3.5. Latin America
- 5.3.6. Middle East and Africa
- 5.1. Market Analysis, Insights and Forecast - by Type
- 6. North America Confocal Raman Spectroscopy Market Analysis, Insights and Forecast, 2020-2032
- 6.1. Market Analysis, Insights and Forecast - by Type
- 6.1.1. Desktop
- 6.1.2. Portable
- 6.2. Market Analysis, Insights and Forecast - by End User
- 6.2.1. Pharmaceuticals
- 6.2.2. R&D in Academia
- 6.2.3. Industrial Sectors
- 6.2.4. Others
- 6.1. Market Analysis, Insights and Forecast - by Type
- 7. Europe Confocal Raman Spectroscopy Market Analysis, Insights and Forecast, 2020-2032
- 7.1. Market Analysis, Insights and Forecast - by Type
- 7.1.1. Desktop
- 7.1.2. Portable
- 7.2. Market Analysis, Insights and Forecast - by End User
- 7.2.1. Pharmaceuticals
- 7.2.2. R&D in Academia
- 7.2.3. Industrial Sectors
- 7.2.4. Others
- 7.1. Market Analysis, Insights and Forecast - by Type
- 8. Asia Confocal Raman Spectroscopy Market Analysis, Insights and Forecast, 2020-2032
- 8.1. Market Analysis, Insights and Forecast - by Type
- 8.1.1. Desktop
- 8.1.2. Portable
- 8.2. Market Analysis, Insights and Forecast - by End User
- 8.2.1. Pharmaceuticals
- 8.2.2. R&D in Academia
- 8.2.3. Industrial Sectors
- 8.2.4. Others
- 8.1. Market Analysis, Insights and Forecast - by Type
- 9. Australia and New Zealand Confocal Raman Spectroscopy Market Analysis, Insights and Forecast, 2020-2032
- 9.1. Market Analysis, Insights and Forecast - by Type
- 9.1.1. Desktop
- 9.1.2. Portable
- 9.2. Market Analysis, Insights and Forecast - by End User
- 9.2.1. Pharmaceuticals
- 9.2.2. R&D in Academia
- 9.2.3. Industrial Sectors
- 9.2.4. Others
- 9.1. Market Analysis, Insights and Forecast - by Type
- 10. Latin America Confocal Raman Spectroscopy Market Analysis, Insights and Forecast, 2020-2032
- 10.1. Market Analysis, Insights and Forecast - by Type
- 10.1.1. Desktop
- 10.1.2. Portable
- 10.2. Market Analysis, Insights and Forecast - by End User
- 10.2.1. Pharmaceuticals
- 10.2.2. R&D in Academia
- 10.2.3. Industrial Sectors
- 10.2.4. Others
- 10.1. Market Analysis, Insights and Forecast - by Type
- 11. Middle East and Africa Confocal Raman Spectroscopy Market Analysis, Insights and Forecast, 2020-2032
- 11.1. Market Analysis, Insights and Forecast - by Type
- 11.1.1. Desktop
- 11.1.2. Portable
- 11.2. Market Analysis, Insights and Forecast - by End User
- 11.2.1. Pharmaceuticals
- 11.2.2. R&D in Academia
- 11.2.3. Industrial Sectors
- 11.2.4. Others
- 11.1. Market Analysis, Insights and Forecast - by Type
- 12. Competitive Analysis
- 12.1. Global Market Share Analysis 2025
- 12.2. Company Profiles
- 12.2.1 HORIBA Ltd
- 12.2.1.1. Overview
- 12.2.1.2. Products
- 12.2.1.3. SWOT Analysis
- 12.2.1.4. Recent Developments
- 12.2.1.5. Financials (Based on Availability)
- 12.2.2 Rikagu Corporation
- 12.2.2.1. Overview
- 12.2.2.2. Products
- 12.2.2.3. SWOT Analysis
- 12.2.2.4. Recent Developments
- 12.2.2.5. Financials (Based on Availability)
- 12.2.3 Agilent Technologies
- 12.2.3.1. Overview
- 12.2.3.2. Products
- 12.2.3.3. SWOT Analysis
- 12.2.3.4. Recent Developments
- 12.2.3.5. Financials (Based on Availability)
- 12.2.4 Oxford Instruments
- 12.2.4.1. Overview
- 12.2.4.2. Products
- 12.2.4.3. SWOT Analysis
- 12.2.4.4. Recent Developments
- 12.2.4.5. Financials (Based on Availability)
- 12.2.5 PerkinElmer Inc
- 12.2.5.1. Overview
- 12.2.5.2. Products
- 12.2.5.3. SWOT Analysis
- 12.2.5.4. Recent Developments
- 12.2.5.5. Financials (Based on Availability)
- 12.2.6 Renishaw PLC
- 12.2.6.1. Overview
- 12.2.6.2. Products
- 12.2.6.3. SWOT Analysis
- 12.2.6.4. Recent Developments
- 12.2.6.5. Financials (Based on Availability)
- 12.2.7 Bruker Corporation
- 12.2.7.1. Overview
- 12.2.7.2. Products
- 12.2.7.3. SWOT Analysis
- 12.2.7.4. Recent Developments
- 12.2.7.5. Financials (Based on Availability)
- 12.2.8 Thermo Fisher Scientific Inc
- 12.2.8.1. Overview
- 12.2.8.2. Products
- 12.2.8.3. SWOT Analysis
- 12.2.8.4. Recent Developments
- 12.2.8.5. Financials (Based on Availability)
- 12.2.9 Mettler Toledo
- 12.2.9.1. Overview
- 12.2.9.2. Products
- 12.2.9.3. SWOT Analysis
- 12.2.9.4. Recent Developments
- 12.2.9.5. Financials (Based on Availability)
- 12.2.10 Hamamatsu Photonics KK*List Not Exhaustive
- 12.2.10.1. Overview
- 12.2.10.2. Products
- 12.2.10.3. SWOT Analysis
- 12.2.10.4. Recent Developments
- 12.2.10.5. Financials (Based on Availability)
- 12.2.1 HORIBA Ltd
List of Figures
- Figure 1: Global Confocal Raman Spectroscopy Market Revenue Breakdown (Million, %) by Region 2025 & 2033
- Figure 2: Global Confocal Raman Spectroscopy Market Volume Breakdown (Million, %) by Region 2025 & 2033
- Figure 3: North America Confocal Raman Spectroscopy Market Revenue (Million), by Type 2025 & 2033
- Figure 4: North America Confocal Raman Spectroscopy Market Volume (Million), by Type 2025 & 2033
- Figure 5: North America Confocal Raman Spectroscopy Market Revenue Share (%), by Type 2025 & 2033
- Figure 6: North America Confocal Raman Spectroscopy Market Volume Share (%), by Type 2025 & 2033
- Figure 7: North America Confocal Raman Spectroscopy Market Revenue (Million), by End User 2025 & 2033
- Figure 8: North America Confocal Raman Spectroscopy Market Volume (Million), by End User 2025 & 2033
- Figure 9: North America Confocal Raman Spectroscopy Market Revenue Share (%), by End User 2025 & 2033
- Figure 10: North America Confocal Raman Spectroscopy Market Volume Share (%), by End User 2025 & 2033
- Figure 11: North America Confocal Raman Spectroscopy Market Revenue (Million), by Country 2025 & 2033
- Figure 12: North America Confocal Raman Spectroscopy Market Volume (Million), by Country 2025 & 2033
- Figure 13: North America Confocal Raman Spectroscopy Market Revenue Share (%), by Country 2025 & 2033
- Figure 14: North America Confocal Raman Spectroscopy Market Volume Share (%), by Country 2025 & 2033
- Figure 15: Europe Confocal Raman Spectroscopy Market Revenue (Million), by Type 2025 & 2033
- Figure 16: Europe Confocal Raman Spectroscopy Market Volume (Million), by Type 2025 & 2033
- Figure 17: Europe Confocal Raman Spectroscopy Market Revenue Share (%), by Type 2025 & 2033
- Figure 18: Europe Confocal Raman Spectroscopy Market Volume Share (%), by Type 2025 & 2033
- Figure 19: Europe Confocal Raman Spectroscopy Market Revenue (Million), by End User 2025 & 2033
- Figure 20: Europe Confocal Raman Spectroscopy Market Volume (Million), by End User 2025 & 2033
- Figure 21: Europe Confocal Raman Spectroscopy Market Revenue Share (%), by End User 2025 & 2033
- Figure 22: Europe Confocal Raman Spectroscopy Market Volume Share (%), by End User 2025 & 2033
- Figure 23: Europe Confocal Raman Spectroscopy Market Revenue (Million), by Country 2025 & 2033
- Figure 24: Europe Confocal Raman Spectroscopy Market Volume (Million), by Country 2025 & 2033
- Figure 25: Europe Confocal Raman Spectroscopy Market Revenue Share (%), by Country 2025 & 2033
- Figure 26: Europe Confocal Raman Spectroscopy Market Volume Share (%), by Country 2025 & 2033
- Figure 27: Asia Confocal Raman Spectroscopy Market Revenue (Million), by Type 2025 & 2033
- Figure 28: Asia Confocal Raman Spectroscopy Market Volume (Million), by Type 2025 & 2033
- Figure 29: Asia Confocal Raman Spectroscopy Market Revenue Share (%), by Type 2025 & 2033
- Figure 30: Asia Confocal Raman Spectroscopy Market Volume Share (%), by Type 2025 & 2033
- Figure 31: Asia Confocal Raman Spectroscopy Market Revenue (Million), by End User 2025 & 2033
- Figure 32: Asia Confocal Raman Spectroscopy Market Volume (Million), by End User 2025 & 2033
- Figure 33: Asia Confocal Raman Spectroscopy Market Revenue Share (%), by End User 2025 & 2033
- Figure 34: Asia Confocal Raman Spectroscopy Market Volume Share (%), by End User 2025 & 2033
- Figure 35: Asia Confocal Raman Spectroscopy Market Revenue (Million), by Country 2025 & 2033
- Figure 36: Asia Confocal Raman Spectroscopy Market Volume (Million), by Country 2025 & 2033
- Figure 37: Asia Confocal Raman Spectroscopy Market Revenue Share (%), by Country 2025 & 2033
- Figure 38: Asia Confocal Raman Spectroscopy Market Volume Share (%), by Country 2025 & 2033
- Figure 39: Australia and New Zealand Confocal Raman Spectroscopy Market Revenue (Million), by Type 2025 & 2033
- Figure 40: Australia and New Zealand Confocal Raman Spectroscopy Market Volume (Million), by Type 2025 & 2033
- Figure 41: Australia and New Zealand Confocal Raman Spectroscopy Market Revenue Share (%), by Type 2025 & 2033
- Figure 42: Australia and New Zealand Confocal Raman Spectroscopy Market Volume Share (%), by Type 2025 & 2033
- Figure 43: Australia and New Zealand Confocal Raman Spectroscopy Market Revenue (Million), by End User 2025 & 2033
- Figure 44: Australia and New Zealand Confocal Raman Spectroscopy Market Volume (Million), by End User 2025 & 2033
- Figure 45: Australia and New Zealand Confocal Raman Spectroscopy Market Revenue Share (%), by End User 2025 & 2033
- Figure 46: Australia and New Zealand Confocal Raman Spectroscopy Market Volume Share (%), by End User 2025 & 2033
- Figure 47: Australia and New Zealand Confocal Raman Spectroscopy Market Revenue (Million), by Country 2025 & 2033
- Figure 48: Australia and New Zealand Confocal Raman Spectroscopy Market Volume (Million), by Country 2025 & 2033
- Figure 49: Australia and New Zealand Confocal Raman Spectroscopy Market Revenue Share (%), by Country 2025 & 2033
- Figure 50: Australia and New Zealand Confocal Raman Spectroscopy Market Volume Share (%), by Country 2025 & 2033
- Figure 51: Latin America Confocal Raman Spectroscopy Market Revenue (Million), by Type 2025 & 2033
- Figure 52: Latin America Confocal Raman Spectroscopy Market Volume (Million), by Type 2025 & 2033
- Figure 53: Latin America Confocal Raman Spectroscopy Market Revenue Share (%), by Type 2025 & 2033
- Figure 54: Latin America Confocal Raman Spectroscopy Market Volume Share (%), by Type 2025 & 2033
- Figure 55: Latin America Confocal Raman Spectroscopy Market Revenue (Million), by End User 2025 & 2033
- Figure 56: Latin America Confocal Raman Spectroscopy Market Volume (Million), by End User 2025 & 2033
- Figure 57: Latin America Confocal Raman Spectroscopy Market Revenue Share (%), by End User 2025 & 2033
- Figure 58: Latin America Confocal Raman Spectroscopy Market Volume Share (%), by End User 2025 & 2033
- Figure 59: Latin America Confocal Raman Spectroscopy Market Revenue (Million), by Country 2025 & 2033
- Figure 60: Latin America Confocal Raman Spectroscopy Market Volume (Million), by Country 2025 & 2033
- Figure 61: Latin America Confocal Raman Spectroscopy Market Revenue Share (%), by Country 2025 & 2033
- Figure 62: Latin America Confocal Raman Spectroscopy Market Volume Share (%), by Country 2025 & 2033
- Figure 63: Middle East and Africa Confocal Raman Spectroscopy Market Revenue (Million), by Type 2025 & 2033
- Figure 64: Middle East and Africa Confocal Raman Spectroscopy Market Volume (Million), by Type 2025 & 2033
- Figure 65: Middle East and Africa Confocal Raman Spectroscopy Market Revenue Share (%), by Type 2025 & 2033
- Figure 66: Middle East and Africa Confocal Raman Spectroscopy Market Volume Share (%), by Type 2025 & 2033
- Figure 67: Middle East and Africa Confocal Raman Spectroscopy Market Revenue (Million), by End User 2025 & 2033
- Figure 68: Middle East and Africa Confocal Raman Spectroscopy Market Volume (Million), by End User 2025 & 2033
- Figure 69: Middle East and Africa Confocal Raman Spectroscopy Market Revenue Share (%), by End User 2025 & 2033
- Figure 70: Middle East and Africa Confocal Raman Spectroscopy Market Volume Share (%), by End User 2025 & 2033
- Figure 71: Middle East and Africa Confocal Raman Spectroscopy Market Revenue (Million), by Country 2025 & 2033
- Figure 72: Middle East and Africa Confocal Raman Spectroscopy Market Volume (Million), by Country 2025 & 2033
- Figure 73: Middle East and Africa Confocal Raman Spectroscopy Market Revenue Share (%), by Country 2025 & 2033
- Figure 74: Middle East and Africa Confocal Raman Spectroscopy Market Volume Share (%), by Country 2025 & 2033
List of Tables
- Table 1: Global Confocal Raman Spectroscopy Market Revenue Million Forecast, by Type 2020 & 2033
- Table 2: Global Confocal Raman Spectroscopy Market Volume Million Forecast, by Type 2020 & 2033
- Table 3: Global Confocal Raman Spectroscopy Market Revenue Million Forecast, by End User 2020 & 2033
- Table 4: Global Confocal Raman Spectroscopy Market Volume Million Forecast, by End User 2020 & 2033
- Table 5: Global Confocal Raman Spectroscopy Market Revenue Million Forecast, by Region 2020 & 2033
- Table 6: Global Confocal Raman Spectroscopy Market Volume Million Forecast, by Region 2020 & 2033
- Table 7: Global Confocal Raman Spectroscopy Market Revenue Million Forecast, by Type 2020 & 2033
- Table 8: Global Confocal Raman Spectroscopy Market Volume Million Forecast, by Type 2020 & 2033
- Table 9: Global Confocal Raman Spectroscopy Market Revenue Million Forecast, by End User 2020 & 2033
- Table 10: Global Confocal Raman Spectroscopy Market Volume Million Forecast, by End User 2020 & 2033
- Table 11: Global Confocal Raman Spectroscopy Market Revenue Million Forecast, by Country 2020 & 2033
- Table 12: Global Confocal Raman Spectroscopy Market Volume Million Forecast, by Country 2020 & 2033
- Table 13: Global Confocal Raman Spectroscopy Market Revenue Million Forecast, by Type 2020 & 2033
- Table 14: Global Confocal Raman Spectroscopy Market Volume Million Forecast, by Type 2020 & 2033
- Table 15: Global Confocal Raman Spectroscopy Market Revenue Million Forecast, by End User 2020 & 2033
- Table 16: Global Confocal Raman Spectroscopy Market Volume Million Forecast, by End User 2020 & 2033
- Table 17: Global Confocal Raman Spectroscopy Market Revenue Million Forecast, by Country 2020 & 2033
- Table 18: Global Confocal Raman Spectroscopy Market Volume Million Forecast, by Country 2020 & 2033
- Table 19: Global Confocal Raman Spectroscopy Market Revenue Million Forecast, by Type 2020 & 2033
- Table 20: Global Confocal Raman Spectroscopy Market Volume Million Forecast, by Type 2020 & 2033
- Table 21: Global Confocal Raman Spectroscopy Market Revenue Million Forecast, by End User 2020 & 2033
- Table 22: Global Confocal Raman Spectroscopy Market Volume Million Forecast, by End User 2020 & 2033
- Table 23: Global Confocal Raman Spectroscopy Market Revenue Million Forecast, by Country 2020 & 2033
- Table 24: Global Confocal Raman Spectroscopy Market Volume Million Forecast, by Country 2020 & 2033
- Table 25: Global Confocal Raman Spectroscopy Market Revenue Million Forecast, by Type 2020 & 2033
- Table 26: Global Confocal Raman Spectroscopy Market Volume Million Forecast, by Type 2020 & 2033
- Table 27: Global Confocal Raman Spectroscopy Market Revenue Million Forecast, by End User 2020 & 2033
- Table 28: Global Confocal Raman Spectroscopy Market Volume Million Forecast, by End User 2020 & 2033
- Table 29: Global Confocal Raman Spectroscopy Market Revenue Million Forecast, by Country 2020 & 2033
- Table 30: Global Confocal Raman Spectroscopy Market Volume Million Forecast, by Country 2020 & 2033
- Table 31: Global Confocal Raman Spectroscopy Market Revenue Million Forecast, by Type 2020 & 2033
- Table 32: Global Confocal Raman Spectroscopy Market Volume Million Forecast, by Type 2020 & 2033
- Table 33: Global Confocal Raman Spectroscopy Market Revenue Million Forecast, by End User 2020 & 2033
- Table 34: Global Confocal Raman Spectroscopy Market Volume Million Forecast, by End User 2020 & 2033
- Table 35: Global Confocal Raman Spectroscopy Market Revenue Million Forecast, by Country 2020 & 2033
- Table 36: Global Confocal Raman Spectroscopy Market Volume Million Forecast, by Country 2020 & 2033
- Table 37: Global Confocal Raman Spectroscopy Market Revenue Million Forecast, by Type 2020 & 2033
- Table 38: Global Confocal Raman Spectroscopy Market Volume Million Forecast, by Type 2020 & 2033
- Table 39: Global Confocal Raman Spectroscopy Market Revenue Million Forecast, by End User 2020 & 2033
- Table 40: Global Confocal Raman Spectroscopy Market Volume Million Forecast, by End User 2020 & 2033
- Table 41: Global Confocal Raman Spectroscopy Market Revenue Million Forecast, by Country 2020 & 2033
- Table 42: Global Confocal Raman Spectroscopy Market Volume Million Forecast, by Country 2020 & 2033
Frequently Asked Questions
1. What is the projected Compound Annual Growth Rate (CAGR) of the Confocal Raman Spectroscopy Market?
The projected CAGR is approximately 8.00%.
2. Which companies are prominent players in the Confocal Raman Spectroscopy Market?
Key companies in the market include HORIBA Ltd, Rikagu Corporation, Agilent Technologies, Oxford Instruments, PerkinElmer Inc, Renishaw PLC, Bruker Corporation, Thermo Fisher Scientific Inc, Mettler Toledo, Hamamatsu Photonics KK*List Not Exhaustive.
3. What are the main segments of the Confocal Raman Spectroscopy Market?
The market segments include Type, End User.
4. Can you provide details about the market size?
The market size is estimated to be USD 551.12 Million as of 2022.
5. What are some drivers contributing to market growth?
Rising Investment Towards Drug Development; Growing Application in Forensic Science. Food Safety. and Gemology.
6. What are the notable trends driving market growth?
The Portable Segment is Driving Popularity.
7. Are there any restraints impacting market growth?
Rising Investment Towards Drug Development; Growing Application in Forensic Science. Food Safety. and Gemology.
8. Can you provide examples of recent developments in the market?
June 2024: The Shimadzu AIRsight Infrared/Raman Microscope revolutionized molecular analysis. By merging Fourier transform infrared (FTIR) and Raman spectroscopy into a single instrument, it equips researchers with a robust tool for in-depth sample examination. This innovation allows for the simultaneous acquisition of both spectra from a stationary sample, streamlining the process and enhancing the accuracy of technique correlation.February 2024: Brukar Corporation acquired Nanophoton Corporation, which is based in Osaka and boasts a diverse range of cutting-edge Raman microscopes, catering to both academic and industrial research, predominantly in Japan. This strategic move enhanced Bruker's molecular microscopy offerings. The company aims to promote Nanophoton's rapid, adaptable, and sensitive Raman systems globally across various fields, including life sciences, biopharma, advanced materials, semiconductors, and polymers.
9. What pricing options are available for accessing the report?
Pricing options include single-user, multi-user, and enterprise licenses priced at USD 4750, USD 5250, and USD 8750 respectively.
10. Is the market size provided in terms of value or volume?
The market size is provided in terms of value, measured in Million and volume, measured in Million.
11. Are there any specific market keywords associated with the report?
Yes, the market keyword associated with the report is "Confocal Raman Spectroscopy Market," which aids in identifying and referencing the specific market segment covered.
12. How do I determine which pricing option suits my needs best?
The pricing options vary based on user requirements and access needs. Individual users may opt for single-user licenses, while businesses requiring broader access may choose multi-user or enterprise licenses for cost-effective access to the report.
13. Are there any additional resources or data provided in the Confocal Raman Spectroscopy Market report?
While the report offers comprehensive insights, it's advisable to review the specific contents or supplementary materials provided to ascertain if additional resources or data are available.
14. How can I stay updated on further developments or reports in the Confocal Raman Spectroscopy Market?
To stay informed about further developments, trends, and reports in the Confocal Raman Spectroscopy Market, consider subscribing to industry newsletters, following relevant companies and organizations, or regularly checking reputable industry news sources and publications.
Methodology
Step 1 - Identification of Relevant Samples Size from Population Database


Step 2 - Approaches for Defining Global Market Size (Value, Volume* & Price*)

Note*: In applicable scenarios
Step 3 - Data Sources
Primary Research
- Web Analytics
- Survey Reports
- Research Institute
- Latest Research Reports
- Opinion Leaders
Secondary Research
- Annual Reports
- White Paper
- Latest Press Release
- Industry Association
- Paid Database
- Investor Presentations

Step 4 - Data Triangulation
Involves using different sources of information in order to increase the validity of a study
These sources are likely to be stakeholders in a program - participants, other researchers, program staff, other community members, and so on.
Then we put all data in single framework & apply various statistical tools to find out the dynamic on the market.
During the analysis stage, feedback from the stakeholder groups would be compared to determine areas of agreement as well as areas of divergence