

Key Insights
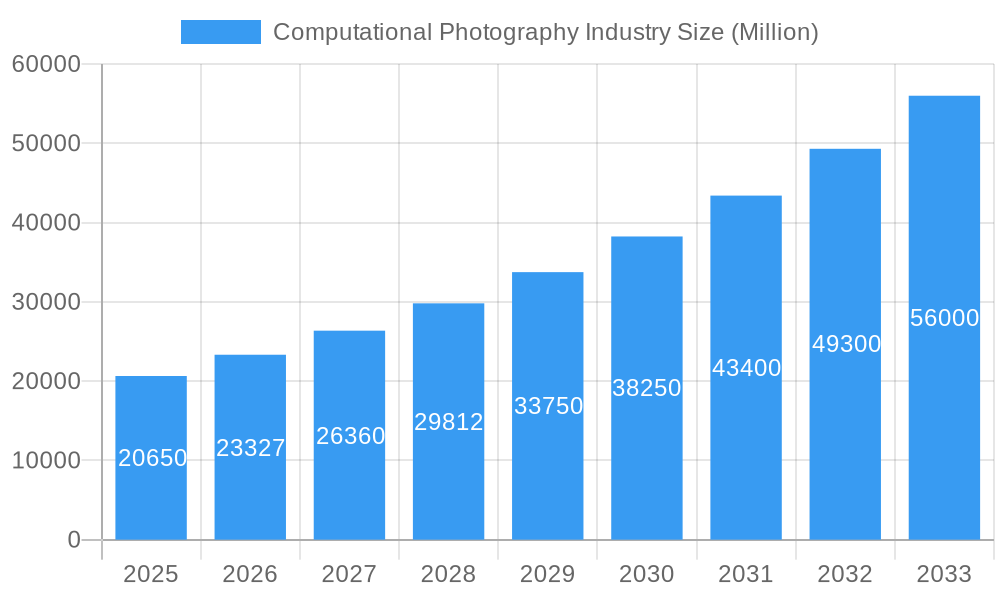
The computational photography market, valued at $20.65 billion in 2025, is experiencing robust growth, projected to expand at a compound annual growth rate (CAGR) of 13.04% from 2025 to 2033. This surge is driven by several key factors. The increasing demand for high-quality images and videos in smartphones is a primary driver, fueling innovation in camera module technology and image processing software. Advancements in artificial intelligence (AI) and machine learning (ML) are enabling sophisticated features like computational zoom, bokeh effects, and low-light enhancement, further boosting market appeal. The proliferation of machine vision applications across diverse sectors, including automotive, healthcare, and robotics, also contributes significantly to market expansion. Furthermore, the development of multi-lens camera systems and innovative sensor technologies are pushing the boundaries of photographic capabilities, creating new opportunities for growth. The market is segmented by camera type (single/dual-lens, 16-lens, etc.), application (smartphone, machine vision, others), and offerings (camera modules, software). Leading players like Qualcomm, Apple, Google, and others are constantly innovating to enhance image quality, processing speed, and overall user experience, fostering competition and market dynamism.
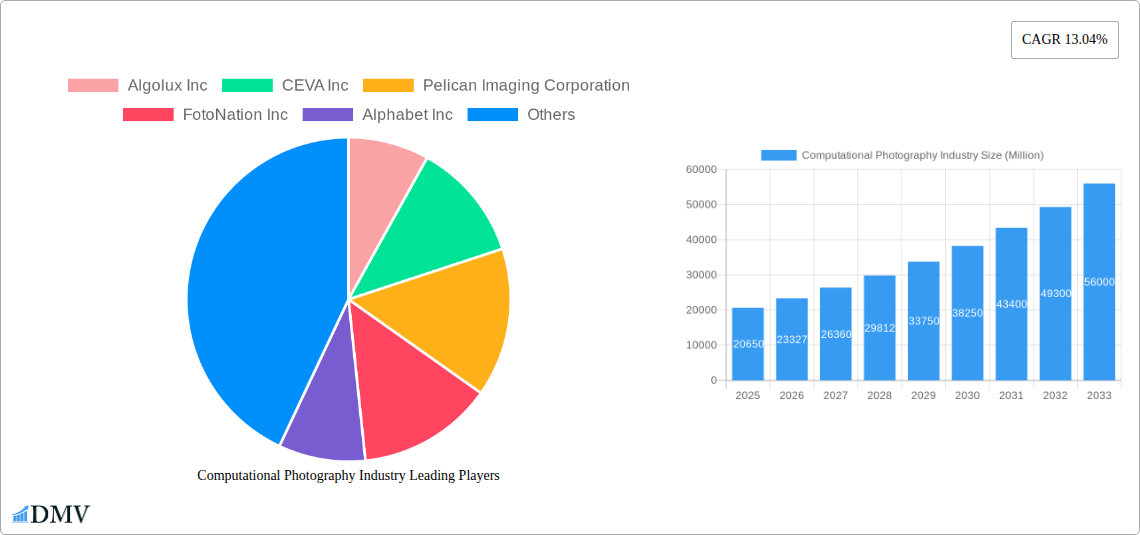
Computational Photography Industry Market Size (In Billion)
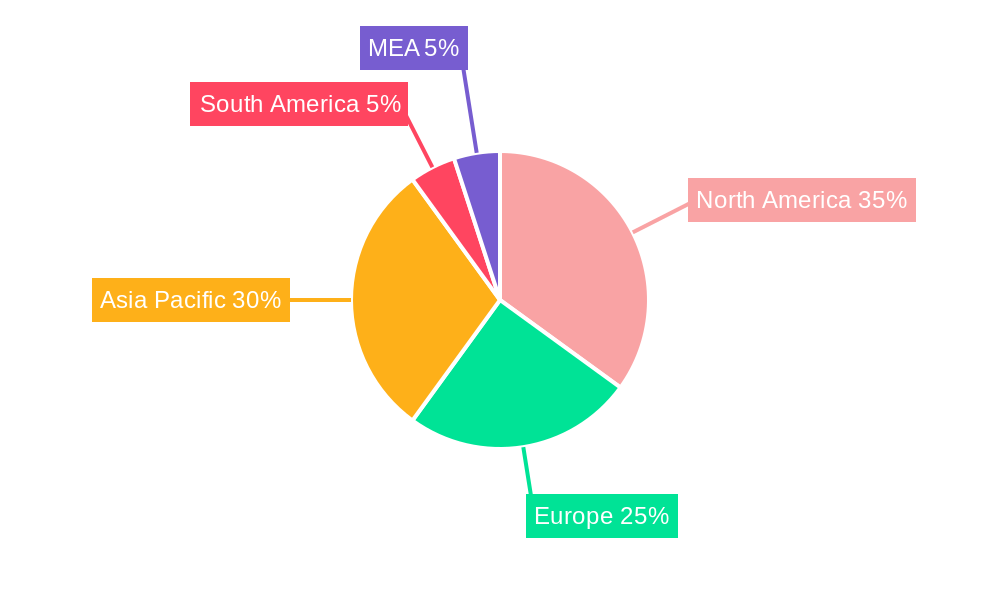
The geographical distribution of the market reflects the global adoption of smartphones and advanced imaging technologies. North America and Asia-Pacific currently hold significant market share due to high technological adoption rates and strong presence of key players. However, regions like Europe and South America are exhibiting strong growth potential driven by increasing smartphone penetration and rising disposable incomes. The market, while experiencing rapid growth, faces certain challenges. High development costs for advanced camera systems and the complexity of integrating AI/ML algorithms into camera modules can serve as restraints. However, ongoing technological advancements and the increasing demand for enhanced image quality across diverse applications are poised to mitigate these challenges and ensure sustained market expansion over the forecast period.
Computational Photography Industry Company Market Share
Computational Photography Industry Market Report: 2019-2033
This comprehensive report provides a detailed analysis of the Computational Photography Industry, offering valuable insights into market trends, technological advancements, and future growth prospects. With a study period spanning 2019-2033, a base year of 2025, and a forecast period of 2025-2033, this report is an essential resource for stakeholders seeking to understand and capitalize on the burgeoning opportunities within this dynamic sector. The global market is estimated to reach xx Million by 2025 and is projected to experience significant growth throughout the forecast period.
Computational Photography Industry Market Composition & Trends
The Computational Photography market is characterized by a dynamic interplay of technological innovation, intense competition, and evolving consumer preferences. Market concentration is moderate, with several key players holding significant market share, though smaller, specialized firms also contribute significantly to innovation. The market share distribution among leading companies like Qualcomm Technologies Inc., Apple Inc., and Nvidia Corporation is currently estimated at xx%, xx%, and xx% respectively, with the remaining share distributed among other prominent players and smaller niche players.
- Innovation Catalysts: Advancements in AI, machine learning, and sensor technologies are driving rapid product innovation, leading to enhanced image quality, advanced features, and new applications.
- Regulatory Landscape: Government regulations concerning data privacy and security are impacting the development and deployment of computational photography technologies.
- Substitute Products: Traditional optical camera technologies pose a mild threat, but the superior image quality and functionality offered by computational photography continue to fuel adoption.
- End-User Profiles: The primary end users are smartphone manufacturers, automotive companies, security companies, and various industrial automation and robotics businesses.
- M&A Activities: The industry has witnessed a notable number of mergers and acquisitions, with deal values exceeding xx Million in the past five years. These activities are driven by a need to secure technological capabilities and expand market reach.
Computational Photography Industry Industry Evolution
The Computational Photography industry has seen explosive growth over the past five years, driven by several factors. The historical period (2019-2024) witnessed a Compound Annual Growth Rate (CAGR) of xx%, with the market exhibiting strong momentum. This growth is fueled by the increasing demand for high-quality images and videos across diverse applications, combined with rapid advancements in image processing algorithms and sensor technologies. Smartphone cameras, in particular, have witnessed significant improvement in image quality through the adoption of computational photography techniques. The adoption rate of computational photography in smartphone cameras has increased from xx% in 2019 to xx% in 2024, with a projected xx% adoption rate by 2033. The rise of AI-powered features like scene recognition and object tracking further enhances user experience and market demand.
Leading Regions, Countries, or Segments in Computational Photography Industry
The North American region currently dominates the computational photography market, followed by Asia-Pacific. This dominance is primarily attributed to:
- North America: High smartphone penetration, substantial R&D investments, and strong presence of key industry players.
- Asia-Pacific: Rapid growth in smartphone adoption, especially in countries like China and India, along with increasing investments in manufacturing.
Dominant Segments:
- Type: Smartphone Cameras currently hold the largest market share, driven by widespread smartphone adoption. However, machine vision applications are expected to show significant growth in the forecast period. 16-lens cameras represent a niche, high-end market.
- Application: The smartphone camera segment remains dominant, but machine vision cameras are experiencing rapid growth, driven by advancements in AI and robotics.
- Offerings: Software solutions are growing in importance alongside camera modules, as software-defined image processing capabilities become more crucial.
Computational Photography Industry Product Innovations
Recent innovations in computational photography include advancements in multi-camera systems, enabling superior depth sensing and image quality. High-dynamic-range (HDR) imaging and AI-powered scene recognition are now commonplace, and new techniques like light field capture are being integrated into higher-end devices. These features enhance image clarity, detail, and overall user experience, creating unique selling propositions for manufacturers.
Propelling Factors for Computational Photography Industry Growth
Several factors contribute to the industry's growth trajectory:
- Technological Advancements: Continuous improvements in image sensors, processing algorithms (AI/ML), and computational power are significantly enhancing image quality.
- Economic Factors: Increased disposable income and rising demand for high-quality imaging in consumer electronics and industrial applications are fueling market expansion.
- Regulatory Support: Government initiatives supporting technological innovation and digital transformation are fostering a supportive environment for the industry.
Obstacles in the Computational Photography Industry Market
Challenges include:
- Regulatory Challenges: Data privacy concerns and intellectual property rights issues could impact market growth.
- Supply Chain Disruptions: Global supply chain vulnerabilities can impact the availability of components and increase production costs.
- Competitive Pressures: Intense competition among established players and the emergence of new entrants can affect pricing and profit margins.
Future Opportunities in Computational Photography Industry
Emerging opportunities lie in:
- Expansion into new markets: The Internet of Things (IoT) and augmented reality (AR) are generating significant demand for computational photography solutions.
- Development of new technologies: Advancements in 3D imaging, light field capture, and computational video will create new revenue streams.
- Meeting evolving consumer demands: Addressing the growing demand for high-quality, low-light photography and advanced video features will continue to drive innovation.
Major Players in the Computational Photography Industry Ecosystem
- Algolux Inc
- CEVA Inc
- Pelican Imaging Corporation
- FotoNation Inc
- Alphabet Inc
- Light Labs Inc
- Qualcomm Technologies Inc
- Almalence Inc
- Nvidia Corporation
- Apple Inc
Key Developments in Computational Photography Industry Industry
- February 2023: Qualcomm Technologies announced its 6th generation modem-to-antenna solution, supporting 5G Advanced, enhancing connectivity across various segments. This significantly improves performance for smartphone and other applications relying on high-speed connectivity.
- September 2022: Nvidia Corporation launched the Jetson Orin Nano system-on-modules, dramatically increasing performance for edge AI and robotics applications. This development expands opportunities within machine vision and other industrial applications of computational photography.
Strategic Computational Photography Industry Market Forecast
The Computational Photography market is poised for sustained growth over the next decade, driven by technological innovation, expanding applications, and increasing consumer demand. The continued integration of AI and machine learning into image processing will unlock new capabilities and create innovative imaging solutions across a wide range of industries. The market's evolution will be shaped by the ongoing competition among key players, the emergence of novel technologies, and the adaptation to evolving regulatory landscapes.
Computational Photography Industry Segmentation
-
1. Offerings
- 1.1. Camera Modules
- 1.2. Software
-
2. Type
- 2.1. Single- and Dual-Lens Cameras
- 2.2. 16-Lens Cameras
-
3. Application
- 3.1. Smartphone Cameras
- 3.2. Machine Vision Cameras
- 3.3. Other Applications
Computational Photography Industry Segmentation By Geography
- 1. North America
- 2. Europe
- 3. Asia Pacific
- 4. South America
- 5. Rest of the World
Computational Photography Industry Regional Market Share
Geographic Coverage of Computational Photography Industry
Computational Photography Industry REPORT HIGHLIGHTS
| Aspects | Details |
|---|---|
| Study Period | 2020-2034 |
| Base Year | 2025 |
| Estimated Year | 2026 |
| Forecast Period | 2026-2034 |
| Historical Period | 2020-2025 |
| Growth Rate | CAGR of 13.04% from 2020-2034 |
| Segmentation |
|
Table of Contents
- 1. Introduction
- 1.1. Research Scope
- 1.2. Market Segmentation
- 1.3. Research Objective
- 1.4. Definitions and Assumptions
- 2. Executive Summary
- 2.1. Market Snapshot
- 3. Market Dynamics
- 3.1. Market Drivers
- 3.2. Market Restrains
- 3.3. Market Trends
- 3.4. Market Opportunities
- 4. Market Factor Analysis
- 4.1. Porters Five Forces
- 4.1.1. Bargaining Power of Suppliers
- 4.1.2. Bargaining Power of Buyers
- 4.1.3. Threat of New Entrants
- 4.1.4. Threat of Substitutes
- 4.1.5. Competitive Rivalry
- 4.2. PESTEL analysis
- 4.3. BCG Analysis
- 4.3.1. Stars (High Growth, High Market Share)
- 4.3.2. Cash Cows (Low Growth, High Market Share)
- 4.3.3. Question Mark (High Growth, Low Market Share)
- 4.3.4. Dogs (Low Growth, Low Market Share)
- 4.4. Ansoff Matrix Analysis
- 4.5. Supply Chain Analysis
- 4.6. Regulatory Landscape
- 4.7. Current Market Potential and Opportunity Assessment (TAM–SAM–SOM Framework)
- 4.8. DMV Analyst Note
- 4.1. Porters Five Forces
- 5. Market Analysis, Insights and Forecast 2021-2033
- 5.1. Market Analysis, Insights and Forecast - by Offerings
- 5.1.1. Camera Modules
- 5.1.2. Software
- 5.2. Market Analysis, Insights and Forecast - by Type
- 5.2.1. Single- and Dual-Lens Cameras
- 5.2.2. 16-Lens Cameras
- 5.3. Market Analysis, Insights and Forecast - by Application
- 5.3.1. Smartphone Cameras
- 5.3.2. Machine Vision Cameras
- 5.3.3. Other Applications
- 5.4. Market Analysis, Insights and Forecast - by Region
- 5.4.1. North America
- 5.4.2. Europe
- 5.4.3. Asia Pacific
- 5.4.4. South America
- 5.4.5. Rest of the World
- 5.1. Market Analysis, Insights and Forecast - by Offerings
- 6. Global Computational Photography Industry Analysis, Insights and Forecast, 2021-2033
- 6.1. Market Analysis, Insights and Forecast - by Offerings
- 6.1.1. Camera Modules
- 6.1.2. Software
- 6.2. Market Analysis, Insights and Forecast - by Type
- 6.2.1. Single- and Dual-Lens Cameras
- 6.2.2. 16-Lens Cameras
- 6.3. Market Analysis, Insights and Forecast - by Application
- 6.3.1. Smartphone Cameras
- 6.3.2. Machine Vision Cameras
- 6.3.3. Other Applications
- 6.1. Market Analysis, Insights and Forecast - by Offerings
- 7. North America Computational Photography Industry Analysis, Insights and Forecast, 2020-2032
- 7.1. Market Analysis, Insights and Forecast - by Offerings
- 7.1.1. Camera Modules
- 7.1.2. Software
- 7.2. Market Analysis, Insights and Forecast - by Type
- 7.2.1. Single- and Dual-Lens Cameras
- 7.2.2. 16-Lens Cameras
- 7.3. Market Analysis, Insights and Forecast - by Application
- 7.3.1. Smartphone Cameras
- 7.3.2. Machine Vision Cameras
- 7.3.3. Other Applications
- 7.1. Market Analysis, Insights and Forecast - by Offerings
- 8. Europe Computational Photography Industry Analysis, Insights and Forecast, 2020-2032
- 8.1. Market Analysis, Insights and Forecast - by Offerings
- 8.1.1. Camera Modules
- 8.1.2. Software
- 8.2. Market Analysis, Insights and Forecast - by Type
- 8.2.1. Single- and Dual-Lens Cameras
- 8.2.2. 16-Lens Cameras
- 8.3. Market Analysis, Insights and Forecast - by Application
- 8.3.1. Smartphone Cameras
- 8.3.2. Machine Vision Cameras
- 8.3.3. Other Applications
- 8.1. Market Analysis, Insights and Forecast - by Offerings
- 9. Asia Pacific Computational Photography Industry Analysis, Insights and Forecast, 2020-2032
- 9.1. Market Analysis, Insights and Forecast - by Offerings
- 9.1.1. Camera Modules
- 9.1.2. Software
- 9.2. Market Analysis, Insights and Forecast - by Type
- 9.2.1. Single- and Dual-Lens Cameras
- 9.2.2. 16-Lens Cameras
- 9.3. Market Analysis, Insights and Forecast - by Application
- 9.3.1. Smartphone Cameras
- 9.3.2. Machine Vision Cameras
- 9.3.3. Other Applications
- 9.1. Market Analysis, Insights and Forecast - by Offerings
- 10. South America Computational Photography Industry Analysis, Insights and Forecast, 2020-2032
- 10.1. Market Analysis, Insights and Forecast - by Offerings
- 10.1.1. Camera Modules
- 10.1.2. Software
- 10.2. Market Analysis, Insights and Forecast - by Type
- 10.2.1. Single- and Dual-Lens Cameras
- 10.2.2. 16-Lens Cameras
- 10.3. Market Analysis, Insights and Forecast - by Application
- 10.3.1. Smartphone Cameras
- 10.3.2. Machine Vision Cameras
- 10.3.3. Other Applications
- 10.1. Market Analysis, Insights and Forecast - by Offerings
- 11. Rest of the World Computational Photography Industry Analysis, Insights and Forecast, 2020-2032
- 11.1. Market Analysis, Insights and Forecast - by Offerings
- 11.1.1. Camera Modules
- 11.1.2. Software
- 11.2. Market Analysis, Insights and Forecast - by Type
- 11.2.1. Single- and Dual-Lens Cameras
- 11.2.2. 16-Lens Cameras
- 11.3. Market Analysis, Insights and Forecast - by Application
- 11.3.1. Smartphone Cameras
- 11.3.2. Machine Vision Cameras
- 11.3.3. Other Applications
- 11.1. Market Analysis, Insights and Forecast - by Offerings
- 12. Competitive Analysis
- 12.1. Company Profiles
- 12.1.1 Algolux Inc
- 12.1.1.1. Company Overview
- 12.1.1.2. Products
- 12.1.1.3. Company Financials
- 12.1.1.4. SWOT Analysis
- 12.1.2 CEVA Inc
- 12.1.2.1. Company Overview
- 12.1.2.2. Products
- 12.1.2.3. Company Financials
- 12.1.2.4. SWOT Analysis
- 12.1.3 Pelican Imaging Corporation
- 12.1.3.1. Company Overview
- 12.1.3.2. Products
- 12.1.3.3. Company Financials
- 12.1.3.4. SWOT Analysis
- 12.1.4 FotoNation Inc
- 12.1.4.1. Company Overview
- 12.1.4.2. Products
- 12.1.4.3. Company Financials
- 12.1.4.4. SWOT Analysis
- 12.1.5 Alphabet Inc
- 12.1.5.1. Company Overview
- 12.1.5.2. Products
- 12.1.5.3. Company Financials
- 12.1.5.4. SWOT Analysis
- 12.1.6 Light Labs Inc
- 12.1.6.1. Company Overview
- 12.1.6.2. Products
- 12.1.6.3. Company Financials
- 12.1.6.4. SWOT Analysis
- 12.1.7 Qualcomm Technologies Inc
- 12.1.7.1. Company Overview
- 12.1.7.2. Products
- 12.1.7.3. Company Financials
- 12.1.7.4. SWOT Analysis
- 12.1.8 Almalence Inc
- 12.1.8.1. Company Overview
- 12.1.8.2. Products
- 12.1.8.3. Company Financials
- 12.1.8.4. SWOT Analysis
- 12.1.9 Nvidia Corporation
- 12.1.9.1. Company Overview
- 12.1.9.2. Products
- 12.1.9.3. Company Financials
- 12.1.9.4. SWOT Analysis
- 12.1.10 Apple Inc
- 12.1.10.1. Company Overview
- 12.1.10.2. Products
- 12.1.10.3. Company Financials
- 12.1.10.4. SWOT Analysis
- 12.1.1 Algolux Inc
- 12.2. Market Entropy
- 12.2.1 Company's Key Areas Served
- 12.2.2 Recent Developments
- 12.3. Company Market Share Analysis 2025
- 12.3.1 Top 5 Companies Market Share Analysis
- 12.3.2 Top 3 Companies Market Share Analysis
- 12.4. List of Potential Customers
- 13. Research Methodology
List of Figures
- Figure 1: Global Computational Photography Industry Revenue Breakdown (Million, %) by Region 2025 & 2033
- Figure 2: North America Computational Photography Industry Revenue (Million), by Offerings 2025 & 2033
- Figure 3: North America Computational Photography Industry Revenue Share (%), by Offerings 2025 & 2033
- Figure 4: North America Computational Photography Industry Revenue (Million), by Type 2025 & 2033
- Figure 5: North America Computational Photography Industry Revenue Share (%), by Type 2025 & 2033
- Figure 6: North America Computational Photography Industry Revenue (Million), by Application 2025 & 2033
- Figure 7: North America Computational Photography Industry Revenue Share (%), by Application 2025 & 2033
- Figure 8: North America Computational Photography Industry Revenue (Million), by Country 2025 & 2033
- Figure 9: North America Computational Photography Industry Revenue Share (%), by Country 2025 & 2033
- Figure 10: Europe Computational Photography Industry Revenue (Million), by Offerings 2025 & 2033
- Figure 11: Europe Computational Photography Industry Revenue Share (%), by Offerings 2025 & 2033
- Figure 12: Europe Computational Photography Industry Revenue (Million), by Type 2025 & 2033
- Figure 13: Europe Computational Photography Industry Revenue Share (%), by Type 2025 & 2033
- Figure 14: Europe Computational Photography Industry Revenue (Million), by Application 2025 & 2033
- Figure 15: Europe Computational Photography Industry Revenue Share (%), by Application 2025 & 2033
- Figure 16: Europe Computational Photography Industry Revenue (Million), by Country 2025 & 2033
- Figure 17: Europe Computational Photography Industry Revenue Share (%), by Country 2025 & 2033
- Figure 18: Asia Pacific Computational Photography Industry Revenue (Million), by Offerings 2025 & 2033
- Figure 19: Asia Pacific Computational Photography Industry Revenue Share (%), by Offerings 2025 & 2033
- Figure 20: Asia Pacific Computational Photography Industry Revenue (Million), by Type 2025 & 2033
- Figure 21: Asia Pacific Computational Photography Industry Revenue Share (%), by Type 2025 & 2033
- Figure 22: Asia Pacific Computational Photography Industry Revenue (Million), by Application 2025 & 2033
- Figure 23: Asia Pacific Computational Photography Industry Revenue Share (%), by Application 2025 & 2033
- Figure 24: Asia Pacific Computational Photography Industry Revenue (Million), by Country 2025 & 2033
- Figure 25: Asia Pacific Computational Photography Industry Revenue Share (%), by Country 2025 & 2033
- Figure 26: South America Computational Photography Industry Revenue (Million), by Offerings 2025 & 2033
- Figure 27: South America Computational Photography Industry Revenue Share (%), by Offerings 2025 & 2033
- Figure 28: South America Computational Photography Industry Revenue (Million), by Type 2025 & 2033
- Figure 29: South America Computational Photography Industry Revenue Share (%), by Type 2025 & 2033
- Figure 30: South America Computational Photography Industry Revenue (Million), by Application 2025 & 2033
- Figure 31: South America Computational Photography Industry Revenue Share (%), by Application 2025 & 2033
- Figure 32: South America Computational Photography Industry Revenue (Million), by Country 2025 & 2033
- Figure 33: South America Computational Photography Industry Revenue Share (%), by Country 2025 & 2033
- Figure 34: Rest of the World Computational Photography Industry Revenue (Million), by Offerings 2025 & 2033
- Figure 35: Rest of the World Computational Photography Industry Revenue Share (%), by Offerings 2025 & 2033
- Figure 36: Rest of the World Computational Photography Industry Revenue (Million), by Type 2025 & 2033
- Figure 37: Rest of the World Computational Photography Industry Revenue Share (%), by Type 2025 & 2033
- Figure 38: Rest of the World Computational Photography Industry Revenue (Million), by Application 2025 & 2033
- Figure 39: Rest of the World Computational Photography Industry Revenue Share (%), by Application 2025 & 2033
- Figure 40: Rest of the World Computational Photography Industry Revenue (Million), by Country 2025 & 2033
- Figure 41: Rest of the World Computational Photography Industry Revenue Share (%), by Country 2025 & 2033
List of Tables
- Table 1: Global Computational Photography Industry Revenue Million Forecast, by Offerings 2020 & 2033
- Table 2: Global Computational Photography Industry Revenue Million Forecast, by Type 2020 & 2033
- Table 3: Global Computational Photography Industry Revenue Million Forecast, by Application 2020 & 2033
- Table 4: Global Computational Photography Industry Revenue Million Forecast, by Region 2020 & 2033
- Table 5: Global Computational Photography Industry Revenue Million Forecast, by Offerings 2020 & 2033
- Table 6: Global Computational Photography Industry Revenue Million Forecast, by Type 2020 & 2033
- Table 7: Global Computational Photography Industry Revenue Million Forecast, by Application 2020 & 2033
- Table 8: Global Computational Photography Industry Revenue Million Forecast, by Country 2020 & 2033
- Table 9: Global Computational Photography Industry Revenue Million Forecast, by Offerings 2020 & 2033
- Table 10: Global Computational Photography Industry Revenue Million Forecast, by Type 2020 & 2033
- Table 11: Global Computational Photography Industry Revenue Million Forecast, by Application 2020 & 2033
- Table 12: Global Computational Photography Industry Revenue Million Forecast, by Country 2020 & 2033
- Table 13: Global Computational Photography Industry Revenue Million Forecast, by Offerings 2020 & 2033
- Table 14: Global Computational Photography Industry Revenue Million Forecast, by Type 2020 & 2033
- Table 15: Global Computational Photography Industry Revenue Million Forecast, by Application 2020 & 2033
- Table 16: Global Computational Photography Industry Revenue Million Forecast, by Country 2020 & 2033
- Table 17: Global Computational Photography Industry Revenue Million Forecast, by Offerings 2020 & 2033
- Table 18: Global Computational Photography Industry Revenue Million Forecast, by Type 2020 & 2033
- Table 19: Global Computational Photography Industry Revenue Million Forecast, by Application 2020 & 2033
- Table 20: Global Computational Photography Industry Revenue Million Forecast, by Country 2020 & 2033
- Table 21: Global Computational Photography Industry Revenue Million Forecast, by Offerings 2020 & 2033
- Table 22: Global Computational Photography Industry Revenue Million Forecast, by Type 2020 & 2033
- Table 23: Global Computational Photography Industry Revenue Million Forecast, by Application 2020 & 2033
- Table 24: Global Computational Photography Industry Revenue Million Forecast, by Country 2020 & 2033
Frequently Asked Questions
1. What is the projected Compound Annual Growth Rate (CAGR) of the Computational Photography Industry?
The projected CAGR is approximately 13.04%.
2. Which companies are prominent players in the Computational Photography Industry?
Key companies in the market include Algolux Inc, CEVA Inc, Pelican Imaging Corporation, FotoNation Inc, Alphabet Inc, Light Labs Inc, Qualcomm Technologies Inc, Almalence Inc, Nvidia Corporation, Apple Inc.
3. What are the main segments of the Computational Photography Industry?
The market segments include Offerings, Type, Application.
4. Can you provide details about the market size?
The market size is estimated to be USD 20.65 Million as of 2022.
5. What are some drivers contributing to market growth?
Growing Adoption of Image Fusion Technique to Achieve High-quality Image; Increasing Demand for High-resolution Computational Cameras in Machine Vision for Autonomous Vehicle.
6. What are the notable trends driving market growth?
Smartphone Cameras to Witness Significant Market Growth.
7. Are there any restraints impacting market growth?
High Manufacturing and Maintenance Costs.
8. Can you provide examples of recent developments in the market?
February 2023: Qualcomm Technologies has announced the 6th generation modem-to-antenna solution is the first ready to support 5G Advanced, the next phase of 5G. It introduces a new architecture and software suite and includes numerous world's first features to push the boundaries of connectivity, including coverage, latency, power efficiency, and mobility. Snapdragon X75 technologies and innovations empower OEMs to create next-generation experiences across segments, including smartphones, mobile broadband, automotive, compute, industrial IoT, fixed wireless access, and 5G private networks.
9. What pricing options are available for accessing the report?
Pricing options include single-user, multi-user, and enterprise licenses priced at USD 4750, USD 5250, and USD 8750 respectively.
10. Is the market size provided in terms of value or volume?
The market size is provided in terms of value, measured in Million.
11. Are there any specific market keywords associated with the report?
Yes, the market keyword associated with the report is "Computational Photography Industry," which aids in identifying and referencing the specific market segment covered.
12. How do I determine which pricing option suits my needs best?
The pricing options vary based on user requirements and access needs. Individual users may opt for single-user licenses, while businesses requiring broader access may choose multi-user or enterprise licenses for cost-effective access to the report.
13. Are there any additional resources or data provided in the Computational Photography Industry report?
While the report offers comprehensive insights, it's advisable to review the specific contents or supplementary materials provided to ascertain if additional resources or data are available.
14. How can I stay updated on further developments or reports in the Computational Photography Industry?
To stay informed about further developments, trends, and reports in the Computational Photography Industry, consider subscribing to industry newsletters, following relevant companies and organizations, or regularly checking reputable industry news sources and publications.
Methodology
Step 1 - Identification of Relevant Samples Size from Population Database


Step 2 - Approaches for Defining Global Market Size (Value, Volume* & Price*)

Note*: In applicable scenarios
Step 3 - Data Sources
Primary Research
- Web Analytics
- Survey Reports
- Research Institute
- Latest Research Reports
- Opinion Leaders
Secondary Research
- Annual Reports
- White Paper
- Latest Press Release
- Industry Association
- Paid Database
- Investor Presentations

Step 4 - Data Triangulation
Involves using different sources of information in order to increase the validity of a study
These sources are likely to be stakeholders in a program - participants, other researchers, program staff, other community members, and so on.
Then we put all data in single framework & apply various statistical tools to find out the dynamic on the market.
During the analysis stage, feedback from the stakeholder groups would be compared to determine areas of agreement as well as areas of divergence