

Key Insights
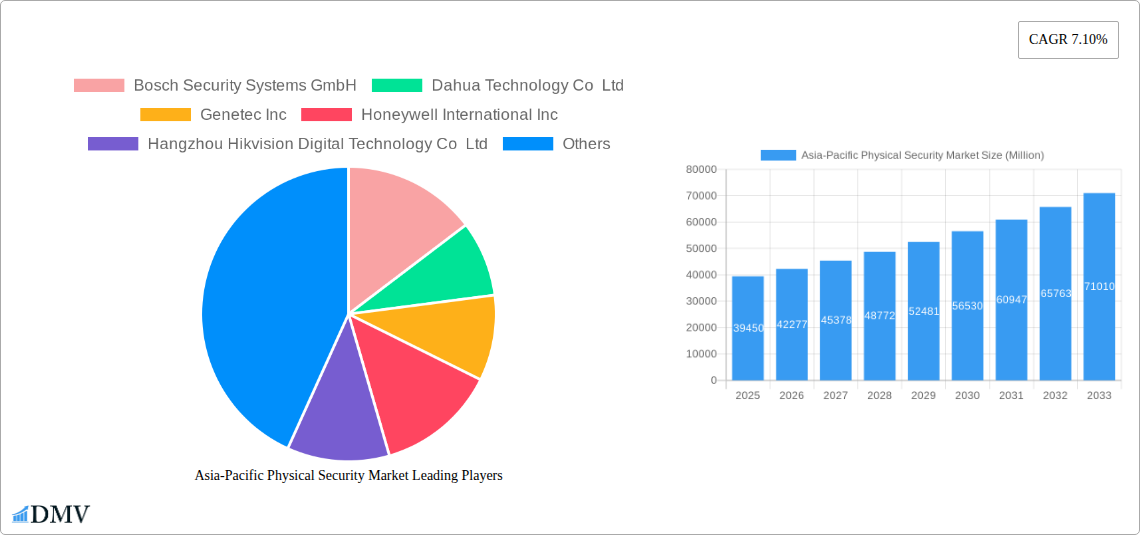
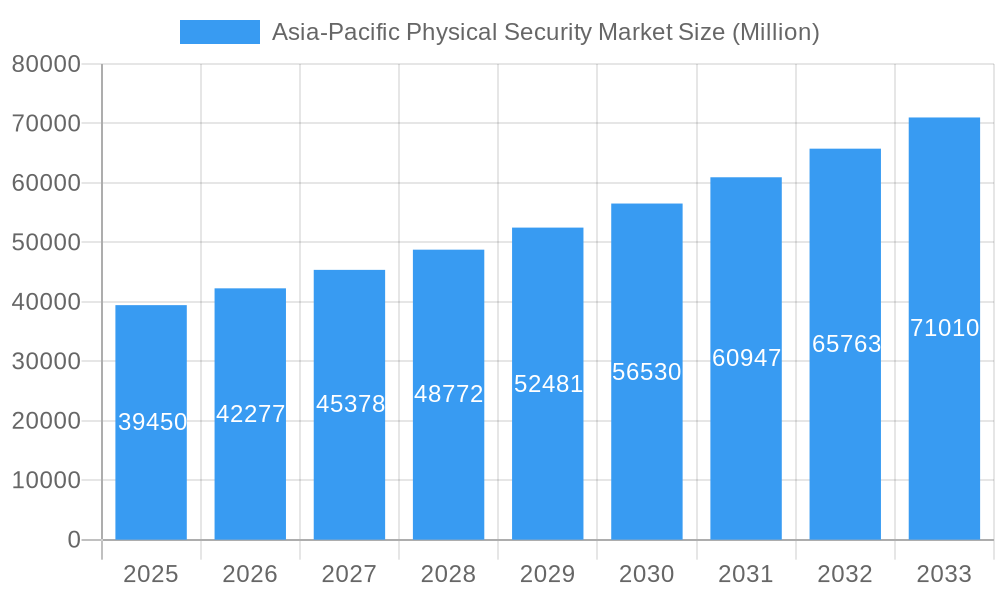
The Asia-Pacific physical security market is experiencing robust growth, projected to reach \$39.45 billion in 2025 and maintain a Compound Annual Growth Rate (CAGR) of 7.10% from 2025 to 2033. This expansion is fueled by several key drivers. Firstly, increasing urbanization and economic development across the region are creating a surge in demand for advanced security solutions in both public and private sectors. The rise in cybercrime and terrorism further necessitates sophisticated surveillance systems and access control technologies. Government initiatives promoting smart city development and national security are also contributing significantly to market growth. Furthermore, technological advancements such as the integration of Artificial Intelligence (AI), Internet of Things (IoT), and cloud computing are enhancing the capabilities and efficiency of physical security systems, driving adoption among businesses and consumers. The market is segmented by technology (video surveillance, access control, intrusion detection, perimeter security, etc.), application (commercial, residential, government, critical infrastructure), and country. Leading players like Bosch, Dahua, Hikvision, Honeywell, and Johnson Controls are actively competing to capitalize on these opportunities, investing heavily in research and development and strategic partnerships to expand their market share.
Asia-Pacific Physical Security Market Market Size (In Billion)
Despite the promising outlook, the Asia-Pacific physical security market faces certain challenges. High initial investment costs associated with deploying advanced security infrastructure can hinder adoption, particularly among small and medium-sized enterprises (SMEs). Data privacy concerns and the need for robust cybersecurity measures are also crucial factors influencing market growth. However, the rising awareness of security vulnerabilities and increasing regulatory pressure on data protection are expected to drive investments in sophisticated and compliant solutions, offsetting these restraints in the long term. The market is poised for sustained growth, propelled by a confluence of technological innovation, infrastructure development, and heightened security concerns across the region. The continuous development of innovative products, coupled with strategic partnerships and acquisitions among market players, will further shape the landscape of the Asia-Pacific physical security market in the coming years.
Asia-Pacific Physical Security Market Company Market Share
Asia-Pacific Physical Security Market: A Comprehensive Report (2019-2033)
This insightful report provides a detailed analysis of the Asia-Pacific physical security market, offering valuable insights for stakeholders seeking to understand market dynamics, growth opportunities, and competitive landscapes. With a study period spanning 2019-2033, a base year of 2025, and a forecast period of 2025-2033, this report delivers a comprehensive overview of this rapidly evolving sector. The market size is estimated at xx Million in 2025 and is projected to reach xx Million by 2033.
Asia-Pacific Physical Security Market Composition & Trends
The Asia-Pacific physical security market is characterized by a moderately concentrated landscape, with key players like Bosch Security Systems GmbH, Dahua Technology Co Ltd, and Hikvision holding significant market share. However, the market is witnessing increased competition from smaller, specialized firms offering niche solutions. Innovation is a key driver, fueled by advancements in artificial intelligence (AI), Internet of Things (IoT), and cloud computing technologies. Stringent government regulations concerning data privacy and security are shaping market practices, while the increasing adoption of smart city initiatives is creating significant demand. Substitute products, such as advanced surveillance technologies, are impacting the market, though the core demand for robust physical security remains high. End-user profiles span various sectors, including government, commercial, and residential, each with unique needs. Furthermore, the market is witnessing a rise in mergers and acquisitions (M&A) activities, with deal values exceeding xx Million in recent years.
- Market Share Distribution: Top 3 players hold approximately xx% combined market share.
- M&A Activity: Significant M&A activity observed in the historical period (2019-2024), with a total deal value exceeding xx Million.
- Innovation Catalysts: AI-powered video analytics, cloud-based security solutions, and biometrics are driving innovation.
- Regulatory Landscape: Data privacy regulations and cybersecurity standards significantly impact market operations.
- End-User Profiles: Government, commercial (BFSI, retail, manufacturing), and residential sectors drive market demand.
Asia-Pacific Physical Security Market Industry Evolution
The Asia-Pacific physical security market exhibits robust growth, driven by escalating concerns about safety and security across various sectors. Technological advancements like AI-powered video analytics, biometric access control, and cloud-based security management systems are revolutionizing the sector. These innovations enhance efficiency, accuracy, and scalability of security solutions. Simultaneously, shifting consumer demands towards user-friendly, integrated, and cost-effective security systems are influencing market trends. The market witnessed a Compound Annual Growth Rate (CAGR) of xx% during the historical period (2019-2024) and is projected to grow at a CAGR of xx% during the forecast period (2025-2033). Adoption rates for advanced technologies like AI and cloud-based systems are increasing at a rate of xx% annually. The market growth is also influenced by government initiatives promoting smart cities and enhanced security infrastructure. Demand for integrated security solutions, combining access control, video surveillance, and intrusion detection, is rising rapidly.
Leading Regions, Countries, or Segments in Asia-Pacific Physical Security Market
- Dominant Region/Country: China and India are leading the market due to rapid urbanization, economic growth, and increasing security concerns.
Key Drivers for China and India's Dominance:
- Significant Investments: Massive investments in infrastructure development and smart city initiatives are boosting demand.
- Stringent Government Regulations: Government regulations mandating enhanced security measures in critical infrastructure fuel market growth.
- Growing Adoption of Advanced Technologies: Rapid adoption of AI, IoT, and cloud-based solutions is driving market expansion.
In-depth Analysis: China's robust manufacturing base supports the production of cost-effective physical security solutions, leading to high market penetration. India's expanding commercial and residential sectors are driving demand for security systems. However, other countries like Japan, South Korea, and Australia are also significant markets, with specific regional regulations and market preferences influencing growth trajectory.
Asia-Pacific Physical Security Market Product Innovations
Recent innovations focus on integrating AI and IoT technologies into existing systems, creating more intelligent and interconnected security solutions. AI-powered video analytics enhance threat detection and response, while IoT integration facilitates seamless data sharing and remote management. Biometric access control systems offer improved security and user convenience. These innovations boast enhanced accuracy, reduced false positives, and superior scalability compared to traditional security systems. Cloud-based solutions offer centralized management, remote monitoring, and improved scalability.
Propelling Factors for Asia-Pacific Physical Security Market Growth
Several factors are accelerating growth in the Asia-Pacific physical security market. The rise in cybercrime and terrorism is driving the demand for sophisticated security solutions. Government initiatives supporting smart city development are also fueling adoption. Technological advancements in AI, IoT, and cloud computing are enhancing the capabilities of physical security systems, making them more efficient and effective. Economic growth and increasing urbanization in the region are also contributing to the market expansion.
Obstacles in the Asia-Pacific Physical Security Market
Despite promising growth, challenges remain. High initial investment costs for advanced security systems can hinder adoption, particularly among smaller businesses. Supply chain disruptions can impact product availability and pricing. Furthermore, the complexity of integrating diverse security systems and managing large amounts of data can pose challenges. Regulatory inconsistencies across different countries in the region also create complexities for companies operating across multiple jurisdictions.
Future Opportunities in Asia-Pacific Physical Security Market
Future opportunities lie in the increasing adoption of AI and machine learning in security systems, fostering predictive capabilities. The expanding adoption of cloud-based security solutions offers scalability and cost-efficiency. The growing demand for integrated security solutions, combining various security technologies, presents a significant growth avenue. Finally, the expansion into new markets and emerging economies within the region presents significant untapped potential.
Major Players in the Asia-Pacific Physical Security Market Ecosystem
- Bosch Security Systems GmbH
- Dahua Technology Co Ltd
- Genetec Inc
- Honeywell International Inc
- Hangzhou Hikvision Digital Technology Co Ltd
- Johnson Controls
- HID Global Corporation
- Axis Communications AB
- NEC Corporation
- Schneider Electric
- Hanwha Group
Key Developments in Asia-Pacific Physical Security Market Industry
- August 2023: Verkada expands into South Korea, highlighting the growing demand for cloud-based solutions.
- April 2023: Dahua launches a touchless access control solution, emphasizing user convenience and security.
- March 2023: Genetec and Axis Communications partner to create a comprehensive access control solution, demonstrating collaborative innovation.
Strategic Asia-Pacific Physical Security Market Forecast
The Asia-Pacific physical security market is poised for sustained growth, driven by technological innovation, increasing security concerns, and supportive government policies. The market's future trajectory will be shaped by the continued integration of AI, IoT, and cloud technologies, leading to more intelligent and efficient security solutions. The expansion into new markets and the rising adoption of integrated security systems will further propel market expansion, creating significant opportunities for players in the sector.
Asia-Pacific Physical Security Market Segmentation
-
1. System Type
-
1.1. Video Surveillance System
- 1.1.1. IP Surveillance
- 1.1.2. Analog Surveillance
- 1.1.3. Hybrid Surveillance
- 1.2. Physical Access Control System (PACS)
- 1.3. Biometric System
- 1.4. Perimeter Security
- 1.5. Intrusion Detection
-
1.1. Video Surveillance System
-
2. Service Type
- 2.1. Access Control-as-a-Service (ACaaS)
- 2.2. Video Surveillance-as-a-Service (VSaaS)
-
3. Type of Deployment
- 3.1. On-premises
- 3.2. Cloud
-
4. Organization Size
- 4.1. SMEs
- 4.2. Large Enterprises
-
5. End-user Industry
- 5.1. Government Services
- 5.2. Banking and Financial Services
- 5.3. IT and Telecommunications
- 5.4. Transportation and Logistics
- 5.5. Retail
- 5.6. Healthcare
- 5.7. Residential
- 5.8. Other End-user Industries
Asia-Pacific Physical Security Market Segmentation By Geography
-
1. Asia Pacific
- 1.1. China
- 1.2. Japan
- 1.3. South Korea
- 1.4. India
- 1.5. Australia
- 1.6. New Zealand
- 1.7. Indonesia
- 1.8. Malaysia
- 1.9. Singapore
- 1.10. Thailand
- 1.11. Vietnam
- 1.12. Philippines
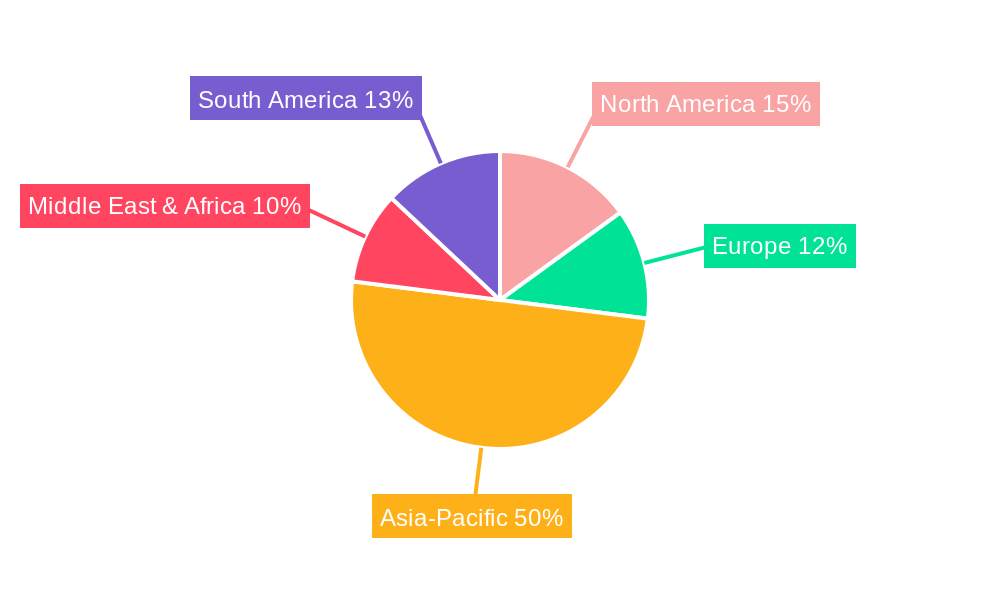
Asia-Pacific Physical Security Market Regional Market Share
Geographic Coverage of Asia-Pacific Physical Security Market
Asia-Pacific Physical Security Market REPORT HIGHLIGHTS
| Aspects | Details |
|---|---|
| Study Period | 2020-2034 |
| Base Year | 2025 |
| Estimated Year | 2026 |
| Forecast Period | 2026-2034 |
| Historical Period | 2020-2025 |
| Growth Rate | CAGR of 7.10% from 2020-2034 |
| Segmentation |
|
Table of Contents
- 1. Introduction
- 1.1. Research Scope
- 1.2. Market Segmentation
- 1.3. Research Methodology
- 1.4. Definitions and Assumptions
- 2. Executive Summary
- 2.1. Introduction
- 3. Market Dynamics
- 3.1. Introduction
- 3.2. Market Drivers
- 3.2.1. Increasing Recognition of Physical Security Systems; Rising Adoption of IP-Based Cameras for Video Monitoring; Integration of AI and Video Analytics into Physical Security Systems for Enhanced Effectiveness
- 3.3. Market Restrains
- 3.3.1. Increasing Recognition of Physical Security Systems; Rising Adoption of IP-Based Cameras for Video Monitoring; Integration of AI and Video Analytics into Physical Security Systems for Enhanced Effectiveness
- 3.4. Market Trends
- 3.4.1. Video Surveillance Systems Are Expected to Hold a Significant Market Share
- 4. Market Factor Analysis
- 4.1. Porters Five Forces
- 4.2. Supply/Value Chain
- 4.3. PESTEL analysis
- 4.4. Market Entropy
- 4.5. Patent/Trademark Analysis
- 5. Asia-Pacific Physical Security Market Analysis, Insights and Forecast, 2020-2032
- 5.1. Market Analysis, Insights and Forecast - by System Type
- 5.1.1. Video Surveillance System
- 5.1.1.1. IP Surveillance
- 5.1.1.2. Analog Surveillance
- 5.1.1.3. Hybrid Surveillance
- 5.1.2. Physical Access Control System (PACS)
- 5.1.3. Biometric System
- 5.1.4. Perimeter Security
- 5.1.5. Intrusion Detection
- 5.1.1. Video Surveillance System
- 5.2. Market Analysis, Insights and Forecast - by Service Type
- 5.2.1. Access Control-as-a-Service (ACaaS)
- 5.2.2. Video Surveillance-as-a-Service (VSaaS)
- 5.3. Market Analysis, Insights and Forecast - by Type of Deployment
- 5.3.1. On-premises
- 5.3.2. Cloud
- 5.4. Market Analysis, Insights and Forecast - by Organization Size
- 5.4.1. SMEs
- 5.4.2. Large Enterprises
- 5.5. Market Analysis, Insights and Forecast - by End-user Industry
- 5.5.1. Government Services
- 5.5.2. Banking and Financial Services
- 5.5.3. IT and Telecommunications
- 5.5.4. Transportation and Logistics
- 5.5.5. Retail
- 5.5.6. Healthcare
- 5.5.7. Residential
- 5.5.8. Other End-user Industries
- 5.6. Market Analysis, Insights and Forecast - by Region
- 5.6.1. Asia Pacific
- 5.1. Market Analysis, Insights and Forecast - by System Type
- 6. Competitive Analysis
- 6.1. Market Share Analysis 2025
- 6.2. Company Profiles
- 6.2.1 Bosch Security Systems GmbH
- 6.2.1.1. Overview
- 6.2.1.2. Products
- 6.2.1.3. SWOT Analysis
- 6.2.1.4. Recent Developments
- 6.2.1.5. Financials (Based on Availability)
- 6.2.2 Dahua Technology Co Ltd
- 6.2.2.1. Overview
- 6.2.2.2. Products
- 6.2.2.3. SWOT Analysis
- 6.2.2.4. Recent Developments
- 6.2.2.5. Financials (Based on Availability)
- 6.2.3 Genetec Inc
- 6.2.3.1. Overview
- 6.2.3.2. Products
- 6.2.3.3. SWOT Analysis
- 6.2.3.4. Recent Developments
- 6.2.3.5. Financials (Based on Availability)
- 6.2.4 Honeywell International Inc
- 6.2.4.1. Overview
- 6.2.4.2. Products
- 6.2.4.3. SWOT Analysis
- 6.2.4.4. Recent Developments
- 6.2.4.5. Financials (Based on Availability)
- 6.2.5 Hangzhou Hikvision Digital Technology Co Ltd
- 6.2.5.1. Overview
- 6.2.5.2. Products
- 6.2.5.3. SWOT Analysis
- 6.2.5.4. Recent Developments
- 6.2.5.5. Financials (Based on Availability)
- 6.2.6 Johnson Controls
- 6.2.6.1. Overview
- 6.2.6.2. Products
- 6.2.6.3. SWOT Analysis
- 6.2.6.4. Recent Developments
- 6.2.6.5. Financials (Based on Availability)
- 6.2.7 HID Global Corporation
- 6.2.7.1. Overview
- 6.2.7.2. Products
- 6.2.7.3. SWOT Analysis
- 6.2.7.4. Recent Developments
- 6.2.7.5. Financials (Based on Availability)
- 6.2.8 Axis Communications AB
- 6.2.8.1. Overview
- 6.2.8.2. Products
- 6.2.8.3. SWOT Analysis
- 6.2.8.4. Recent Developments
- 6.2.8.5. Financials (Based on Availability)
- 6.2.9 NEC Corporation
- 6.2.9.1. Overview
- 6.2.9.2. Products
- 6.2.9.3. SWOT Analysis
- 6.2.9.4. Recent Developments
- 6.2.9.5. Financials (Based on Availability)
- 6.2.10 Schneider Electric
- 6.2.10.1. Overview
- 6.2.10.2. Products
- 6.2.10.3. SWOT Analysis
- 6.2.10.4. Recent Developments
- 6.2.10.5. Financials (Based on Availability)
- 6.2.11 Hanwha Grou
- 6.2.11.1. Overview
- 6.2.11.2. Products
- 6.2.11.3. SWOT Analysis
- 6.2.11.4. Recent Developments
- 6.2.11.5. Financials (Based on Availability)
- 6.2.1 Bosch Security Systems GmbH
List of Figures
- Figure 1: Asia-Pacific Physical Security Market Revenue Breakdown (Million, %) by Product 2025 & 2033
- Figure 2: Asia-Pacific Physical Security Market Share (%) by Company 2025
List of Tables
- Table 1: Asia-Pacific Physical Security Market Revenue Million Forecast, by System Type 2020 & 2033
- Table 2: Asia-Pacific Physical Security Market Volume Billion Forecast, by System Type 2020 & 2033
- Table 3: Asia-Pacific Physical Security Market Revenue Million Forecast, by Service Type 2020 & 2033
- Table 4: Asia-Pacific Physical Security Market Volume Billion Forecast, by Service Type 2020 & 2033
- Table 5: Asia-Pacific Physical Security Market Revenue Million Forecast, by Type of Deployment 2020 & 2033
- Table 6: Asia-Pacific Physical Security Market Volume Billion Forecast, by Type of Deployment 2020 & 2033
- Table 7: Asia-Pacific Physical Security Market Revenue Million Forecast, by Organization Size 2020 & 2033
- Table 8: Asia-Pacific Physical Security Market Volume Billion Forecast, by Organization Size 2020 & 2033
- Table 9: Asia-Pacific Physical Security Market Revenue Million Forecast, by End-user Industry 2020 & 2033
- Table 10: Asia-Pacific Physical Security Market Volume Billion Forecast, by End-user Industry 2020 & 2033
- Table 11: Asia-Pacific Physical Security Market Revenue Million Forecast, by Region 2020 & 2033
- Table 12: Asia-Pacific Physical Security Market Volume Billion Forecast, by Region 2020 & 2033
- Table 13: Asia-Pacific Physical Security Market Revenue Million Forecast, by System Type 2020 & 2033
- Table 14: Asia-Pacific Physical Security Market Volume Billion Forecast, by System Type 2020 & 2033
- Table 15: Asia-Pacific Physical Security Market Revenue Million Forecast, by Service Type 2020 & 2033
- Table 16: Asia-Pacific Physical Security Market Volume Billion Forecast, by Service Type 2020 & 2033
- Table 17: Asia-Pacific Physical Security Market Revenue Million Forecast, by Type of Deployment 2020 & 2033
- Table 18: Asia-Pacific Physical Security Market Volume Billion Forecast, by Type of Deployment 2020 & 2033
- Table 19: Asia-Pacific Physical Security Market Revenue Million Forecast, by Organization Size 2020 & 2033
- Table 20: Asia-Pacific Physical Security Market Volume Billion Forecast, by Organization Size 2020 & 2033
- Table 21: Asia-Pacific Physical Security Market Revenue Million Forecast, by End-user Industry 2020 & 2033
- Table 22: Asia-Pacific Physical Security Market Volume Billion Forecast, by End-user Industry 2020 & 2033
- Table 23: Asia-Pacific Physical Security Market Revenue Million Forecast, by Country 2020 & 2033
- Table 24: Asia-Pacific Physical Security Market Volume Billion Forecast, by Country 2020 & 2033
- Table 25: China Asia-Pacific Physical Security Market Revenue (Million) Forecast, by Application 2020 & 2033
- Table 26: China Asia-Pacific Physical Security Market Volume (Billion) Forecast, by Application 2020 & 2033
- Table 27: Japan Asia-Pacific Physical Security Market Revenue (Million) Forecast, by Application 2020 & 2033
- Table 28: Japan Asia-Pacific Physical Security Market Volume (Billion) Forecast, by Application 2020 & 2033
- Table 29: South Korea Asia-Pacific Physical Security Market Revenue (Million) Forecast, by Application 2020 & 2033
- Table 30: South Korea Asia-Pacific Physical Security Market Volume (Billion) Forecast, by Application 2020 & 2033
- Table 31: India Asia-Pacific Physical Security Market Revenue (Million) Forecast, by Application 2020 & 2033
- Table 32: India Asia-Pacific Physical Security Market Volume (Billion) Forecast, by Application 2020 & 2033
- Table 33: Australia Asia-Pacific Physical Security Market Revenue (Million) Forecast, by Application 2020 & 2033
- Table 34: Australia Asia-Pacific Physical Security Market Volume (Billion) Forecast, by Application 2020 & 2033
- Table 35: New Zealand Asia-Pacific Physical Security Market Revenue (Million) Forecast, by Application 2020 & 2033
- Table 36: New Zealand Asia-Pacific Physical Security Market Volume (Billion) Forecast, by Application 2020 & 2033
- Table 37: Indonesia Asia-Pacific Physical Security Market Revenue (Million) Forecast, by Application 2020 & 2033
- Table 38: Indonesia Asia-Pacific Physical Security Market Volume (Billion) Forecast, by Application 2020 & 2033
- Table 39: Malaysia Asia-Pacific Physical Security Market Revenue (Million) Forecast, by Application 2020 & 2033
- Table 40: Malaysia Asia-Pacific Physical Security Market Volume (Billion) Forecast, by Application 2020 & 2033
- Table 41: Singapore Asia-Pacific Physical Security Market Revenue (Million) Forecast, by Application 2020 & 2033
- Table 42: Singapore Asia-Pacific Physical Security Market Volume (Billion) Forecast, by Application 2020 & 2033
- Table 43: Thailand Asia-Pacific Physical Security Market Revenue (Million) Forecast, by Application 2020 & 2033
- Table 44: Thailand Asia-Pacific Physical Security Market Volume (Billion) Forecast, by Application 2020 & 2033
- Table 45: Vietnam Asia-Pacific Physical Security Market Revenue (Million) Forecast, by Application 2020 & 2033
- Table 46: Vietnam Asia-Pacific Physical Security Market Volume (Billion) Forecast, by Application 2020 & 2033
- Table 47: Philippines Asia-Pacific Physical Security Market Revenue (Million) Forecast, by Application 2020 & 2033
- Table 48: Philippines Asia-Pacific Physical Security Market Volume (Billion) Forecast, by Application 2020 & 2033
Frequently Asked Questions
1. What is the projected Compound Annual Growth Rate (CAGR) of the Asia-Pacific Physical Security Market?
The projected CAGR is approximately 7.10%.
2. Which companies are prominent players in the Asia-Pacific Physical Security Market?
Key companies in the market include Bosch Security Systems GmbH, Dahua Technology Co Ltd, Genetec Inc, Honeywell International Inc, Hangzhou Hikvision Digital Technology Co Ltd, Johnson Controls, HID Global Corporation, Axis Communications AB, NEC Corporation, Schneider Electric, Hanwha Grou.
3. What are the main segments of the Asia-Pacific Physical Security Market?
The market segments include System Type, Service Type, Type of Deployment, Organization Size, End-user Industry.
4. Can you provide details about the market size?
The market size is estimated to be USD 39.45 Million as of 2022.
5. What are some drivers contributing to market growth?
Increasing Recognition of Physical Security Systems; Rising Adoption of IP-Based Cameras for Video Monitoring; Integration of AI and Video Analytics into Physical Security Systems for Enhanced Effectiveness.
6. What are the notable trends driving market growth?
Video Surveillance Systems Are Expected to Hold a Significant Market Share.
7. Are there any restraints impacting market growth?
Increasing Recognition of Physical Security Systems; Rising Adoption of IP-Based Cameras for Video Monitoring; Integration of AI and Video Analytics into Physical Security Systems for Enhanced Effectiveness.
8. Can you provide examples of recent developments in the market?
August 2023: Verkada, a prominent enterprise-building security and management solutions provider, announced its expansion into South Korea. To better serve the increasing demand for advanced cloud-based physical security solutions, the company announced the opening of a new office in Seoul. Its products include video security cameras, door-based access control, environmental sensors, alarms, intercom systems, and workplace management tools. These offerings work together seamlessly to deliver unmatched building security via a highly secure and integrated cloud-based software platform.
9. What pricing options are available for accessing the report?
Pricing options include single-user, multi-user, and enterprise licenses priced at USD 4750, USD 4950, and USD 6800 respectively.
10. Is the market size provided in terms of value or volume?
The market size is provided in terms of value, measured in Million and volume, measured in Billion.
11. Are there any specific market keywords associated with the report?
Yes, the market keyword associated with the report is "Asia-Pacific Physical Security Market," which aids in identifying and referencing the specific market segment covered.
12. How do I determine which pricing option suits my needs best?
The pricing options vary based on user requirements and access needs. Individual users may opt for single-user licenses, while businesses requiring broader access may choose multi-user or enterprise licenses for cost-effective access to the report.
13. Are there any additional resources or data provided in the Asia-Pacific Physical Security Market report?
While the report offers comprehensive insights, it's advisable to review the specific contents or supplementary materials provided to ascertain if additional resources or data are available.
14. How can I stay updated on further developments or reports in the Asia-Pacific Physical Security Market?
To stay informed about further developments, trends, and reports in the Asia-Pacific Physical Security Market, consider subscribing to industry newsletters, following relevant companies and organizations, or regularly checking reputable industry news sources and publications.
Methodology
Step 1 - Identification of Relevant Samples Size from Population Database


Step 2 - Approaches for Defining Global Market Size (Value, Volume* & Price*)

Note*: In applicable scenarios
Step 3 - Data Sources
Primary Research
- Web Analytics
- Survey Reports
- Research Institute
- Latest Research Reports
- Opinion Leaders
Secondary Research
- Annual Reports
- White Paper
- Latest Press Release
- Industry Association
- Paid Database
- Investor Presentations

Step 4 - Data Triangulation
Involves using different sources of information in order to increase the validity of a study
These sources are likely to be stakeholders in a program - participants, other researchers, program staff, other community members, and so on.
Then we put all data in single framework & apply various statistical tools to find out the dynamic on the market.
During the analysis stage, feedback from the stakeholder groups would be compared to determine areas of agreement as well as areas of divergence