

Key Insights
The Asia-Pacific (APAC) fruit and vegetable ingredients market is projected for significant expansion, driven by escalating consumer demand for healthier, natural food and beverage options. Key growth catalysts include the region's expanding population, increasing disposable incomes, and evolving dietary habits. The market is segmented by ingredient type (fruits, vegetables), product type (concentrates, pastes, purees, pieces, powders, NFC juices), and application (beverages, confectionery, bakery, soups, sauces, dairy, ready-to-eat products). Leading APAC economies such as China, India, and Japan are crucial market contributors, with growing demand for processed foods and functional beverages boosting ingredient consumption. The rise in convenient ready-to-eat (RTE) meals and health-conscious snacking further enhances market prospects. Despite challenges like raw material price volatility and stringent regulations, the market anticipates sustained growth. Innovations in product development, encompassing novel ingredient combinations and functional ingredients, will be pivotal. Additionally, a growing emphasis on sustainability and ethical sourcing practices will influence manufacturer and consumer choices.
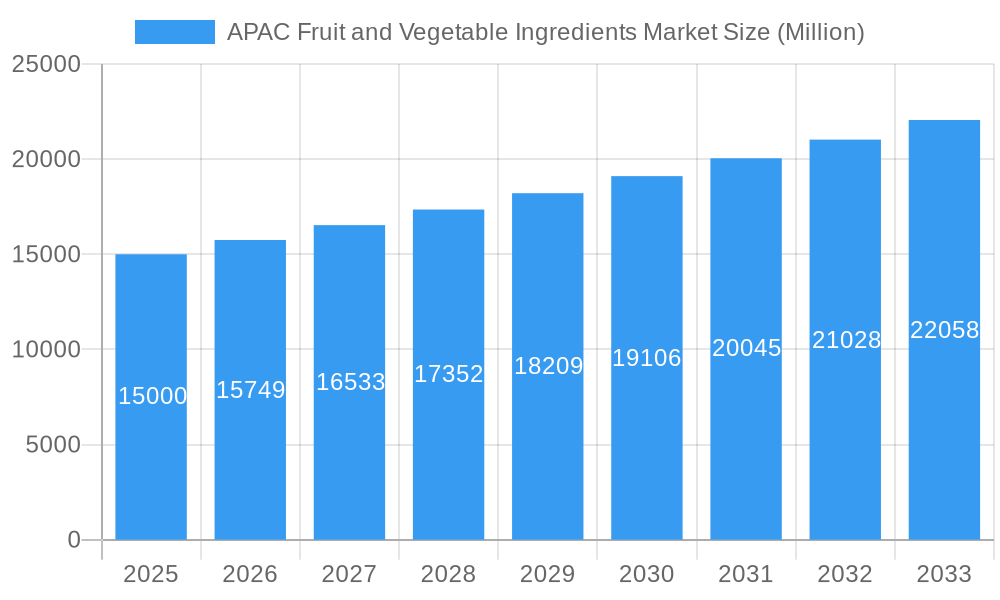
APAC Fruit and Vegetable Ingredients Market Market Size (In Billion)
The APAC fruit and vegetable ingredients market is forecast to grow at a Compound Annual Growth Rate (CAGR) of 3.8%, reaching a market size of 45646.26 million by the base year 2024. This expansion surpasses the global average CAGR. Primary drivers include the growing middle class in China and India, fueling higher spending on processed foods and beverages. Increased consumer awareness of the health benefits associated with fruit and vegetable consumption positively impacts market growth, particularly within functional beverages and health-focused food products. Technological advancements in processing and preservation are improving product quality and shelf life, further stimulating demand. While supply chain management and consistent quality across diverse sourcing regions present challenges, the substantial growth potential and expanding consumer base in APAC position this market for robust future performance.
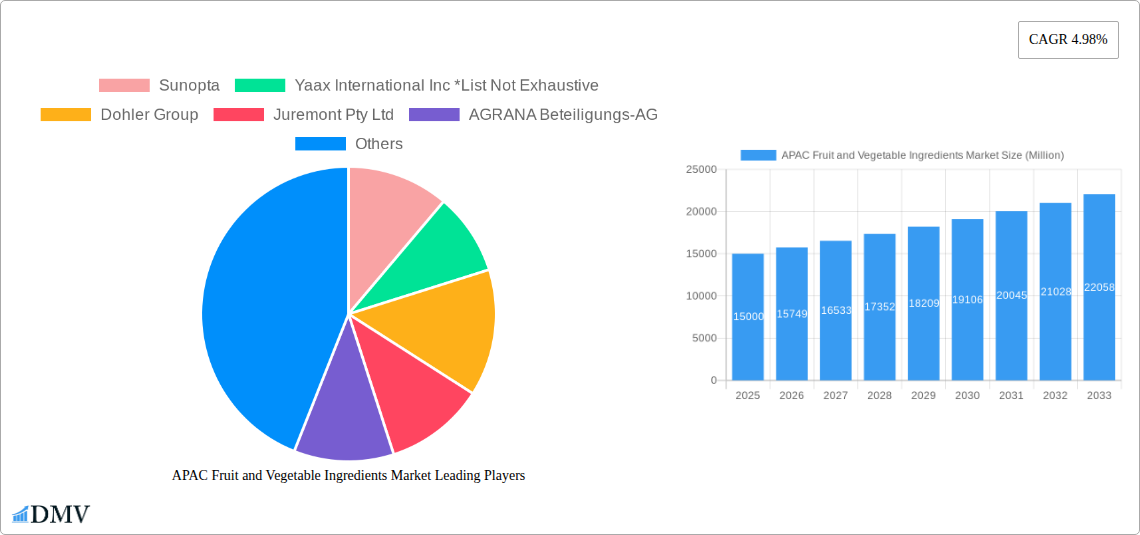
APAC Fruit and Vegetable Ingredients Market Company Market Share
APAC Fruit and Vegetable Ingredients Market: A Comprehensive Report (2019-2033)
This insightful report provides a detailed analysis of the Asia-Pacific fruit and vegetable ingredients market, offering a comprehensive overview of market dynamics, key players, and future growth prospects. The study period spans from 2019 to 2033, with 2025 serving as the base and estimated year. This report is invaluable for stakeholders seeking to understand the market's current state and navigate its future trajectory. The market is projected to reach xx Million by 2033.
APAC Fruit and Vegetable Ingredients Market Composition & Trends
This section delves into the competitive landscape of the APAC fruit and vegetable ingredients market, examining market concentration, innovation drivers, regulatory frameworks, substitute products, and end-user profiles. We analyze mergers and acquisitions (M&A) activities, providing insights into deal values and their impact on market share distribution. The market is characterized by a moderately fragmented structure, with a few large multinational players and numerous smaller regional players vying for market share.
- Market Concentration: The top five players hold an estimated xx% market share in 2025.
- Innovation Catalysts: Growing demand for clean-label products and functional ingredients is driving innovation in processing technologies and ingredient formulations.
- Regulatory Landscape: Stringent food safety regulations and labeling requirements across various APAC countries significantly influence market dynamics.
- Substitute Products: The availability of synthetic flavorings and colorings presents a competitive challenge to natural fruit and vegetable ingredients.
- End-User Profiles: The food and beverage industry remains the primary end-user, with significant demand from the beverage, confectionery, and bakery sectors.
- M&A Activities: Over the historical period (2019-2024), M&A activity in this sector totaled approximately xx Million, with deals predominantly focused on expanding product portfolios and geographical reach. Examples include [Specific Example of M&A, if available, otherwise omit].
APAC Fruit and Vegetable Ingredients Market Industry Evolution
This section analyzes the evolutionary trajectory of the APAC fruit and vegetable ingredients market, encompassing growth rates, technological advancements, and evolving consumer preferences. We provide a detailed analysis of historical (2019-2024) and forecast (2025-2033) market growth, highlighting key trends and drivers shaping the market’s future. The market has witnessed robust growth, fueled by factors such as rising disposable incomes, changing dietary habits, and the increasing popularity of convenience foods. Technological advancements, particularly in processing and preservation techniques, have significantly enhanced the quality and shelf life of fruit and vegetable ingredients. The shift towards healthier lifestyles and growing awareness of the health benefits associated with natural ingredients are also significantly impacting market growth. The market is estimated to grow at a CAGR of xx% during the forecast period (2025-2033). Specific adoption metrics like the increase in the use of [Specific technology like High-Pressure Processing (HPP)] will also be discussed.
Leading Regions, Countries, or Segments in APAC Fruit and Vegetable Ingredients Market
This section identifies the dominant regions, countries, and segments within the APAC fruit and vegetable ingredients market. We provide a comprehensive analysis of factors driving market dominance within each segment (By Ingredient Type, Product Type, and Application).
Key Drivers:
By Ingredient Type:
- Fruits: High demand for fruit-based ingredients, particularly in the beverage and confectionery sectors. [Specific example of a fruit type with high demand]
- Vegetables: Growing adoption of vegetable-based ingredients driven by health consciousness. [Specific example of a vegetable type with high demand]
By Product Type:
- Concentrates, Pastes, and Purees: Cost-effectiveness and ease of use drive strong demand across all applications.
- Pieces and Powders: Used extensively in various applications; convenience and versatility are key drivers.
- NFC Juices: Premium positioning and high demand for natural juice ingredients propel growth.
By Application:
- Beverages: The largest segment, fueled by rising demand for ready-to-drink beverages and functional drinks.
- Confectionery Products: Strong demand for natural colors and flavors in confectionery products.
- Other Applications: Bakery, soups and sauces, dairy, and RTE products show significant but comparatively smaller demand.
Dominance Factors: [Detailed paragraph explaining which region/country/segment is dominant and why; includes discussion of investment trends and regulatory support relevant to the dominant area.]
APAP Fruit and Vegetable Ingredients Market Product Innovations
Recent innovations focus on extending the shelf life of products through advanced preservation techniques like High-Pressure Processing (HPP) and improved extraction methods for enhanced flavor and nutrient retention. Clean-label initiatives have led to the development of natural colorants and flavorings extracted from fruits and vegetables. These innovations address consumer preferences for minimally processed, natural ingredients.
Propelling Factors for APAC Fruit and Vegetable Ingredients Market Growth
The APAC fruit and vegetable ingredients market is experiencing robust growth propelled by several factors: increasing health consciousness driving demand for natural food ingredients; rising disposable incomes in emerging economies boosting spending on processed foods; and technological advancements, especially in processing and preservation, leading to improved product quality and shelf life. Favorable government policies and incentives supporting the agro-processing sector also contribute significantly.
Obstacles in the APAC Fruit and Vegetable Ingredients Market
The market faces challenges including fluctuating raw material prices impacting profitability, stringent food safety regulations and labeling requirements increasing compliance costs; and intense competition from synthetic alternatives and foreign imports. Supply chain disruptions can also significantly impact market stability and availability.
Future Opportunities in APAC Fruit and Vegetable Ingredients Market
Emerging opportunities include the increasing demand for functional foods and beverages enriched with bioactive compounds from fruits and vegetables; the growing interest in plant-based ingredients among health-conscious consumers; and the potential for expansion into new markets with rising demand. Advancements in extraction and preservation technologies will further unlock opportunities for new product development.
Major Players in the APAC Fruit and Vegetable Ingredients Market Ecosystem
- Sunopta
- Yaax International Inc
- Dohler Group
- Juremont Pty Ltd
- AGRANA Beteiligungs-AG
- Archer Daniels Midland Company
- Sensient Technologies Corporation
- Frutarom (Taura Natural Ingredient)
Key Developments in APAC Fruit and Vegetable Ingredients Market Industry
- 2022-Q4: [Specific example of a key development, e.g., a new product launch by a major player.]
- 2023-Q1: [Specific example of a key development, e.g., a significant M&A event.]
- 2023-Q3: [Specific example of a key development, e.g., a regulatory change affecting the market.]
- [Add more bullet points as needed.]
Strategic APAC Fruit and Vegetable Ingredients Market Forecast
The APAC fruit and vegetable ingredients market is poised for significant growth, driven by sustained consumer demand for healthy and convenient food options. Continued innovation in product development and processing technologies, coupled with expanding market penetration in emerging economies, will propel market expansion. The focus on natural and clean-label ingredients, along with increasing adoption of sustainable sourcing practices, will further shape the market's future trajectory.
APAC Fruit and Vegetable Ingredients Market Segmentation
-
1. Ingredient Type
- 1.1. Fruits
- 1.2. Vegetables
-
2. Product Type
- 2.1. Concentrates
- 2.2. Pastes and Purees
- 2.3. Pieces and Powders
- 2.4. NFC Juices
-
3. Application
- 3.1. Beverages
- 3.2. Confectionery Products
- 3.3. Bakery Products
- 3.4. Soups and Sauces
- 3.5. Dairy Products
- 3.6. RTE Products
-
4. Geography
- 4.1. China
- 4.2. Japan
- 4.3. India
- 4.4. Australia
- 4.5. Rest of Asia-Pacific
APAC Fruit and Vegetable Ingredients Market Segmentation By Geography
- 1. China
- 2. Japan
- 3. India
- 4. Australia
- 5. Rest of Asia Pacific
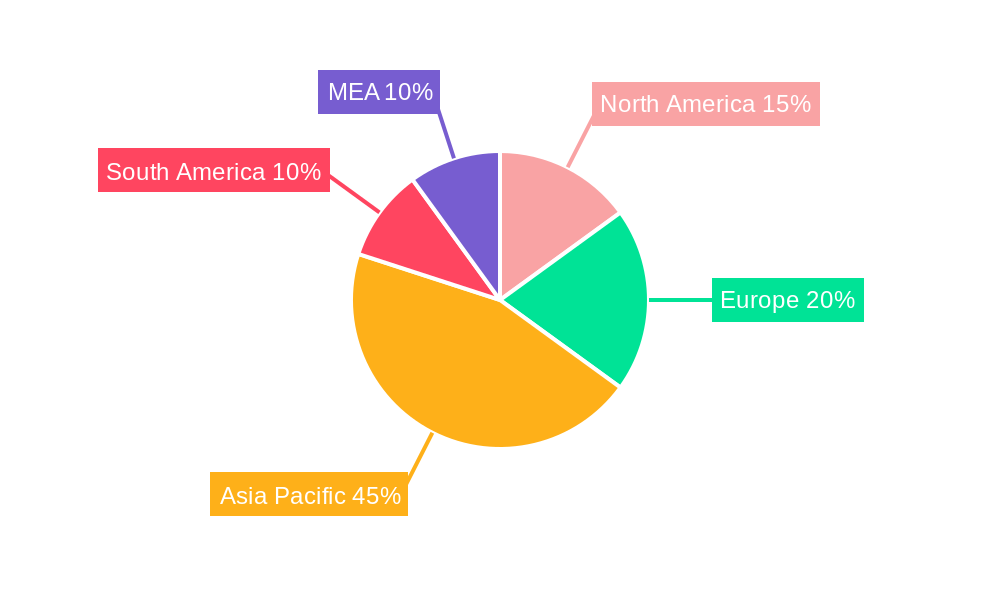
APAC Fruit and Vegetable Ingredients Market Regional Market Share
Geographic Coverage of APAC Fruit and Vegetable Ingredients Market
APAC Fruit and Vegetable Ingredients Market REPORT HIGHLIGHTS
| Aspects | Details |
|---|---|
| Study Period | 2020-2034 |
| Base Year | 2025 |
| Estimated Year | 2026 |
| Forecast Period | 2026-2034 |
| Historical Period | 2020-2025 |
| Growth Rate | CAGR of 3.8% from 2020-2034 |
| Segmentation |
|
Table of Contents
- 1. Introduction
- 1.1. Research Scope
- 1.2. Market Segmentation
- 1.3. Research Methodology
- 1.4. Definitions and Assumptions
- 2. Executive Summary
- 2.1. Introduction
- 3. Market Dynamics
- 3.1. Introduction
- 3.2. Market Drivers
- 3.2.1. Increasing Demand for Protein-Rich Food; Increasing Demand for Plant-Based and Organic Ingredients
- 3.3. Market Restrains
- 3.3.1. Presence of Alternative Proteins
- 3.4. Market Trends
- 3.4.1. Growing Application of Natural Ingredients
- 4. Market Factor Analysis
- 4.1. Porters Five Forces
- 4.2. Supply/Value Chain
- 4.3. PESTEL analysis
- 4.4. Market Entropy
- 4.5. Patent/Trademark Analysis
- 5. Global APAC Fruit and Vegetable Ingredients Market Analysis, Insights and Forecast, 2020-2032
- 5.1. Market Analysis, Insights and Forecast - by Ingredient Type
- 5.1.1. Fruits
- 5.1.2. Vegetables
- 5.2. Market Analysis, Insights and Forecast - by Product Type
- 5.2.1. Concentrates
- 5.2.2. Pastes and Purees
- 5.2.3. Pieces and Powders
- 5.2.4. NFC Juices
- 5.3. Market Analysis, Insights and Forecast - by Application
- 5.3.1. Beverages
- 5.3.2. Confectionery Products
- 5.3.3. Bakery Products
- 5.3.4. Soups and Sauces
- 5.3.5. Dairy Products
- 5.3.6. RTE Products
- 5.4. Market Analysis, Insights and Forecast - by Geography
- 5.4.1. China
- 5.4.2. Japan
- 5.4.3. India
- 5.4.4. Australia
- 5.4.5. Rest of Asia-Pacific
- 5.5. Market Analysis, Insights and Forecast - by Region
- 5.5.1. China
- 5.5.2. Japan
- 5.5.3. India
- 5.5.4. Australia
- 5.5.5. Rest of Asia Pacific
- 5.1. Market Analysis, Insights and Forecast - by Ingredient Type
- 6. China APAC Fruit and Vegetable Ingredients Market Analysis, Insights and Forecast, 2020-2032
- 6.1. Market Analysis, Insights and Forecast - by Ingredient Type
- 6.1.1. Fruits
- 6.1.2. Vegetables
- 6.2. Market Analysis, Insights and Forecast - by Product Type
- 6.2.1. Concentrates
- 6.2.2. Pastes and Purees
- 6.2.3. Pieces and Powders
- 6.2.4. NFC Juices
- 6.3. Market Analysis, Insights and Forecast - by Application
- 6.3.1. Beverages
- 6.3.2. Confectionery Products
- 6.3.3. Bakery Products
- 6.3.4. Soups and Sauces
- 6.3.5. Dairy Products
- 6.3.6. RTE Products
- 6.4. Market Analysis, Insights and Forecast - by Geography
- 6.4.1. China
- 6.4.2. Japan
- 6.4.3. India
- 6.4.4. Australia
- 6.4.5. Rest of Asia-Pacific
- 6.1. Market Analysis, Insights and Forecast - by Ingredient Type
- 7. Japan APAC Fruit and Vegetable Ingredients Market Analysis, Insights and Forecast, 2020-2032
- 7.1. Market Analysis, Insights and Forecast - by Ingredient Type
- 7.1.1. Fruits
- 7.1.2. Vegetables
- 7.2. Market Analysis, Insights and Forecast - by Product Type
- 7.2.1. Concentrates
- 7.2.2. Pastes and Purees
- 7.2.3. Pieces and Powders
- 7.2.4. NFC Juices
- 7.3. Market Analysis, Insights and Forecast - by Application
- 7.3.1. Beverages
- 7.3.2. Confectionery Products
- 7.3.3. Bakery Products
- 7.3.4. Soups and Sauces
- 7.3.5. Dairy Products
- 7.3.6. RTE Products
- 7.4. Market Analysis, Insights and Forecast - by Geography
- 7.4.1. China
- 7.4.2. Japan
- 7.4.3. India
- 7.4.4. Australia
- 7.4.5. Rest of Asia-Pacific
- 7.1. Market Analysis, Insights and Forecast - by Ingredient Type
- 8. India APAC Fruit and Vegetable Ingredients Market Analysis, Insights and Forecast, 2020-2032
- 8.1. Market Analysis, Insights and Forecast - by Ingredient Type
- 8.1.1. Fruits
- 8.1.2. Vegetables
- 8.2. Market Analysis, Insights and Forecast - by Product Type
- 8.2.1. Concentrates
- 8.2.2. Pastes and Purees
- 8.2.3. Pieces and Powders
- 8.2.4. NFC Juices
- 8.3. Market Analysis, Insights and Forecast - by Application
- 8.3.1. Beverages
- 8.3.2. Confectionery Products
- 8.3.3. Bakery Products
- 8.3.4. Soups and Sauces
- 8.3.5. Dairy Products
- 8.3.6. RTE Products
- 8.4. Market Analysis, Insights and Forecast - by Geography
- 8.4.1. China
- 8.4.2. Japan
- 8.4.3. India
- 8.4.4. Australia
- 8.4.5. Rest of Asia-Pacific
- 8.1. Market Analysis, Insights and Forecast - by Ingredient Type
- 9. Australia APAC Fruit and Vegetable Ingredients Market Analysis, Insights and Forecast, 2020-2032
- 9.1. Market Analysis, Insights and Forecast - by Ingredient Type
- 9.1.1. Fruits
- 9.1.2. Vegetables
- 9.2. Market Analysis, Insights and Forecast - by Product Type
- 9.2.1. Concentrates
- 9.2.2. Pastes and Purees
- 9.2.3. Pieces and Powders
- 9.2.4. NFC Juices
- 9.3. Market Analysis, Insights and Forecast - by Application
- 9.3.1. Beverages
- 9.3.2. Confectionery Products
- 9.3.3. Bakery Products
- 9.3.4. Soups and Sauces
- 9.3.5. Dairy Products
- 9.3.6. RTE Products
- 9.4. Market Analysis, Insights and Forecast - by Geography
- 9.4.1. China
- 9.4.2. Japan
- 9.4.3. India
- 9.4.4. Australia
- 9.4.5. Rest of Asia-Pacific
- 9.1. Market Analysis, Insights and Forecast - by Ingredient Type
- 10. Rest of Asia Pacific APAC Fruit and Vegetable Ingredients Market Analysis, Insights and Forecast, 2020-2032
- 10.1. Market Analysis, Insights and Forecast - by Ingredient Type
- 10.1.1. Fruits
- 10.1.2. Vegetables
- 10.2. Market Analysis, Insights and Forecast - by Product Type
- 10.2.1. Concentrates
- 10.2.2. Pastes and Purees
- 10.2.3. Pieces and Powders
- 10.2.4. NFC Juices
- 10.3. Market Analysis, Insights and Forecast - by Application
- 10.3.1. Beverages
- 10.3.2. Confectionery Products
- 10.3.3. Bakery Products
- 10.3.4. Soups and Sauces
- 10.3.5. Dairy Products
- 10.3.6. RTE Products
- 10.4. Market Analysis, Insights and Forecast - by Geography
- 10.4.1. China
- 10.4.2. Japan
- 10.4.3. India
- 10.4.4. Australia
- 10.4.5. Rest of Asia-Pacific
- 10.1. Market Analysis, Insights and Forecast - by Ingredient Type
- 11. Competitive Analysis
- 11.1. Global Market Share Analysis 2025
- 11.2. Company Profiles
- 11.2.1 Sunopta
- 11.2.1.1. Overview
- 11.2.1.2. Products
- 11.2.1.3. SWOT Analysis
- 11.2.1.4. Recent Developments
- 11.2.1.5. Financials (Based on Availability)
- 11.2.2 Yaax International Inc *List Not Exhaustive
- 11.2.2.1. Overview
- 11.2.2.2. Products
- 11.2.2.3. SWOT Analysis
- 11.2.2.4. Recent Developments
- 11.2.2.5. Financials (Based on Availability)
- 11.2.3 Dohler Group
- 11.2.3.1. Overview
- 11.2.3.2. Products
- 11.2.3.3. SWOT Analysis
- 11.2.3.4. Recent Developments
- 11.2.3.5. Financials (Based on Availability)
- 11.2.4 Juremont Pty Ltd
- 11.2.4.1. Overview
- 11.2.4.2. Products
- 11.2.4.3. SWOT Analysis
- 11.2.4.4. Recent Developments
- 11.2.4.5. Financials (Based on Availability)
- 11.2.5 AGRANA Beteiligungs-AG
- 11.2.5.1. Overview
- 11.2.5.2. Products
- 11.2.5.3. SWOT Analysis
- 11.2.5.4. Recent Developments
- 11.2.5.5. Financials (Based on Availability)
- 11.2.6 Archer Daniels Midland Company
- 11.2.6.1. Overview
- 11.2.6.2. Products
- 11.2.6.3. SWOT Analysis
- 11.2.6.4. Recent Developments
- 11.2.6.5. Financials (Based on Availability)
- 11.2.7 Sensient Technologies Corporation
- 11.2.7.1. Overview
- 11.2.7.2. Products
- 11.2.7.3. SWOT Analysis
- 11.2.7.4. Recent Developments
- 11.2.7.5. Financials (Based on Availability)
- 11.2.8 Frutarom (Taura Natural Ingredient)
- 11.2.8.1. Overview
- 11.2.8.2. Products
- 11.2.8.3. SWOT Analysis
- 11.2.8.4. Recent Developments
- 11.2.8.5. Financials (Based on Availability)
- 11.2.1 Sunopta
List of Figures
- Figure 1: Global APAC Fruit and Vegetable Ingredients Market Revenue Breakdown (million, %) by Region 2025 & 2033
- Figure 2: Global APAC Fruit and Vegetable Ingredients Market Volume Breakdown (K Tons, %) by Region 2025 & 2033
- Figure 3: China APAC Fruit and Vegetable Ingredients Market Revenue (million), by Ingredient Type 2025 & 2033
- Figure 4: China APAC Fruit and Vegetable Ingredients Market Volume (K Tons), by Ingredient Type 2025 & 2033
- Figure 5: China APAC Fruit and Vegetable Ingredients Market Revenue Share (%), by Ingredient Type 2025 & 2033
- Figure 6: China APAC Fruit and Vegetable Ingredients Market Volume Share (%), by Ingredient Type 2025 & 2033
- Figure 7: China APAC Fruit and Vegetable Ingredients Market Revenue (million), by Product Type 2025 & 2033
- Figure 8: China APAC Fruit and Vegetable Ingredients Market Volume (K Tons), by Product Type 2025 & 2033
- Figure 9: China APAC Fruit and Vegetable Ingredients Market Revenue Share (%), by Product Type 2025 & 2033
- Figure 10: China APAC Fruit and Vegetable Ingredients Market Volume Share (%), by Product Type 2025 & 2033
- Figure 11: China APAC Fruit and Vegetable Ingredients Market Revenue (million), by Application 2025 & 2033
- Figure 12: China APAC Fruit and Vegetable Ingredients Market Volume (K Tons), by Application 2025 & 2033
- Figure 13: China APAC Fruit and Vegetable Ingredients Market Revenue Share (%), by Application 2025 & 2033
- Figure 14: China APAC Fruit and Vegetable Ingredients Market Volume Share (%), by Application 2025 & 2033
- Figure 15: China APAC Fruit and Vegetable Ingredients Market Revenue (million), by Geography 2025 & 2033
- Figure 16: China APAC Fruit and Vegetable Ingredients Market Volume (K Tons), by Geography 2025 & 2033
- Figure 17: China APAC Fruit and Vegetable Ingredients Market Revenue Share (%), by Geography 2025 & 2033
- Figure 18: China APAC Fruit and Vegetable Ingredients Market Volume Share (%), by Geography 2025 & 2033
- Figure 19: China APAC Fruit and Vegetable Ingredients Market Revenue (million), by Country 2025 & 2033
- Figure 20: China APAC Fruit and Vegetable Ingredients Market Volume (K Tons), by Country 2025 & 2033
- Figure 21: China APAC Fruit and Vegetable Ingredients Market Revenue Share (%), by Country 2025 & 2033
- Figure 22: China APAC Fruit and Vegetable Ingredients Market Volume Share (%), by Country 2025 & 2033
- Figure 23: Japan APAC Fruit and Vegetable Ingredients Market Revenue (million), by Ingredient Type 2025 & 2033
- Figure 24: Japan APAC Fruit and Vegetable Ingredients Market Volume (K Tons), by Ingredient Type 2025 & 2033
- Figure 25: Japan APAC Fruit and Vegetable Ingredients Market Revenue Share (%), by Ingredient Type 2025 & 2033
- Figure 26: Japan APAC Fruit and Vegetable Ingredients Market Volume Share (%), by Ingredient Type 2025 & 2033
- Figure 27: Japan APAC Fruit and Vegetable Ingredients Market Revenue (million), by Product Type 2025 & 2033
- Figure 28: Japan APAC Fruit and Vegetable Ingredients Market Volume (K Tons), by Product Type 2025 & 2033
- Figure 29: Japan APAC Fruit and Vegetable Ingredients Market Revenue Share (%), by Product Type 2025 & 2033
- Figure 30: Japan APAC Fruit and Vegetable Ingredients Market Volume Share (%), by Product Type 2025 & 2033
- Figure 31: Japan APAC Fruit and Vegetable Ingredients Market Revenue (million), by Application 2025 & 2033
- Figure 32: Japan APAC Fruit and Vegetable Ingredients Market Volume (K Tons), by Application 2025 & 2033
- Figure 33: Japan APAC Fruit and Vegetable Ingredients Market Revenue Share (%), by Application 2025 & 2033
- Figure 34: Japan APAC Fruit and Vegetable Ingredients Market Volume Share (%), by Application 2025 & 2033
- Figure 35: Japan APAC Fruit and Vegetable Ingredients Market Revenue (million), by Geography 2025 & 2033
- Figure 36: Japan APAC Fruit and Vegetable Ingredients Market Volume (K Tons), by Geography 2025 & 2033
- Figure 37: Japan APAC Fruit and Vegetable Ingredients Market Revenue Share (%), by Geography 2025 & 2033
- Figure 38: Japan APAC Fruit and Vegetable Ingredients Market Volume Share (%), by Geography 2025 & 2033
- Figure 39: Japan APAC Fruit and Vegetable Ingredients Market Revenue (million), by Country 2025 & 2033
- Figure 40: Japan APAC Fruit and Vegetable Ingredients Market Volume (K Tons), by Country 2025 & 2033
- Figure 41: Japan APAC Fruit and Vegetable Ingredients Market Revenue Share (%), by Country 2025 & 2033
- Figure 42: Japan APAC Fruit and Vegetable Ingredients Market Volume Share (%), by Country 2025 & 2033
- Figure 43: India APAC Fruit and Vegetable Ingredients Market Revenue (million), by Ingredient Type 2025 & 2033
- Figure 44: India APAC Fruit and Vegetable Ingredients Market Volume (K Tons), by Ingredient Type 2025 & 2033
- Figure 45: India APAC Fruit and Vegetable Ingredients Market Revenue Share (%), by Ingredient Type 2025 & 2033
- Figure 46: India APAC Fruit and Vegetable Ingredients Market Volume Share (%), by Ingredient Type 2025 & 2033
- Figure 47: India APAC Fruit and Vegetable Ingredients Market Revenue (million), by Product Type 2025 & 2033
- Figure 48: India APAC Fruit and Vegetable Ingredients Market Volume (K Tons), by Product Type 2025 & 2033
- Figure 49: India APAC Fruit and Vegetable Ingredients Market Revenue Share (%), by Product Type 2025 & 2033
- Figure 50: India APAC Fruit and Vegetable Ingredients Market Volume Share (%), by Product Type 2025 & 2033
- Figure 51: India APAC Fruit and Vegetable Ingredients Market Revenue (million), by Application 2025 & 2033
- Figure 52: India APAC Fruit and Vegetable Ingredients Market Volume (K Tons), by Application 2025 & 2033
- Figure 53: India APAC Fruit and Vegetable Ingredients Market Revenue Share (%), by Application 2025 & 2033
- Figure 54: India APAC Fruit and Vegetable Ingredients Market Volume Share (%), by Application 2025 & 2033
- Figure 55: India APAC Fruit and Vegetable Ingredients Market Revenue (million), by Geography 2025 & 2033
- Figure 56: India APAC Fruit and Vegetable Ingredients Market Volume (K Tons), by Geography 2025 & 2033
- Figure 57: India APAC Fruit and Vegetable Ingredients Market Revenue Share (%), by Geography 2025 & 2033
- Figure 58: India APAC Fruit and Vegetable Ingredients Market Volume Share (%), by Geography 2025 & 2033
- Figure 59: India APAC Fruit and Vegetable Ingredients Market Revenue (million), by Country 2025 & 2033
- Figure 60: India APAC Fruit and Vegetable Ingredients Market Volume (K Tons), by Country 2025 & 2033
- Figure 61: India APAC Fruit and Vegetable Ingredients Market Revenue Share (%), by Country 2025 & 2033
- Figure 62: India APAC Fruit and Vegetable Ingredients Market Volume Share (%), by Country 2025 & 2033
- Figure 63: Australia APAC Fruit and Vegetable Ingredients Market Revenue (million), by Ingredient Type 2025 & 2033
- Figure 64: Australia APAC Fruit and Vegetable Ingredients Market Volume (K Tons), by Ingredient Type 2025 & 2033
- Figure 65: Australia APAC Fruit and Vegetable Ingredients Market Revenue Share (%), by Ingredient Type 2025 & 2033
- Figure 66: Australia APAC Fruit and Vegetable Ingredients Market Volume Share (%), by Ingredient Type 2025 & 2033
- Figure 67: Australia APAC Fruit and Vegetable Ingredients Market Revenue (million), by Product Type 2025 & 2033
- Figure 68: Australia APAC Fruit and Vegetable Ingredients Market Volume (K Tons), by Product Type 2025 & 2033
- Figure 69: Australia APAC Fruit and Vegetable Ingredients Market Revenue Share (%), by Product Type 2025 & 2033
- Figure 70: Australia APAC Fruit and Vegetable Ingredients Market Volume Share (%), by Product Type 2025 & 2033
- Figure 71: Australia APAC Fruit and Vegetable Ingredients Market Revenue (million), by Application 2025 & 2033
- Figure 72: Australia APAC Fruit and Vegetable Ingredients Market Volume (K Tons), by Application 2025 & 2033
- Figure 73: Australia APAC Fruit and Vegetable Ingredients Market Revenue Share (%), by Application 2025 & 2033
- Figure 74: Australia APAC Fruit and Vegetable Ingredients Market Volume Share (%), by Application 2025 & 2033
- Figure 75: Australia APAC Fruit and Vegetable Ingredients Market Revenue (million), by Geography 2025 & 2033
- Figure 76: Australia APAC Fruit and Vegetable Ingredients Market Volume (K Tons), by Geography 2025 & 2033
- Figure 77: Australia APAC Fruit and Vegetable Ingredients Market Revenue Share (%), by Geography 2025 & 2033
- Figure 78: Australia APAC Fruit and Vegetable Ingredients Market Volume Share (%), by Geography 2025 & 2033
- Figure 79: Australia APAC Fruit and Vegetable Ingredients Market Revenue (million), by Country 2025 & 2033
- Figure 80: Australia APAC Fruit and Vegetable Ingredients Market Volume (K Tons), by Country 2025 & 2033
- Figure 81: Australia APAC Fruit and Vegetable Ingredients Market Revenue Share (%), by Country 2025 & 2033
- Figure 82: Australia APAC Fruit and Vegetable Ingredients Market Volume Share (%), by Country 2025 & 2033
- Figure 83: Rest of Asia Pacific APAC Fruit and Vegetable Ingredients Market Revenue (million), by Ingredient Type 2025 & 2033
- Figure 84: Rest of Asia Pacific APAC Fruit and Vegetable Ingredients Market Volume (K Tons), by Ingredient Type 2025 & 2033
- Figure 85: Rest of Asia Pacific APAC Fruit and Vegetable Ingredients Market Revenue Share (%), by Ingredient Type 2025 & 2033
- Figure 86: Rest of Asia Pacific APAC Fruit and Vegetable Ingredients Market Volume Share (%), by Ingredient Type 2025 & 2033
- Figure 87: Rest of Asia Pacific APAC Fruit and Vegetable Ingredients Market Revenue (million), by Product Type 2025 & 2033
- Figure 88: Rest of Asia Pacific APAC Fruit and Vegetable Ingredients Market Volume (K Tons), by Product Type 2025 & 2033
- Figure 89: Rest of Asia Pacific APAC Fruit and Vegetable Ingredients Market Revenue Share (%), by Product Type 2025 & 2033
- Figure 90: Rest of Asia Pacific APAC Fruit and Vegetable Ingredients Market Volume Share (%), by Product Type 2025 & 2033
- Figure 91: Rest of Asia Pacific APAC Fruit and Vegetable Ingredients Market Revenue (million), by Application 2025 & 2033
- Figure 92: Rest of Asia Pacific APAC Fruit and Vegetable Ingredients Market Volume (K Tons), by Application 2025 & 2033
- Figure 93: Rest of Asia Pacific APAC Fruit and Vegetable Ingredients Market Revenue Share (%), by Application 2025 & 2033
- Figure 94: Rest of Asia Pacific APAC Fruit and Vegetable Ingredients Market Volume Share (%), by Application 2025 & 2033
- Figure 95: Rest of Asia Pacific APAC Fruit and Vegetable Ingredients Market Revenue (million), by Geography 2025 & 2033
- Figure 96: Rest of Asia Pacific APAC Fruit and Vegetable Ingredients Market Volume (K Tons), by Geography 2025 & 2033
- Figure 97: Rest of Asia Pacific APAC Fruit and Vegetable Ingredients Market Revenue Share (%), by Geography 2025 & 2033
- Figure 98: Rest of Asia Pacific APAC Fruit and Vegetable Ingredients Market Volume Share (%), by Geography 2025 & 2033
- Figure 99: Rest of Asia Pacific APAC Fruit and Vegetable Ingredients Market Revenue (million), by Country 2025 & 2033
- Figure 100: Rest of Asia Pacific APAC Fruit and Vegetable Ingredients Market Volume (K Tons), by Country 2025 & 2033
- Figure 101: Rest of Asia Pacific APAC Fruit and Vegetable Ingredients Market Revenue Share (%), by Country 2025 & 2033
- Figure 102: Rest of Asia Pacific APAC Fruit and Vegetable Ingredients Market Volume Share (%), by Country 2025 & 2033
List of Tables
- Table 1: Global APAC Fruit and Vegetable Ingredients Market Revenue million Forecast, by Ingredient Type 2020 & 2033
- Table 2: Global APAC Fruit and Vegetable Ingredients Market Volume K Tons Forecast, by Ingredient Type 2020 & 2033
- Table 3: Global APAC Fruit and Vegetable Ingredients Market Revenue million Forecast, by Product Type 2020 & 2033
- Table 4: Global APAC Fruit and Vegetable Ingredients Market Volume K Tons Forecast, by Product Type 2020 & 2033
- Table 5: Global APAC Fruit and Vegetable Ingredients Market Revenue million Forecast, by Application 2020 & 2033
- Table 6: Global APAC Fruit and Vegetable Ingredients Market Volume K Tons Forecast, by Application 2020 & 2033
- Table 7: Global APAC Fruit and Vegetable Ingredients Market Revenue million Forecast, by Geography 2020 & 2033
- Table 8: Global APAC Fruit and Vegetable Ingredients Market Volume K Tons Forecast, by Geography 2020 & 2033
- Table 9: Global APAC Fruit and Vegetable Ingredients Market Revenue million Forecast, by Region 2020 & 2033
- Table 10: Global APAC Fruit and Vegetable Ingredients Market Volume K Tons Forecast, by Region 2020 & 2033
- Table 11: Global APAC Fruit and Vegetable Ingredients Market Revenue million Forecast, by Ingredient Type 2020 & 2033
- Table 12: Global APAC Fruit and Vegetable Ingredients Market Volume K Tons Forecast, by Ingredient Type 2020 & 2033
- Table 13: Global APAC Fruit and Vegetable Ingredients Market Revenue million Forecast, by Product Type 2020 & 2033
- Table 14: Global APAC Fruit and Vegetable Ingredients Market Volume K Tons Forecast, by Product Type 2020 & 2033
- Table 15: Global APAC Fruit and Vegetable Ingredients Market Revenue million Forecast, by Application 2020 & 2033
- Table 16: Global APAC Fruit and Vegetable Ingredients Market Volume K Tons Forecast, by Application 2020 & 2033
- Table 17: Global APAC Fruit and Vegetable Ingredients Market Revenue million Forecast, by Geography 2020 & 2033
- Table 18: Global APAC Fruit and Vegetable Ingredients Market Volume K Tons Forecast, by Geography 2020 & 2033
- Table 19: Global APAC Fruit and Vegetable Ingredients Market Revenue million Forecast, by Country 2020 & 2033
- Table 20: Global APAC Fruit and Vegetable Ingredients Market Volume K Tons Forecast, by Country 2020 & 2033
- Table 21: Global APAC Fruit and Vegetable Ingredients Market Revenue million Forecast, by Ingredient Type 2020 & 2033
- Table 22: Global APAC Fruit and Vegetable Ingredients Market Volume K Tons Forecast, by Ingredient Type 2020 & 2033
- Table 23: Global APAC Fruit and Vegetable Ingredients Market Revenue million Forecast, by Product Type 2020 & 2033
- Table 24: Global APAC Fruit and Vegetable Ingredients Market Volume K Tons Forecast, by Product Type 2020 & 2033
- Table 25: Global APAC Fruit and Vegetable Ingredients Market Revenue million Forecast, by Application 2020 & 2033
- Table 26: Global APAC Fruit and Vegetable Ingredients Market Volume K Tons Forecast, by Application 2020 & 2033
- Table 27: Global APAC Fruit and Vegetable Ingredients Market Revenue million Forecast, by Geography 2020 & 2033
- Table 28: Global APAC Fruit and Vegetable Ingredients Market Volume K Tons Forecast, by Geography 2020 & 2033
- Table 29: Global APAC Fruit and Vegetable Ingredients Market Revenue million Forecast, by Country 2020 & 2033
- Table 30: Global APAC Fruit and Vegetable Ingredients Market Volume K Tons Forecast, by Country 2020 & 2033
- Table 31: Global APAC Fruit and Vegetable Ingredients Market Revenue million Forecast, by Ingredient Type 2020 & 2033
- Table 32: Global APAC Fruit and Vegetable Ingredients Market Volume K Tons Forecast, by Ingredient Type 2020 & 2033
- Table 33: Global APAC Fruit and Vegetable Ingredients Market Revenue million Forecast, by Product Type 2020 & 2033
- Table 34: Global APAC Fruit and Vegetable Ingredients Market Volume K Tons Forecast, by Product Type 2020 & 2033
- Table 35: Global APAC Fruit and Vegetable Ingredients Market Revenue million Forecast, by Application 2020 & 2033
- Table 36: Global APAC Fruit and Vegetable Ingredients Market Volume K Tons Forecast, by Application 2020 & 2033
- Table 37: Global APAC Fruit and Vegetable Ingredients Market Revenue million Forecast, by Geography 2020 & 2033
- Table 38: Global APAC Fruit and Vegetable Ingredients Market Volume K Tons Forecast, by Geography 2020 & 2033
- Table 39: Global APAC Fruit and Vegetable Ingredients Market Revenue million Forecast, by Country 2020 & 2033
- Table 40: Global APAC Fruit and Vegetable Ingredients Market Volume K Tons Forecast, by Country 2020 & 2033
- Table 41: Global APAC Fruit and Vegetable Ingredients Market Revenue million Forecast, by Ingredient Type 2020 & 2033
- Table 42: Global APAC Fruit and Vegetable Ingredients Market Volume K Tons Forecast, by Ingredient Type 2020 & 2033
- Table 43: Global APAC Fruit and Vegetable Ingredients Market Revenue million Forecast, by Product Type 2020 & 2033
- Table 44: Global APAC Fruit and Vegetable Ingredients Market Volume K Tons Forecast, by Product Type 2020 & 2033
- Table 45: Global APAC Fruit and Vegetable Ingredients Market Revenue million Forecast, by Application 2020 & 2033
- Table 46: Global APAC Fruit and Vegetable Ingredients Market Volume K Tons Forecast, by Application 2020 & 2033
- Table 47: Global APAC Fruit and Vegetable Ingredients Market Revenue million Forecast, by Geography 2020 & 2033
- Table 48: Global APAC Fruit and Vegetable Ingredients Market Volume K Tons Forecast, by Geography 2020 & 2033
- Table 49: Global APAC Fruit and Vegetable Ingredients Market Revenue million Forecast, by Country 2020 & 2033
- Table 50: Global APAC Fruit and Vegetable Ingredients Market Volume K Tons Forecast, by Country 2020 & 2033
- Table 51: Global APAC Fruit and Vegetable Ingredients Market Revenue million Forecast, by Ingredient Type 2020 & 2033
- Table 52: Global APAC Fruit and Vegetable Ingredients Market Volume K Tons Forecast, by Ingredient Type 2020 & 2033
- Table 53: Global APAC Fruit and Vegetable Ingredients Market Revenue million Forecast, by Product Type 2020 & 2033
- Table 54: Global APAC Fruit and Vegetable Ingredients Market Volume K Tons Forecast, by Product Type 2020 & 2033
- Table 55: Global APAC Fruit and Vegetable Ingredients Market Revenue million Forecast, by Application 2020 & 2033
- Table 56: Global APAC Fruit and Vegetable Ingredients Market Volume K Tons Forecast, by Application 2020 & 2033
- Table 57: Global APAC Fruit and Vegetable Ingredients Market Revenue million Forecast, by Geography 2020 & 2033
- Table 58: Global APAC Fruit and Vegetable Ingredients Market Volume K Tons Forecast, by Geography 2020 & 2033
- Table 59: Global APAC Fruit and Vegetable Ingredients Market Revenue million Forecast, by Country 2020 & 2033
- Table 60: Global APAC Fruit and Vegetable Ingredients Market Volume K Tons Forecast, by Country 2020 & 2033
Frequently Asked Questions
1. What is the projected Compound Annual Growth Rate (CAGR) of the APAC Fruit and Vegetable Ingredients Market?
The projected CAGR is approximately 3.8%.
2. Which companies are prominent players in the APAC Fruit and Vegetable Ingredients Market?
Key companies in the market include Sunopta, Yaax International Inc *List Not Exhaustive, Dohler Group, Juremont Pty Ltd, AGRANA Beteiligungs-AG, Archer Daniels Midland Company, Sensient Technologies Corporation, Frutarom (Taura Natural Ingredient).
3. What are the main segments of the APAC Fruit and Vegetable Ingredients Market?
The market segments include Ingredient Type, Product Type, Application, Geography.
4. Can you provide details about the market size?
The market size is estimated to be USD 45646.26 million as of 2022.
5. What are some drivers contributing to market growth?
Increasing Demand for Protein-Rich Food; Increasing Demand for Plant-Based and Organic Ingredients.
6. What are the notable trends driving market growth?
Growing Application of Natural Ingredients.
7. Are there any restraints impacting market growth?
Presence of Alternative Proteins.
8. Can you provide examples of recent developments in the market?
N/A
9. What pricing options are available for accessing the report?
Pricing options include single-user, multi-user, and enterprise licenses priced at USD 4750, USD 5250, and USD 8750 respectively.
10. Is the market size provided in terms of value or volume?
The market size is provided in terms of value, measured in million and volume, measured in K Tons.
11. Are there any specific market keywords associated with the report?
Yes, the market keyword associated with the report is "APAC Fruit and Vegetable Ingredients Market," which aids in identifying and referencing the specific market segment covered.
12. How do I determine which pricing option suits my needs best?
The pricing options vary based on user requirements and access needs. Individual users may opt for single-user licenses, while businesses requiring broader access may choose multi-user or enterprise licenses for cost-effective access to the report.
13. Are there any additional resources or data provided in the APAC Fruit and Vegetable Ingredients Market report?
While the report offers comprehensive insights, it's advisable to review the specific contents or supplementary materials provided to ascertain if additional resources or data are available.
14. How can I stay updated on further developments or reports in the APAC Fruit and Vegetable Ingredients Market?
To stay informed about further developments, trends, and reports in the APAC Fruit and Vegetable Ingredients Market, consider subscribing to industry newsletters, following relevant companies and organizations, or regularly checking reputable industry news sources and publications.
Methodology
Step 1 - Identification of Relevant Samples Size from Population Database


Step 2 - Approaches for Defining Global Market Size (Value, Volume* & Price*)

Note*: In applicable scenarios
Step 3 - Data Sources
Primary Research
- Web Analytics
- Survey Reports
- Research Institute
- Latest Research Reports
- Opinion Leaders
Secondary Research
- Annual Reports
- White Paper
- Latest Press Release
- Industry Association
- Paid Database
- Investor Presentations

Step 4 - Data Triangulation
Involves using different sources of information in order to increase the validity of a study
These sources are likely to be stakeholders in a program - participants, other researchers, program staff, other community members, and so on.
Then we put all data in single framework & apply various statistical tools to find out the dynamic on the market.
During the analysis stage, feedback from the stakeholder groups would be compared to determine areas of agreement as well as areas of divergence