

Key Insights
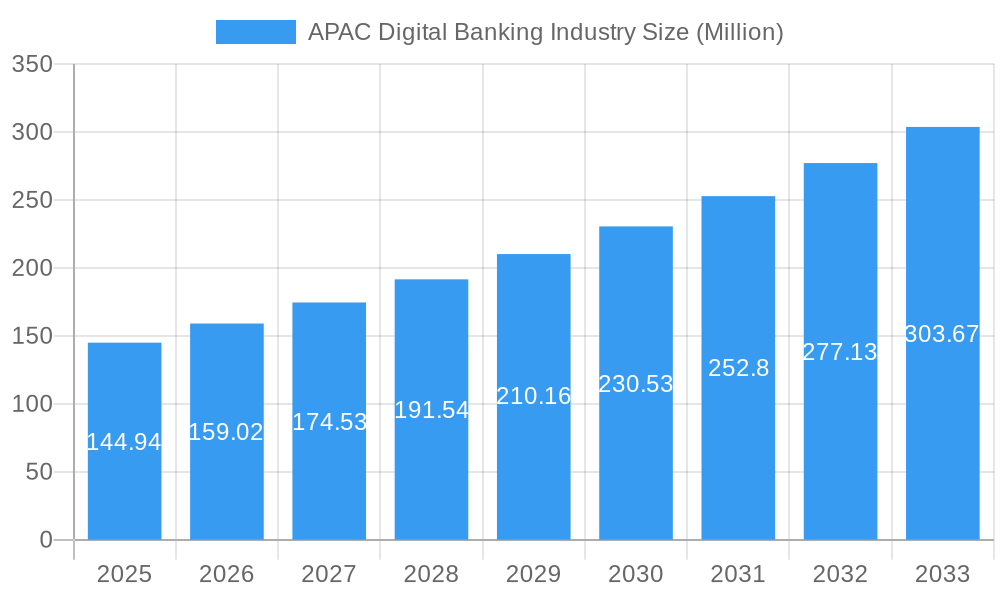
The APAC digital banking industry is experiencing robust growth, projected to reach a market size of $144.94 million in 2025 and maintain a Compound Annual Growth Rate (CAGR) of 9.80% from 2025 to 2033. This expansion is fueled by several key drivers. Increasing smartphone penetration and internet accessibility across the region are significantly broadening the user base for digital banking services. A burgeoning young population, comfortable with technology and demanding convenient financial solutions, is driving adoption. Furthermore, government initiatives promoting financial inclusion and digitalization are creating a favorable regulatory environment for growth. The rise of fintech companies offering innovative and competitive products and services, such as ZestMoney, MoneyTap, and Paytm, further accelerates market expansion. These companies leverage technology to provide seamless user experiences, personalized services, and competitive pricing, thus attracting a larger customer base. While challenges like cybersecurity threats and the need for robust digital infrastructure remain, the overall trajectory points towards continued strong growth in the coming years.
APAC Digital Banking Industry Market Size (In Million)
However, the market is not without its challenges. The digital divide, particularly in rural areas, continues to limit access to digital banking for some segments of the population. Concerns around data privacy and security are also impacting consumer trust and adoption. Competition among established banks and innovative fintech players is intense, requiring companies to continually innovate and enhance their offerings to maintain a competitive edge. The evolving regulatory landscape also necessitates continuous adaptation and compliance. Nevertheless, the overall market outlook remains positive, with sustained growth driven by technological advancements, increasing financial literacy, and ongoing government support. The strategic partnerships between traditional banks and fintech startups are likely to accelerate the pace of innovation and adoption within the region. This collaboration will foster the development of more sophisticated and inclusive digital banking solutions.
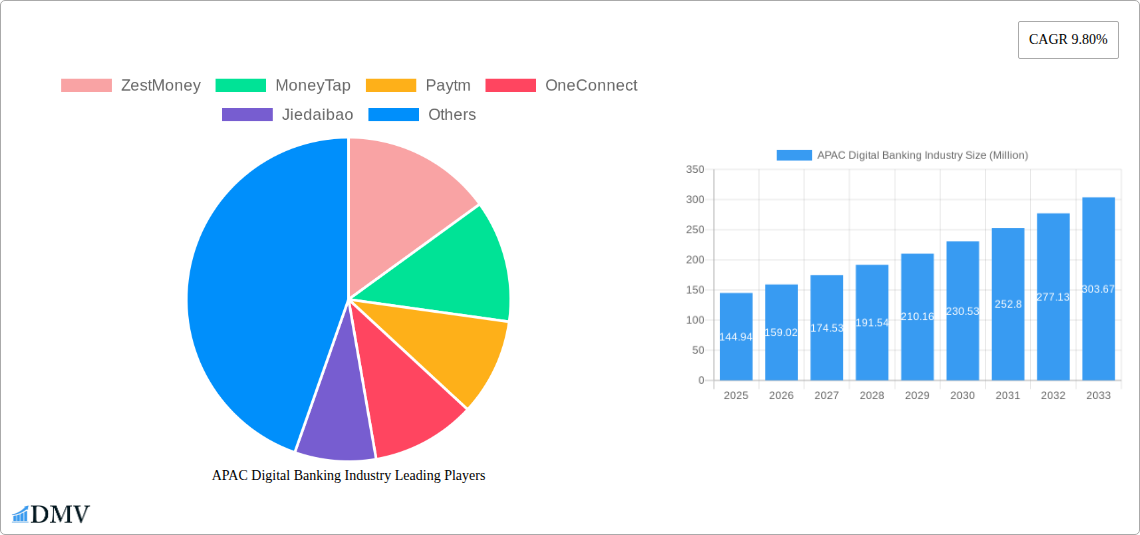
APAC Digital Banking Industry Company Market Share
APAC Digital Banking Industry: A Comprehensive Market Report (2019-2033)
This insightful report provides a deep dive into the dynamic APAC digital banking landscape, offering a comprehensive analysis of market trends, key players, and future growth projections. From market composition and technological advancements to regulatory shifts and emerging opportunities, this report equips stakeholders with the knowledge needed to navigate this rapidly evolving sector. The study period covers 2019-2033, with a base and estimated year of 2025 and a forecast period of 2025-2033. The historical period analyzed is 2019-2024.
APAC Digital Banking Industry Market Composition & Trends
This section provides a comprehensive analysis of the APAC digital banking market, delving into its competitive landscape, key innovation drivers, evolving regulatory environment, potential substitute products, distinct user profiles, and significant merger and acquisition (M&A) activities. The market size for APAC digital banking is projected to reach an estimated $XXX Million by 2025, indicating substantial growth.
- Market Concentration: The APAC digital banking market is characterized by a moderately concentrated structure, with a handful of prominent players commanding a significant portion of market share. The top 5 players are anticipated to collectively hold approximately xx% of the market by 2025.
- Innovation Catalysts: The market is experiencing rapid innovation fueled by advancements in key technologies such as Artificial Intelligence (AI), blockchain, and cloud computing. The growing adoption of open banking APIs is further fostering collaboration among financial institutions and driving the development of novel financial products and services.
- Regulatory Landscape: Diverse regulatory frameworks across the APAC region significantly influence market dynamics. A heightened emphasis on data privacy and cybersecurity is shaping industry practices and compliance requirements, pushing for more secure and user-centric digital banking solutions.
- Substitute Products: The competitive landscape includes disruptive fintech solutions, particularly mobile payment applications, which offer alternative ways for consumers to manage their finances and pose a competitive challenge to traditional digital banking services.
- End-User Profiles: The user base for digital banking is segmented across various demographics, income levels, and degrees of tech-savviness. There is a pronounced focus on engaging and catering to the rapidly growing millennial and Gen Z populations, who are digital natives and early adopters of new financial technologies.
- M&A Activities: The APAC digital banking sector has witnessed a surge in M&A activity over the past five years. Deal values are estimated to have exceeded $XX Million in 2024, driven by strategic objectives such as expanding market reach into new territories and acquiring cutting-edge technologies and innovative startups.
APAC Digital Banking Industry Industry Evolution
This section details the market's growth trajectory, technological advancements, and evolving consumer demands from 2019 to 2033. The market is projected to experience a Compound Annual Growth Rate (CAGR) of xx% during the forecast period (2025-2033), driven by factors like rising smartphone penetration, increasing internet access, and growing financial inclusion initiatives. The adoption rate of digital banking services is expected to reach xx% by 2033. Specific technological advancements, such as the integration of AI-powered chatbots and personalized financial advice tools, are significantly impacting user engagement and satisfaction. Shifting consumer demands toward seamless, personalized, and secure banking experiences are shaping product development and service delivery strategies.
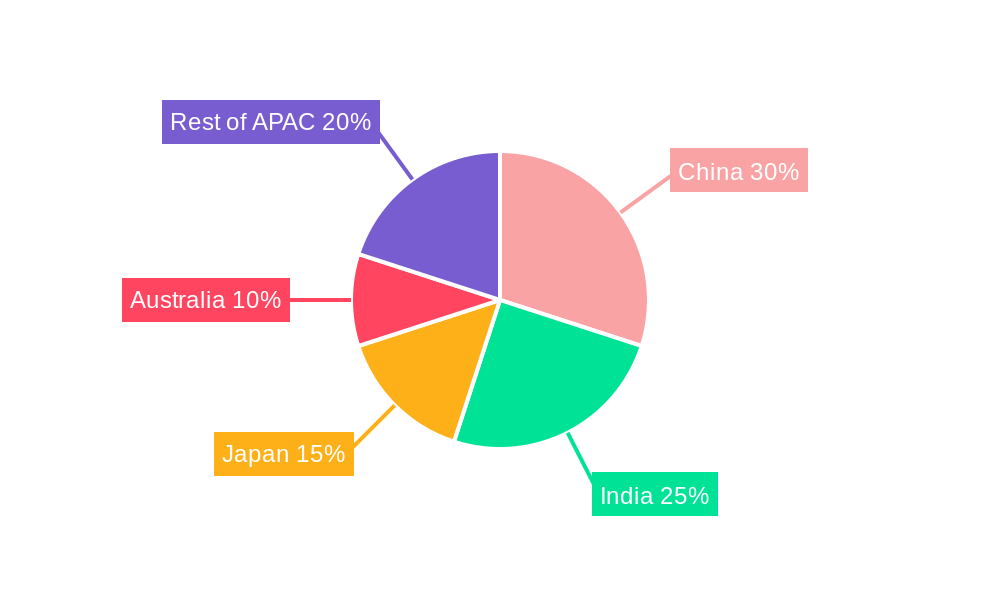
Leading Regions, Countries, or Segments in APAC Digital Banking Industry
This section highlights the dominant regions, countries, and segments that are shaping the APAC digital banking market. Currently, China and India are leading the market, exhibiting substantial growth and influencing regional trends, with a significant and accelerating growth potential observed in Southeast Asia.
-
Key Drivers for China's Dominance:
- A vast and rapidly expanding population with increasing digital literacy and a propensity for adopting digital solutions.
- Proactive and robust government support for fintech innovation and digital transformation initiatives, creating a conducive ecosystem for growth.
- Substantial venture capital investment flowing into the fintech sector, fueling research, development, and market expansion.
-
Key Drivers for India's Dominance:
- Impactful government initiatives focused on promoting financial inclusion, such as the widely successful Jan Dhan Yojana program, driving digital account opening and usage.
- The exponential growth in mobile phone and internet penetration across the country, providing a foundational infrastructure for digital financial services.
- A large and digitally-savvy young population that is readily embracing and demanding innovative digital financial services.
- Southeast Asia's Growth Potential: Emerging economies within Southeast Asia, including Singapore, Indonesia, and Vietnam, are demonstrating remarkable growth in digital banking adoption. This surge is attributed to a confluence of factors such as escalating smartphone penetration, the widespread adoption of mobile payment solutions, and the implementation of supportive government policies designed to foster digital financial inclusion and innovation.
APAP Digital Banking Industry Product Innovations
The APAC digital banking industry is witnessing a surge in innovative product offerings. These include personalized financial management tools, AI-powered fraud detection systems, and seamless cross-border payment solutions. Many banks are leveraging blockchain technology to enhance security and transparency, while others are integrating biometrics for enhanced authentication. These innovations are aimed at improving customer experience, boosting operational efficiency, and gaining a competitive edge.
Propelling Factors for APAC Digital Banking Industry Growth
Several factors fuel the growth of the APAC digital banking industry. Technological advancements, increasing smartphone penetration and internet accessibility, and government initiatives promoting financial inclusion play crucial roles. Moreover, favorable regulatory environments in certain countries and the rising demand for convenient, personalized financial services significantly contribute to the industry's expansion.
Obstacles in the APAC Digital Banking Industry Market
The APAC digital banking market faces challenges including stringent regulatory compliance requirements, cybersecurity threats, and the need for robust digital infrastructure. Competition from established financial institutions and the emergence of innovative fintech companies also pose significant hurdles. These factors could negatively impact market growth if not addressed effectively.
Future Opportunities in APAP Digital Banking Industry
Future opportunities lie in expanding into underserved markets, developing innovative financial products, and leveraging emerging technologies like AI and blockchain. The integration of open banking APIs offers immense potential for collaboration and the creation of new revenue streams. Focusing on personalized customer experiences and addressing cybersecurity concerns will be vital for success.
Major Players in the APAC Digital Banking Industry Ecosystem
- ZestMoney
- MoneyTap
- Paytm
- OneConnect
- Jiedaibao
- Money Forward
- Kyash
- Moneycatcha
- Policybazaar
- Razorpay
Key Developments in APAC Digital Banking Industry Industry
- January 2023: Yes Bank forged a strategic partnership with Falcon, a Banking-as-a-Service (BaaS) start-up, to significantly expand its reach into the burgeoning embedded finance sector, offering innovative financial solutions within non-financial platforms.
- September 2023: Standard Chartered launched Audax Financial Technology, a dedicated Banking-as-a-Service (BaaS) product suite. This initiative is designed to empower traditional banks and financial institutions by facilitating their digital transformation journeys and enabling them to offer enhanced digital banking capabilities.
Strategic APAC Digital Banking Industry Market Forecast
The APAC digital banking market is poised for significant growth, driven by technological advancements, increasing digital adoption, and supportive government policies. The expanding middle class and rising demand for convenient and personalized financial services present substantial opportunities for market players. Focusing on innovation, cybersecurity, and customer experience will be crucial for success in this dynamic market.
APAC Digital Banking Industry Segmentation
-
1. Type
- 1.1. API Based BaaS
- 1.2. Cloud Based BaaS
-
2. Service Type
- 2.1. Payment Process Services
- 2.2. Digital Banking Services
- 2.3. KYC Service
- 2.4. Customer Support Services
- 2.5. Others
-
3. Enterprise
- 3.1. Large Enterprise
- 3.2. Small & Medium Enterprise
APAC Digital Banking Industry Segmentation By Geography
-
1. North America
- 1.1. United States
- 1.2. Canada
- 1.3. Mexico
-
2. South America
- 2.1. Brazil
- 2.2. Argentina
- 2.3. Rest of South America
-
3. Europe
- 3.1. United Kingdom
- 3.2. Germany
- 3.3. France
- 3.4. Italy
- 3.5. Spain
- 3.6. Russia
- 3.7. Benelux
- 3.8. Nordics
- 3.9. Rest of Europe
-
4. Middle East & Africa
- 4.1. Turkey
- 4.2. Israel
- 4.3. GCC
- 4.4. North Africa
- 4.5. South Africa
- 4.6. Rest of Middle East & Africa
-
5. Asia Pacific
- 5.1. China
- 5.2. India
- 5.3. Japan
- 5.4. South Korea
- 5.5. ASEAN
- 5.6. Oceania
- 5.7. Rest of Asia Pacific
APAC Digital Banking Industry Regional Market Share
Geographic Coverage of APAC Digital Banking Industry
APAC Digital Banking Industry REPORT HIGHLIGHTS
| Aspects | Details |
|---|---|
| Study Period | 2020-2034 |
| Base Year | 2025 |
| Estimated Year | 2026 |
| Forecast Period | 2026-2034 |
| Historical Period | 2020-2025 |
| Growth Rate | CAGR of 9.80% from 2020-2034 |
| Segmentation |
|
Table of Contents
- 1. Introduction
- 1.1. Research Scope
- 1.2. Market Segmentation
- 1.3. Research Objective
- 1.4. Definitions and Assumptions
- 2. Executive Summary
- 2.1. Market Snapshot
- 3. Market Dynamics
- 3.1. Market Drivers
- 3.2. Market Restrains
- 3.3. Market Trends
- 3.4. Market Opportunities
- 4. Market Factor Analysis
- 4.1. Porters Five Forces
- 4.1.1. Bargaining Power of Suppliers
- 4.1.2. Bargaining Power of Buyers
- 4.1.3. Threat of New Entrants
- 4.1.4. Threat of Substitutes
- 4.1.5. Competitive Rivalry
- 4.2. PESTEL analysis
- 4.3. BCG Analysis
- 4.3.1. Stars (High Growth, High Market Share)
- 4.3.2. Cash Cows (Low Growth, High Market Share)
- 4.3.3. Question Mark (High Growth, Low Market Share)
- 4.3.4. Dogs (Low Growth, Low Market Share)
- 4.4. Ansoff Matrix Analysis
- 4.5. Supply Chain Analysis
- 4.6. Regulatory Landscape
- 4.7. Current Market Potential and Opportunity Assessment (TAM–SAM–SOM Framework)
- 4.8. DMV Analyst Note
- 4.1. Porters Five Forces
- 5. Market Analysis, Insights and Forecast 2021-2033
- 5.1. Market Analysis, Insights and Forecast - by Type
- 5.1.1. API Based BaaS
- 5.1.2. Cloud Based BaaS
- 5.2. Market Analysis, Insights and Forecast - by Service Type
- 5.2.1. Payment Process Services
- 5.2.2. Digital Banking Services
- 5.2.3. KYC Service
- 5.2.4. Customer Support Services
- 5.2.5. Others
- 5.3. Market Analysis, Insights and Forecast - by Enterprise
- 5.3.1. Large Enterprise
- 5.3.2. Small & Medium Enterprise
- 5.4. Market Analysis, Insights and Forecast - by Region
- 5.4.1. North America
- 5.4.2. South America
- 5.4.3. Europe
- 5.4.4. Middle East & Africa
- 5.4.5. Asia Pacific
- 5.1. Market Analysis, Insights and Forecast - by Type
- 6. Global APAC Digital Banking Industry Analysis, Insights and Forecast, 2021-2033
- 6.1. Market Analysis, Insights and Forecast - by Type
- 6.1.1. API Based BaaS
- 6.1.2. Cloud Based BaaS
- 6.2. Market Analysis, Insights and Forecast - by Service Type
- 6.2.1. Payment Process Services
- 6.2.2. Digital Banking Services
- 6.2.3. KYC Service
- 6.2.4. Customer Support Services
- 6.2.5. Others
- 6.3. Market Analysis, Insights and Forecast - by Enterprise
- 6.3.1. Large Enterprise
- 6.3.2. Small & Medium Enterprise
- 6.1. Market Analysis, Insights and Forecast - by Type
- 7. North America APAC Digital Banking Industry Analysis, Insights and Forecast, 2020-2032
- 7.1. Market Analysis, Insights and Forecast - by Type
- 7.1.1. API Based BaaS
- 7.1.2. Cloud Based BaaS
- 7.2. Market Analysis, Insights and Forecast - by Service Type
- 7.2.1. Payment Process Services
- 7.2.2. Digital Banking Services
- 7.2.3. KYC Service
- 7.2.4. Customer Support Services
- 7.2.5. Others
- 7.3. Market Analysis, Insights and Forecast - by Enterprise
- 7.3.1. Large Enterprise
- 7.3.2. Small & Medium Enterprise
- 7.1. Market Analysis, Insights and Forecast - by Type
- 8. South America APAC Digital Banking Industry Analysis, Insights and Forecast, 2020-2032
- 8.1. Market Analysis, Insights and Forecast - by Type
- 8.1.1. API Based BaaS
- 8.1.2. Cloud Based BaaS
- 8.2. Market Analysis, Insights and Forecast - by Service Type
- 8.2.1. Payment Process Services
- 8.2.2. Digital Banking Services
- 8.2.3. KYC Service
- 8.2.4. Customer Support Services
- 8.2.5. Others
- 8.3. Market Analysis, Insights and Forecast - by Enterprise
- 8.3.1. Large Enterprise
- 8.3.2. Small & Medium Enterprise
- 8.1. Market Analysis, Insights and Forecast - by Type
- 9. Europe APAC Digital Banking Industry Analysis, Insights and Forecast, 2020-2032
- 9.1. Market Analysis, Insights and Forecast - by Type
- 9.1.1. API Based BaaS
- 9.1.2. Cloud Based BaaS
- 9.2. Market Analysis, Insights and Forecast - by Service Type
- 9.2.1. Payment Process Services
- 9.2.2. Digital Banking Services
- 9.2.3. KYC Service
- 9.2.4. Customer Support Services
- 9.2.5. Others
- 9.3. Market Analysis, Insights and Forecast - by Enterprise
- 9.3.1. Large Enterprise
- 9.3.2. Small & Medium Enterprise
- 9.1. Market Analysis, Insights and Forecast - by Type
- 10. Middle East & Africa APAC Digital Banking Industry Analysis, Insights and Forecast, 2020-2032
- 10.1. Market Analysis, Insights and Forecast - by Type
- 10.1.1. API Based BaaS
- 10.1.2. Cloud Based BaaS
- 10.2. Market Analysis, Insights and Forecast - by Service Type
- 10.2.1. Payment Process Services
- 10.2.2. Digital Banking Services
- 10.2.3. KYC Service
- 10.2.4. Customer Support Services
- 10.2.5. Others
- 10.3. Market Analysis, Insights and Forecast - by Enterprise
- 10.3.1. Large Enterprise
- 10.3.2. Small & Medium Enterprise
- 10.1. Market Analysis, Insights and Forecast - by Type
- 11. Asia Pacific APAC Digital Banking Industry Analysis, Insights and Forecast, 2020-2032
- 11.1. Market Analysis, Insights and Forecast - by Type
- 11.1.1. API Based BaaS
- 11.1.2. Cloud Based BaaS
- 11.2. Market Analysis, Insights and Forecast - by Service Type
- 11.2.1. Payment Process Services
- 11.2.2. Digital Banking Services
- 11.2.3. KYC Service
- 11.2.4. Customer Support Services
- 11.2.5. Others
- 11.3. Market Analysis, Insights and Forecast - by Enterprise
- 11.3.1. Large Enterprise
- 11.3.2. Small & Medium Enterprise
- 11.1. Market Analysis, Insights and Forecast - by Type
- 12. Competitive Analysis
- 12.1. Company Profiles
- 12.1.1 ZestMoney
- 12.1.1.1. Company Overview
- 12.1.1.2. Products
- 12.1.1.3. Company Financials
- 12.1.1.4. SWOT Analysis
- 12.1.2 MoneyTap
- 12.1.2.1. Company Overview
- 12.1.2.2. Products
- 12.1.2.3. Company Financials
- 12.1.2.4. SWOT Analysis
- 12.1.3 Paytm
- 12.1.3.1. Company Overview
- 12.1.3.2. Products
- 12.1.3.3. Company Financials
- 12.1.3.4. SWOT Analysis
- 12.1.4 OneConnect
- 12.1.4.1. Company Overview
- 12.1.4.2. Products
- 12.1.4.3. Company Financials
- 12.1.4.4. SWOT Analysis
- 12.1.5 Jiedaibao
- 12.1.5.1. Company Overview
- 12.1.5.2. Products
- 12.1.5.3. Company Financials
- 12.1.5.4. SWOT Analysis
- 12.1.6 Money Forward
- 12.1.6.1. Company Overview
- 12.1.6.2. Products
- 12.1.6.3. Company Financials
- 12.1.6.4. SWOT Analysis
- 12.1.7 Kyash
- 12.1.7.1. Company Overview
- 12.1.7.2. Products
- 12.1.7.3. Company Financials
- 12.1.7.4. SWOT Analysis
- 12.1.8 Moneycatcha
- 12.1.8.1. Company Overview
- 12.1.8.2. Products
- 12.1.8.3. Company Financials
- 12.1.8.4. SWOT Analysis
- 12.1.9 Policybazaar
- 12.1.9.1. Company Overview
- 12.1.9.2. Products
- 12.1.9.3. Company Financials
- 12.1.9.4. SWOT Analysis
- 12.1.10 Razorpay**List Not Exhaustive
- 12.1.10.1. Company Overview
- 12.1.10.2. Products
- 12.1.10.3. Company Financials
- 12.1.10.4. SWOT Analysis
- 12.1.1 ZestMoney
- 12.2. Market Entropy
- 12.2.1 Company's Key Areas Served
- 12.2.2 Recent Developments
- 12.3. Company Market Share Analysis 2025
- 12.3.1 Top 5 Companies Market Share Analysis
- 12.3.2 Top 3 Companies Market Share Analysis
- 12.4. List of Potential Customers
- 13. Research Methodology
List of Figures
- Figure 1: Global APAC Digital Banking Industry Revenue Breakdown (Million, %) by Region 2025 & 2033
- Figure 2: Global APAC Digital Banking Industry Volume Breakdown (Billion, %) by Region 2025 & 2033
- Figure 3: North America APAC Digital Banking Industry Revenue (Million), by Type 2025 & 2033
- Figure 4: North America APAC Digital Banking Industry Volume (Billion), by Type 2025 & 2033
- Figure 5: North America APAC Digital Banking Industry Revenue Share (%), by Type 2025 & 2033
- Figure 6: North America APAC Digital Banking Industry Volume Share (%), by Type 2025 & 2033
- Figure 7: North America APAC Digital Banking Industry Revenue (Million), by Service Type 2025 & 2033
- Figure 8: North America APAC Digital Banking Industry Volume (Billion), by Service Type 2025 & 2033
- Figure 9: North America APAC Digital Banking Industry Revenue Share (%), by Service Type 2025 & 2033
- Figure 10: North America APAC Digital Banking Industry Volume Share (%), by Service Type 2025 & 2033
- Figure 11: North America APAC Digital Banking Industry Revenue (Million), by Enterprise 2025 & 2033
- Figure 12: North America APAC Digital Banking Industry Volume (Billion), by Enterprise 2025 & 2033
- Figure 13: North America APAC Digital Banking Industry Revenue Share (%), by Enterprise 2025 & 2033
- Figure 14: North America APAC Digital Banking Industry Volume Share (%), by Enterprise 2025 & 2033
- Figure 15: North America APAC Digital Banking Industry Revenue (Million), by Country 2025 & 2033
- Figure 16: North America APAC Digital Banking Industry Volume (Billion), by Country 2025 & 2033
- Figure 17: North America APAC Digital Banking Industry Revenue Share (%), by Country 2025 & 2033
- Figure 18: North America APAC Digital Banking Industry Volume Share (%), by Country 2025 & 2033
- Figure 19: South America APAC Digital Banking Industry Revenue (Million), by Type 2025 & 2033
- Figure 20: South America APAC Digital Banking Industry Volume (Billion), by Type 2025 & 2033
- Figure 21: South America APAC Digital Banking Industry Revenue Share (%), by Type 2025 & 2033
- Figure 22: South America APAC Digital Banking Industry Volume Share (%), by Type 2025 & 2033
- Figure 23: South America APAC Digital Banking Industry Revenue (Million), by Service Type 2025 & 2033
- Figure 24: South America APAC Digital Banking Industry Volume (Billion), by Service Type 2025 & 2033
- Figure 25: South America APAC Digital Banking Industry Revenue Share (%), by Service Type 2025 & 2033
- Figure 26: South America APAC Digital Banking Industry Volume Share (%), by Service Type 2025 & 2033
- Figure 27: South America APAC Digital Banking Industry Revenue (Million), by Enterprise 2025 & 2033
- Figure 28: South America APAC Digital Banking Industry Volume (Billion), by Enterprise 2025 & 2033
- Figure 29: South America APAC Digital Banking Industry Revenue Share (%), by Enterprise 2025 & 2033
- Figure 30: South America APAC Digital Banking Industry Volume Share (%), by Enterprise 2025 & 2033
- Figure 31: South America APAC Digital Banking Industry Revenue (Million), by Country 2025 & 2033
- Figure 32: South America APAC Digital Banking Industry Volume (Billion), by Country 2025 & 2033
- Figure 33: South America APAC Digital Banking Industry Revenue Share (%), by Country 2025 & 2033
- Figure 34: South America APAC Digital Banking Industry Volume Share (%), by Country 2025 & 2033
- Figure 35: Europe APAC Digital Banking Industry Revenue (Million), by Type 2025 & 2033
- Figure 36: Europe APAC Digital Banking Industry Volume (Billion), by Type 2025 & 2033
- Figure 37: Europe APAC Digital Banking Industry Revenue Share (%), by Type 2025 & 2033
- Figure 38: Europe APAC Digital Banking Industry Volume Share (%), by Type 2025 & 2033
- Figure 39: Europe APAC Digital Banking Industry Revenue (Million), by Service Type 2025 & 2033
- Figure 40: Europe APAC Digital Banking Industry Volume (Billion), by Service Type 2025 & 2033
- Figure 41: Europe APAC Digital Banking Industry Revenue Share (%), by Service Type 2025 & 2033
- Figure 42: Europe APAC Digital Banking Industry Volume Share (%), by Service Type 2025 & 2033
- Figure 43: Europe APAC Digital Banking Industry Revenue (Million), by Enterprise 2025 & 2033
- Figure 44: Europe APAC Digital Banking Industry Volume (Billion), by Enterprise 2025 & 2033
- Figure 45: Europe APAC Digital Banking Industry Revenue Share (%), by Enterprise 2025 & 2033
- Figure 46: Europe APAC Digital Banking Industry Volume Share (%), by Enterprise 2025 & 2033
- Figure 47: Europe APAC Digital Banking Industry Revenue (Million), by Country 2025 & 2033
- Figure 48: Europe APAC Digital Banking Industry Volume (Billion), by Country 2025 & 2033
- Figure 49: Europe APAC Digital Banking Industry Revenue Share (%), by Country 2025 & 2033
- Figure 50: Europe APAC Digital Banking Industry Volume Share (%), by Country 2025 & 2033
- Figure 51: Middle East & Africa APAC Digital Banking Industry Revenue (Million), by Type 2025 & 2033
- Figure 52: Middle East & Africa APAC Digital Banking Industry Volume (Billion), by Type 2025 & 2033
- Figure 53: Middle East & Africa APAC Digital Banking Industry Revenue Share (%), by Type 2025 & 2033
- Figure 54: Middle East & Africa APAC Digital Banking Industry Volume Share (%), by Type 2025 & 2033
- Figure 55: Middle East & Africa APAC Digital Banking Industry Revenue (Million), by Service Type 2025 & 2033
- Figure 56: Middle East & Africa APAC Digital Banking Industry Volume (Billion), by Service Type 2025 & 2033
- Figure 57: Middle East & Africa APAC Digital Banking Industry Revenue Share (%), by Service Type 2025 & 2033
- Figure 58: Middle East & Africa APAC Digital Banking Industry Volume Share (%), by Service Type 2025 & 2033
- Figure 59: Middle East & Africa APAC Digital Banking Industry Revenue (Million), by Enterprise 2025 & 2033
- Figure 60: Middle East & Africa APAC Digital Banking Industry Volume (Billion), by Enterprise 2025 & 2033
- Figure 61: Middle East & Africa APAC Digital Banking Industry Revenue Share (%), by Enterprise 2025 & 2033
- Figure 62: Middle East & Africa APAC Digital Banking Industry Volume Share (%), by Enterprise 2025 & 2033
- Figure 63: Middle East & Africa APAC Digital Banking Industry Revenue (Million), by Country 2025 & 2033
- Figure 64: Middle East & Africa APAC Digital Banking Industry Volume (Billion), by Country 2025 & 2033
- Figure 65: Middle East & Africa APAC Digital Banking Industry Revenue Share (%), by Country 2025 & 2033
- Figure 66: Middle East & Africa APAC Digital Banking Industry Volume Share (%), by Country 2025 & 2033
- Figure 67: Asia Pacific APAC Digital Banking Industry Revenue (Million), by Type 2025 & 2033
- Figure 68: Asia Pacific APAC Digital Banking Industry Volume (Billion), by Type 2025 & 2033
- Figure 69: Asia Pacific APAC Digital Banking Industry Revenue Share (%), by Type 2025 & 2033
- Figure 70: Asia Pacific APAC Digital Banking Industry Volume Share (%), by Type 2025 & 2033
- Figure 71: Asia Pacific APAC Digital Banking Industry Revenue (Million), by Service Type 2025 & 2033
- Figure 72: Asia Pacific APAC Digital Banking Industry Volume (Billion), by Service Type 2025 & 2033
- Figure 73: Asia Pacific APAC Digital Banking Industry Revenue Share (%), by Service Type 2025 & 2033
- Figure 74: Asia Pacific APAC Digital Banking Industry Volume Share (%), by Service Type 2025 & 2033
- Figure 75: Asia Pacific APAC Digital Banking Industry Revenue (Million), by Enterprise 2025 & 2033
- Figure 76: Asia Pacific APAC Digital Banking Industry Volume (Billion), by Enterprise 2025 & 2033
- Figure 77: Asia Pacific APAC Digital Banking Industry Revenue Share (%), by Enterprise 2025 & 2033
- Figure 78: Asia Pacific APAC Digital Banking Industry Volume Share (%), by Enterprise 2025 & 2033
- Figure 79: Asia Pacific APAC Digital Banking Industry Revenue (Million), by Country 2025 & 2033
- Figure 80: Asia Pacific APAC Digital Banking Industry Volume (Billion), by Country 2025 & 2033
- Figure 81: Asia Pacific APAC Digital Banking Industry Revenue Share (%), by Country 2025 & 2033
- Figure 82: Asia Pacific APAC Digital Banking Industry Volume Share (%), by Country 2025 & 2033
List of Tables
- Table 1: Global APAC Digital Banking Industry Revenue Million Forecast, by Type 2020 & 2033
- Table 2: Global APAC Digital Banking Industry Volume Billion Forecast, by Type 2020 & 2033
- Table 3: Global APAC Digital Banking Industry Revenue Million Forecast, by Service Type 2020 & 2033
- Table 4: Global APAC Digital Banking Industry Volume Billion Forecast, by Service Type 2020 & 2033
- Table 5: Global APAC Digital Banking Industry Revenue Million Forecast, by Enterprise 2020 & 2033
- Table 6: Global APAC Digital Banking Industry Volume Billion Forecast, by Enterprise 2020 & 2033
- Table 7: Global APAC Digital Banking Industry Revenue Million Forecast, by Region 2020 & 2033
- Table 8: Global APAC Digital Banking Industry Volume Billion Forecast, by Region 2020 & 2033
- Table 9: Global APAC Digital Banking Industry Revenue Million Forecast, by Type 2020 & 2033
- Table 10: Global APAC Digital Banking Industry Volume Billion Forecast, by Type 2020 & 2033
- Table 11: Global APAC Digital Banking Industry Revenue Million Forecast, by Service Type 2020 & 2033
- Table 12: Global APAC Digital Banking Industry Volume Billion Forecast, by Service Type 2020 & 2033
- Table 13: Global APAC Digital Banking Industry Revenue Million Forecast, by Enterprise 2020 & 2033
- Table 14: Global APAC Digital Banking Industry Volume Billion Forecast, by Enterprise 2020 & 2033
- Table 15: Global APAC Digital Banking Industry Revenue Million Forecast, by Country 2020 & 2033
- Table 16: Global APAC Digital Banking Industry Volume Billion Forecast, by Country 2020 & 2033
- Table 17: United States APAC Digital Banking Industry Revenue (Million) Forecast, by Application 2020 & 2033
- Table 18: United States APAC Digital Banking Industry Volume (Billion) Forecast, by Application 2020 & 2033
- Table 19: Canada APAC Digital Banking Industry Revenue (Million) Forecast, by Application 2020 & 2033
- Table 20: Canada APAC Digital Banking Industry Volume (Billion) Forecast, by Application 2020 & 2033
- Table 21: Mexico APAC Digital Banking Industry Revenue (Million) Forecast, by Application 2020 & 2033
- Table 22: Mexico APAC Digital Banking Industry Volume (Billion) Forecast, by Application 2020 & 2033
- Table 23: Global APAC Digital Banking Industry Revenue Million Forecast, by Type 2020 & 2033
- Table 24: Global APAC Digital Banking Industry Volume Billion Forecast, by Type 2020 & 2033
- Table 25: Global APAC Digital Banking Industry Revenue Million Forecast, by Service Type 2020 & 2033
- Table 26: Global APAC Digital Banking Industry Volume Billion Forecast, by Service Type 2020 & 2033
- Table 27: Global APAC Digital Banking Industry Revenue Million Forecast, by Enterprise 2020 & 2033
- Table 28: Global APAC Digital Banking Industry Volume Billion Forecast, by Enterprise 2020 & 2033
- Table 29: Global APAC Digital Banking Industry Revenue Million Forecast, by Country 2020 & 2033
- Table 30: Global APAC Digital Banking Industry Volume Billion Forecast, by Country 2020 & 2033
- Table 31: Brazil APAC Digital Banking Industry Revenue (Million) Forecast, by Application 2020 & 2033
- Table 32: Brazil APAC Digital Banking Industry Volume (Billion) Forecast, by Application 2020 & 2033
- Table 33: Argentina APAC Digital Banking Industry Revenue (Million) Forecast, by Application 2020 & 2033
- Table 34: Argentina APAC Digital Banking Industry Volume (Billion) Forecast, by Application 2020 & 2033
- Table 35: Rest of South America APAC Digital Banking Industry Revenue (Million) Forecast, by Application 2020 & 2033
- Table 36: Rest of South America APAC Digital Banking Industry Volume (Billion) Forecast, by Application 2020 & 2033
- Table 37: Global APAC Digital Banking Industry Revenue Million Forecast, by Type 2020 & 2033
- Table 38: Global APAC Digital Banking Industry Volume Billion Forecast, by Type 2020 & 2033
- Table 39: Global APAC Digital Banking Industry Revenue Million Forecast, by Service Type 2020 & 2033
- Table 40: Global APAC Digital Banking Industry Volume Billion Forecast, by Service Type 2020 & 2033
- Table 41: Global APAC Digital Banking Industry Revenue Million Forecast, by Enterprise 2020 & 2033
- Table 42: Global APAC Digital Banking Industry Volume Billion Forecast, by Enterprise 2020 & 2033
- Table 43: Global APAC Digital Banking Industry Revenue Million Forecast, by Country 2020 & 2033
- Table 44: Global APAC Digital Banking Industry Volume Billion Forecast, by Country 2020 & 2033
- Table 45: United Kingdom APAC Digital Banking Industry Revenue (Million) Forecast, by Application 2020 & 2033
- Table 46: United Kingdom APAC Digital Banking Industry Volume (Billion) Forecast, by Application 2020 & 2033
- Table 47: Germany APAC Digital Banking Industry Revenue (Million) Forecast, by Application 2020 & 2033
- Table 48: Germany APAC Digital Banking Industry Volume (Billion) Forecast, by Application 2020 & 2033
- Table 49: France APAC Digital Banking Industry Revenue (Million) Forecast, by Application 2020 & 2033
- Table 50: France APAC Digital Banking Industry Volume (Billion) Forecast, by Application 2020 & 2033
- Table 51: Italy APAC Digital Banking Industry Revenue (Million) Forecast, by Application 2020 & 2033
- Table 52: Italy APAC Digital Banking Industry Volume (Billion) Forecast, by Application 2020 & 2033
- Table 53: Spain APAC Digital Banking Industry Revenue (Million) Forecast, by Application 2020 & 2033
- Table 54: Spain APAC Digital Banking Industry Volume (Billion) Forecast, by Application 2020 & 2033
- Table 55: Russia APAC Digital Banking Industry Revenue (Million) Forecast, by Application 2020 & 2033
- Table 56: Russia APAC Digital Banking Industry Volume (Billion) Forecast, by Application 2020 & 2033
- Table 57: Benelux APAC Digital Banking Industry Revenue (Million) Forecast, by Application 2020 & 2033
- Table 58: Benelux APAC Digital Banking Industry Volume (Billion) Forecast, by Application 2020 & 2033
- Table 59: Nordics APAC Digital Banking Industry Revenue (Million) Forecast, by Application 2020 & 2033
- Table 60: Nordics APAC Digital Banking Industry Volume (Billion) Forecast, by Application 2020 & 2033
- Table 61: Rest of Europe APAC Digital Banking Industry Revenue (Million) Forecast, by Application 2020 & 2033
- Table 62: Rest of Europe APAC Digital Banking Industry Volume (Billion) Forecast, by Application 2020 & 2033
- Table 63: Global APAC Digital Banking Industry Revenue Million Forecast, by Type 2020 & 2033
- Table 64: Global APAC Digital Banking Industry Volume Billion Forecast, by Type 2020 & 2033
- Table 65: Global APAC Digital Banking Industry Revenue Million Forecast, by Service Type 2020 & 2033
- Table 66: Global APAC Digital Banking Industry Volume Billion Forecast, by Service Type 2020 & 2033
- Table 67: Global APAC Digital Banking Industry Revenue Million Forecast, by Enterprise 2020 & 2033
- Table 68: Global APAC Digital Banking Industry Volume Billion Forecast, by Enterprise 2020 & 2033
- Table 69: Global APAC Digital Banking Industry Revenue Million Forecast, by Country 2020 & 2033
- Table 70: Global APAC Digital Banking Industry Volume Billion Forecast, by Country 2020 & 2033
- Table 71: Turkey APAC Digital Banking Industry Revenue (Million) Forecast, by Application 2020 & 2033
- Table 72: Turkey APAC Digital Banking Industry Volume (Billion) Forecast, by Application 2020 & 2033
- Table 73: Israel APAC Digital Banking Industry Revenue (Million) Forecast, by Application 2020 & 2033
- Table 74: Israel APAC Digital Banking Industry Volume (Billion) Forecast, by Application 2020 & 2033
- Table 75: GCC APAC Digital Banking Industry Revenue (Million) Forecast, by Application 2020 & 2033
- Table 76: GCC APAC Digital Banking Industry Volume (Billion) Forecast, by Application 2020 & 2033
- Table 77: North Africa APAC Digital Banking Industry Revenue (Million) Forecast, by Application 2020 & 2033
- Table 78: North Africa APAC Digital Banking Industry Volume (Billion) Forecast, by Application 2020 & 2033
- Table 79: South Africa APAC Digital Banking Industry Revenue (Million) Forecast, by Application 2020 & 2033
- Table 80: South Africa APAC Digital Banking Industry Volume (Billion) Forecast, by Application 2020 & 2033
- Table 81: Rest of Middle East & Africa APAC Digital Banking Industry Revenue (Million) Forecast, by Application 2020 & 2033
- Table 82: Rest of Middle East & Africa APAC Digital Banking Industry Volume (Billion) Forecast, by Application 2020 & 2033
- Table 83: Global APAC Digital Banking Industry Revenue Million Forecast, by Type 2020 & 2033
- Table 84: Global APAC Digital Banking Industry Volume Billion Forecast, by Type 2020 & 2033
- Table 85: Global APAC Digital Banking Industry Revenue Million Forecast, by Service Type 2020 & 2033
- Table 86: Global APAC Digital Banking Industry Volume Billion Forecast, by Service Type 2020 & 2033
- Table 87: Global APAC Digital Banking Industry Revenue Million Forecast, by Enterprise 2020 & 2033
- Table 88: Global APAC Digital Banking Industry Volume Billion Forecast, by Enterprise 2020 & 2033
- Table 89: Global APAC Digital Banking Industry Revenue Million Forecast, by Country 2020 & 2033
- Table 90: Global APAC Digital Banking Industry Volume Billion Forecast, by Country 2020 & 2033
- Table 91: China APAC Digital Banking Industry Revenue (Million) Forecast, by Application 2020 & 2033
- Table 92: China APAC Digital Banking Industry Volume (Billion) Forecast, by Application 2020 & 2033
- Table 93: India APAC Digital Banking Industry Revenue (Million) Forecast, by Application 2020 & 2033
- Table 94: India APAC Digital Banking Industry Volume (Billion) Forecast, by Application 2020 & 2033
- Table 95: Japan APAC Digital Banking Industry Revenue (Million) Forecast, by Application 2020 & 2033
- Table 96: Japan APAC Digital Banking Industry Volume (Billion) Forecast, by Application 2020 & 2033
- Table 97: South Korea APAC Digital Banking Industry Revenue (Million) Forecast, by Application 2020 & 2033
- Table 98: South Korea APAC Digital Banking Industry Volume (Billion) Forecast, by Application 2020 & 2033
- Table 99: ASEAN APAC Digital Banking Industry Revenue (Million) Forecast, by Application 2020 & 2033
- Table 100: ASEAN APAC Digital Banking Industry Volume (Billion) Forecast, by Application 2020 & 2033
- Table 101: Oceania APAC Digital Banking Industry Revenue (Million) Forecast, by Application 2020 & 2033
- Table 102: Oceania APAC Digital Banking Industry Volume (Billion) Forecast, by Application 2020 & 2033
- Table 103: Rest of Asia Pacific APAC Digital Banking Industry Revenue (Million) Forecast, by Application 2020 & 2033
- Table 104: Rest of Asia Pacific APAC Digital Banking Industry Volume (Billion) Forecast, by Application 2020 & 2033
Frequently Asked Questions
1. What is the projected Compound Annual Growth Rate (CAGR) of the APAC Digital Banking Industry?
The projected CAGR is approximately 9.80%.
2. Which companies are prominent players in the APAC Digital Banking Industry?
Key companies in the market include ZestMoney, MoneyTap, Paytm, OneConnect, Jiedaibao, Money Forward, Kyash, Moneycatcha, Policybazaar, Razorpay**List Not Exhaustive.
3. What are the main segments of the APAC Digital Banking Industry?
The market segments include Type, Service Type, Enterprise.
4. Can you provide details about the market size?
The market size is estimated to be USD 144.94 Million as of 2022.
5. What are some drivers contributing to market growth?
Rise in Digital Banking in The Region; Rise in Volume of Financial Transaction.
6. What are the notable trends driving market growth?
Increase In Digital Banking.
7. Are there any restraints impacting market growth?
Rise in Digital Banking in The Region; Rise in Volume of Financial Transaction.
8. Can you provide examples of recent developments in the market?
In January 2023, Yes Banks partnered with Banking-as-a-service (BaaS) start-up, Falcon to expand its market in the rapidly growing embedded finance market. The inclusion of BaaS will help Yes Bank to rationalize technology costs and significantly reduce time-to-market empowering the bank to launch its competitive offerings more frequently.
9. What pricing options are available for accessing the report?
Pricing options include single-user, multi-user, and enterprise licenses priced at USD 4750, USD 4950, and USD 6800 respectively.
10. Is the market size provided in terms of value or volume?
The market size is provided in terms of value, measured in Million and volume, measured in Billion.
11. Are there any specific market keywords associated with the report?
Yes, the market keyword associated with the report is "APAC Digital Banking Industry," which aids in identifying and referencing the specific market segment covered.
12. How do I determine which pricing option suits my needs best?
The pricing options vary based on user requirements and access needs. Individual users may opt for single-user licenses, while businesses requiring broader access may choose multi-user or enterprise licenses for cost-effective access to the report.
13. Are there any additional resources or data provided in the APAC Digital Banking Industry report?
While the report offers comprehensive insights, it's advisable to review the specific contents or supplementary materials provided to ascertain if additional resources or data are available.
14. How can I stay updated on further developments or reports in the APAC Digital Banking Industry?
To stay informed about further developments, trends, and reports in the APAC Digital Banking Industry, consider subscribing to industry newsletters, following relevant companies and organizations, or regularly checking reputable industry news sources and publications.
Methodology
Step 1 - Identification of Relevant Samples Size from Population Database


Step 2 - Approaches for Defining Global Market Size (Value, Volume* & Price*)

Note*: In applicable scenarios
Step 3 - Data Sources
Primary Research
- Web Analytics
- Survey Reports
- Research Institute
- Latest Research Reports
- Opinion Leaders
Secondary Research
- Annual Reports
- White Paper
- Latest Press Release
- Industry Association
- Paid Database
- Investor Presentations

Step 4 - Data Triangulation
Involves using different sources of information in order to increase the validity of a study
These sources are likely to be stakeholders in a program - participants, other researchers, program staff, other community members, and so on.
Then we put all data in single framework & apply various statistical tools to find out the dynamic on the market.
During the analysis stage, feedback from the stakeholder groups would be compared to determine areas of agreement as well as areas of divergence