

Key Insights
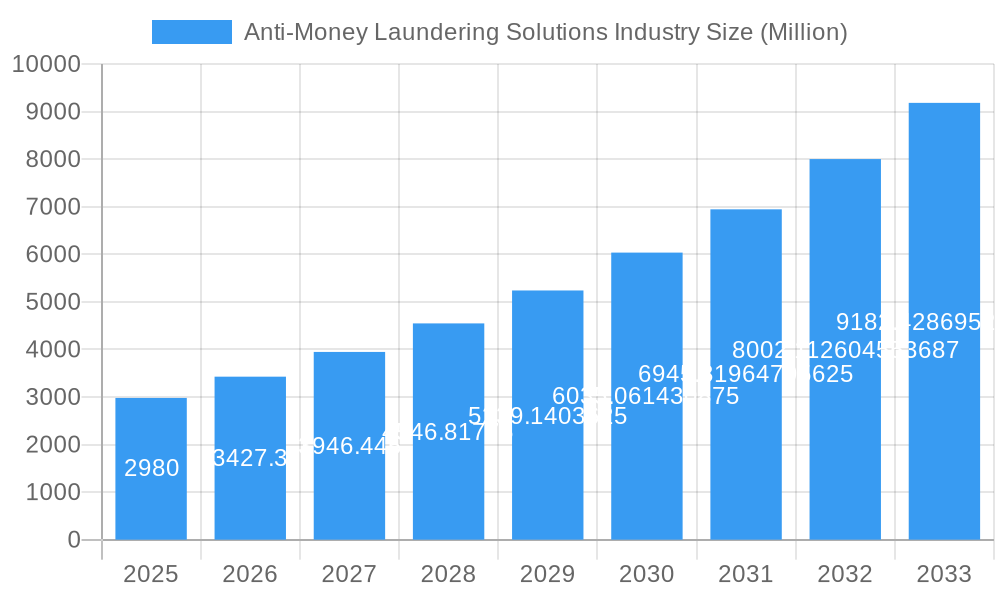
The Anti-Money Laundering (AML) Solutions market is experiencing robust growth, projected to reach $2.98 billion in 2025 and maintain a Compound Annual Growth Rate (CAGR) of 15.06% from 2025 to 2033. This expansion is fueled by several key drivers. Increasing regulatory scrutiny globally, particularly concerning financial crimes and terrorist financing, mandates robust AML compliance. The rise in digital transactions and cross-border payments creates new vulnerabilities, demanding sophisticated monitoring and detection systems. Furthermore, the evolution of financial crime tactics necessitates continuous innovation in AML solutions, pushing vendors to develop advanced technologies like artificial intelligence (AI) and machine learning (ML) for improved accuracy and efficiency. The market is segmented by solutions (KYC systems, compliance reporting, transaction monitoring, auditing & reporting, and other solutions), type (software and services), and deployment model (on-cloud and on-premise). The on-cloud segment is expected to witness faster growth due to its scalability, cost-effectiveness, and accessibility. Major players like NICE Actimize, SAS Institute, Fiserv, and others are driving innovation and competition, further fostering market growth.
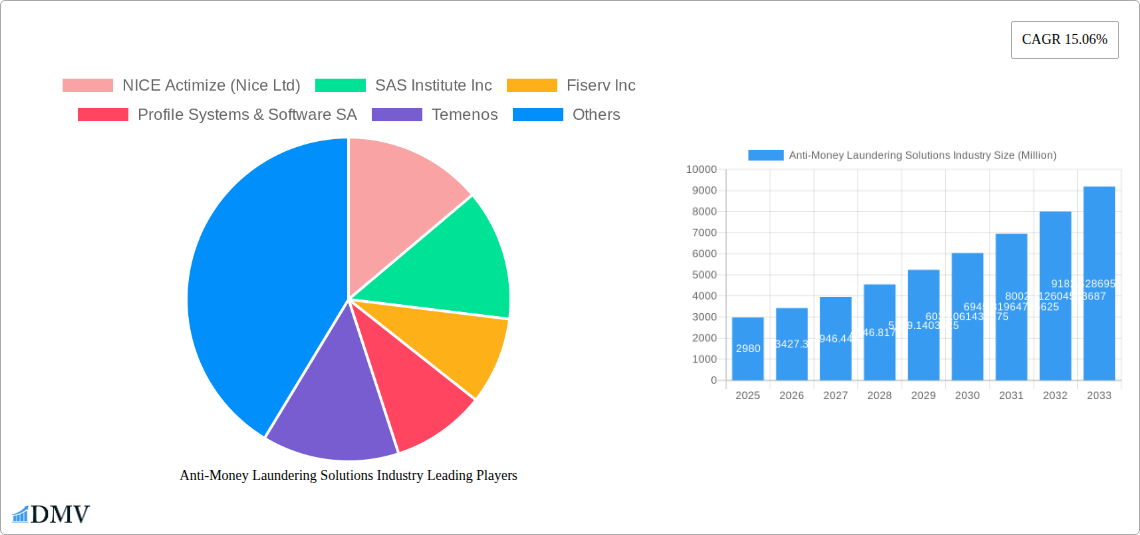
Anti-Money Laundering Solutions Industry Market Size (In Billion)
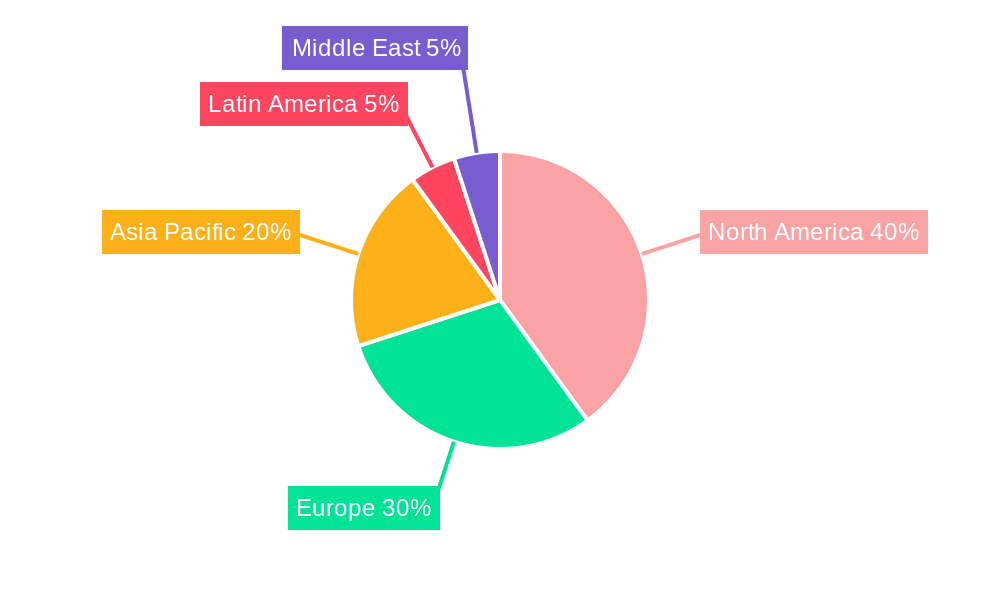
The competitive landscape is dynamic, with established players and emerging technology providers vying for market share. The North American region currently holds a significant market share, driven by stringent regulations and a mature financial sector. However, Asia-Pacific is projected to witness significant growth in the coming years, fueled by rapid economic expansion and increasing digitalization. Continued investment in research and development, coupled with strategic partnerships and acquisitions, will shape the future of the AML solutions market. The increasing adoption of AI and ML-powered solutions will be a significant trend, enabling more effective detection of suspicious activities and reducing false positives. Challenges include the high cost of implementation and maintenance of these sophisticated systems, as well as the ongoing need for skilled professionals to operate and interpret the data generated. Nonetheless, the imperative for robust AML compliance ensures the sustained growth of this critical market segment.
Anti-Money Laundering Solutions Industry Company Market Share
Anti-Money Laundering (AML) Solutions Market Report: 2019-2033
This comprehensive report provides an in-depth analysis of the global Anti-Money Laundering (AML) Solutions market, projecting a market value exceeding $XX Million by 2033. The report covers the period from 2019 to 2033, with 2025 serving as both the base and estimated year. It offers crucial insights for stakeholders, including investors, vendors, and regulatory bodies, seeking to navigate this rapidly evolving landscape. The study meticulously examines market trends, competitive dynamics, technological advancements, and regulatory shifts, offering a clear roadmap for future growth and strategic decision-making.
Anti-Money Laundering Solutions Industry Market Composition & Trends
The global AML Solutions market, valued at $XX Million in 2024, exhibits a moderately concentrated landscape, with key players like NICE Actimize (Nice Ltd), SAS Institute Inc, and Fiserv Inc holding significant market share. However, the market is witnessing increasing competition from emerging technology providers and specialized firms. Market share distribution varies across segments, with Transaction Monitoring currently dominating. Innovation is driven by advancements in Artificial Intelligence (AI), Machine Learning (ML), and big data analytics, enhancing the accuracy and efficiency of AML systems.
The regulatory landscape, characterized by stringent compliance requirements (e.g., KYC/AML regulations) globally, is a key driver, compelling financial institutions to adopt sophisticated AML solutions. Substitute products are limited, as the need for specialized AML solutions remains critical. End-users primarily comprise financial institutions (banks, insurance companies, investment firms), FinTech companies, and government agencies. The market has seen significant M&A activity in recent years, with deal values reaching $XX Million annually. Examples include the acquisition of Siron by IMTF in 2023.
- Market Concentration: Moderately concentrated, with top players holding approximately xx% market share.
- Innovation Catalysts: AI, ML, Big Data analytics.
- Regulatory Landscape: Stringent KYC/AML regulations globally.
- M&A Activity: Significant, with annual deal values exceeding $XX Million.
Anti-Money Laundering Solutions Industry Industry Evolution
The AML Solutions market has experienced consistent growth since 2019, driven by increasing regulatory scrutiny, rising cross-border financial transactions, and the evolving sophistication of financial crimes. The market is projected to grow at a Compound Annual Growth Rate (CAGR) of xx% from 2025 to 2033. This growth is fueled by technological advancements, including the integration of AI and ML for enhanced fraud detection and improved risk assessment.
Furthermore, shifting consumer demands for enhanced security and privacy are compelling institutions to adopt more robust and sophisticated AML systems. The adoption rate of cloud-based AML solutions is rapidly increasing, driven by scalability, cost-efficiency, and enhanced accessibility. The market witnessed a significant surge in demand post-2020 due to increased digitalization and the rise of online financial transactions. Specific data points on growth rates and adoption metrics are detailed in the full report.
Leading Regions, Countries, or Segments in Anti-Money Laundering Solutions Industry
- By Solutions: Transaction Monitoring holds the largest market share due to its critical role in detecting suspicious activities. KYC Systems are also growing significantly due to heightened regulatory focus on customer due diligence.
- By Type: Software solutions dominate due to their scalability and ease of integration. Services, particularly consulting and implementation services, represent a crucial segment, ensuring optimal solution deployment and maintenance.
- By Deployment Model: On-Cloud deployment is experiencing rapid growth due to its cost-effectiveness and scalability. On-Premise deployments remain relevant for institutions with stringent security requirements.
Key Drivers:
- North America: Stringent regulations, robust technological infrastructure, and a high concentration of financial institutions.
- Europe: Stringent regulatory frameworks (e.g., GDPR, AMLD), increasing cross-border transactions, and a growing awareness of financial crime.
- Asia-Pacific: Rapid economic growth, increasing digitalization, and rising adoption of financial technologies.
Anti-Money Laundering Solutions Industry Product Innovations
Recent innovations focus on enhancing the accuracy and efficiency of AML systems through AI-powered anomaly detection, advanced pattern recognition, and real-time transaction monitoring. These innovations deliver improved risk scoring, reduced false positives, and enhanced compliance with evolving regulatory requirements. Unique selling propositions include improved user interfaces, enhanced reporting capabilities, and seamless integration with existing financial systems. Technological advancements include the application of blockchain technology for enhanced transparency and traceability of transactions.
Propelling Factors for Anti-Money Laundering Solutions Growth
The growth of the AML Solutions market is propelled by several factors: the ever-increasing sophistication of financial crimes, demanding more advanced detection technologies; stricter global regulatory compliance requirements, forcing organizations to invest heavily in AML solutions; and the rising adoption of digital channels for financial transactions, which expand the attack surface and necessitate stronger security measures. Economic growth and the expansion of the global financial sector further contribute to this growth.
Obstacles in the Anti-Money Laundering Solutions Industry Market
The AML Solutions market faces challenges such as the high cost of implementation and maintenance of AML systems, the complexity of integrating these systems with existing infrastructure, and the constant evolution of money laundering techniques, demanding continuous system upgrades. Regulatory changes and updates can also create complexities and compliance challenges. Competitive pressures from numerous established and emerging players create a dynamic and demanding market landscape.
Future Opportunities in Anti-Money Laundering Solutions Industry
Future opportunities lie in the expansion into emerging markets, particularly in developing economies experiencing rapid financial growth. The integration of advanced technologies, such as AI and blockchain, into AML solutions will continue to shape market trends. Moreover, a growing focus on regulatory technology (RegTech) and specialized AML solutions for specific sectors (e.g., cryptocurrencies) presents significant growth opportunities.
Major Players in the Anti-Money Laundering Solutions Industry Ecosystem
- NICE Actimize (Nice Ltd)
- SAS Institute Inc
- Fiserv Inc
- Profile Systems & Software SA
- Temenos
- Refinitiv Ltd
- Experian Information Solutions Inc (Experian Ltd)
- Tata Consultancy Services Limited
- Fair Isaac Corporation (FICO)
- Intellect Design Arena
- Oracle Corporation
- Symphony Innovation LLC
- Fidelity National Information Services Inc (FIS)
- ACI Worldwide Inc
- Wolters Kluwer NV
- Ltimindtree Limited
Key Developments in Anti-Money Laundering Solutions Industry
- January 2023: IMTF acquires Siron AML solutions from FICO.
- February 2023: Profile Software implements RiskAvert solution at Cooperative Bank of Epirus.
Strategic Anti-Money Laundering Solutions Industry Market Forecast
The AML Solutions market is poised for continued growth, driven by technological advancements and increasing regulatory pressures. The market's future potential is substantial, with opportunities in emerging markets and new technologies promising significant expansion in the coming years. The integration of AI, ML, and blockchain technologies will redefine AML capabilities, driving efficiency and accuracy. This creates considerable potential for both established and emerging players in the market.
Anti-Money Laundering Solutions Industry Segmentation
-
1. Solutions
- 1.1. Know Your Customer (KYC) Systems
- 1.2. Compliance Reporting
- 1.3. Transaction Monitoring
- 1.4. Auditing and Reporting
- 1.5. Other Solutions
-
2. Type
- 2.1. Software
- 2.2. Services
-
3. Deployment Model
- 3.1. On-cloud
- 3.2. On-premise
Anti-Money Laundering Solutions Industry Segmentation By Geography
-
1. North America
- 1.1. United States
- 1.2. Canada
-
2. Europe
- 2.1. United Kingdom
- 2.2. Germany
- 2.3. France
- 2.4. Spain
- 2.5. Rest of Europe
-
3. Asia Pacific
- 3.1. China
- 3.2. Japan
- 3.3. India
- 3.4. Southeast Asia
- 3.5. Rest of Asia Pacific
- 4. Latin America
- 5. Middle East and Africa
Anti-Money Laundering Solutions Industry Regional Market Share
Geographic Coverage of Anti-Money Laundering Solutions Industry
Anti-Money Laundering Solutions Industry REPORT HIGHLIGHTS
| Aspects | Details |
|---|---|
| Study Period | 2020-2034 |
| Base Year | 2025 |
| Estimated Year | 2026 |
| Forecast Period | 2026-2034 |
| Historical Period | 2020-2025 |
| Growth Rate | CAGR of 15.06% from 2020-2034 |
| Segmentation |
|
Table of Contents
- 1. Introduction
- 1.1. Research Scope
- 1.2. Market Segmentation
- 1.3. Research Objective
- 1.4. Definitions and Assumptions
- 2. Executive Summary
- 2.1. Market Snapshot
- 3. Market Dynamics
- 3.1. Market Drivers
- 3.2. Market Restrains
- 3.3. Market Trends
- 3.4. Market Opportunities
- 4. Market Factor Analysis
- 4.1. Porters Five Forces
- 4.1.1. Bargaining Power of Suppliers
- 4.1.2. Bargaining Power of Buyers
- 4.1.3. Threat of New Entrants
- 4.1.4. Threat of Substitutes
- 4.1.5. Competitive Rivalry
- 4.2. PESTEL analysis
- 4.3. BCG Analysis
- 4.3.1. Stars (High Growth, High Market Share)
- 4.3.2. Cash Cows (Low Growth, High Market Share)
- 4.3.3. Question Mark (High Growth, Low Market Share)
- 4.3.4. Dogs (Low Growth, Low Market Share)
- 4.4. Ansoff Matrix Analysis
- 4.5. Supply Chain Analysis
- 4.6. Regulatory Landscape
- 4.7. Current Market Potential and Opportunity Assessment (TAM–SAM–SOM Framework)
- 4.8. DMV Analyst Note
- 4.1. Porters Five Forces
- 5. Market Analysis, Insights and Forecast 2021-2033
- 5.1. Market Analysis, Insights and Forecast - by Solutions
- 5.1.1. Know Your Customer (KYC) Systems
- 5.1.2. Compliance Reporting
- 5.1.3. Transaction Monitoring
- 5.1.4. Auditing and Reporting
- 5.1.5. Other Solutions
- 5.2. Market Analysis, Insights and Forecast - by Type
- 5.2.1. Software
- 5.2.2. Services
- 5.3. Market Analysis, Insights and Forecast - by Deployment Model
- 5.3.1. On-cloud
- 5.3.2. On-premise
- 5.4. Market Analysis, Insights and Forecast - by Region
- 5.4.1. North America
- 5.4.2. Europe
- 5.4.3. Asia Pacific
- 5.4.4. Latin America
- 5.4.5. Middle East and Africa
- 5.1. Market Analysis, Insights and Forecast - by Solutions
- 6. Global Anti-Money Laundering Solutions Industry Analysis, Insights and Forecast, 2021-2033
- 6.1. Market Analysis, Insights and Forecast - by Solutions
- 6.1.1. Know Your Customer (KYC) Systems
- 6.1.2. Compliance Reporting
- 6.1.3. Transaction Monitoring
- 6.1.4. Auditing and Reporting
- 6.1.5. Other Solutions
- 6.2. Market Analysis, Insights and Forecast - by Type
- 6.2.1. Software
- 6.2.2. Services
- 6.3. Market Analysis, Insights and Forecast - by Deployment Model
- 6.3.1. On-cloud
- 6.3.2. On-premise
- 6.1. Market Analysis, Insights and Forecast - by Solutions
- 7. North America Anti-Money Laundering Solutions Industry Analysis, Insights and Forecast, 2020-2032
- 7.1. Market Analysis, Insights and Forecast - by Solutions
- 7.1.1. Know Your Customer (KYC) Systems
- 7.1.2. Compliance Reporting
- 7.1.3. Transaction Monitoring
- 7.1.4. Auditing and Reporting
- 7.1.5. Other Solutions
- 7.2. Market Analysis, Insights and Forecast - by Type
- 7.2.1. Software
- 7.2.2. Services
- 7.3. Market Analysis, Insights and Forecast - by Deployment Model
- 7.3.1. On-cloud
- 7.3.2. On-premise
- 7.1. Market Analysis, Insights and Forecast - by Solutions
- 8. Europe Anti-Money Laundering Solutions Industry Analysis, Insights and Forecast, 2020-2032
- 8.1. Market Analysis, Insights and Forecast - by Solutions
- 8.1.1. Know Your Customer (KYC) Systems
- 8.1.2. Compliance Reporting
- 8.1.3. Transaction Monitoring
- 8.1.4. Auditing and Reporting
- 8.1.5. Other Solutions
- 8.2. Market Analysis, Insights and Forecast - by Type
- 8.2.1. Software
- 8.2.2. Services
- 8.3. Market Analysis, Insights and Forecast - by Deployment Model
- 8.3.1. On-cloud
- 8.3.2. On-premise
- 8.1. Market Analysis, Insights and Forecast - by Solutions
- 9. Asia Pacific Anti-Money Laundering Solutions Industry Analysis, Insights and Forecast, 2020-2032
- 9.1. Market Analysis, Insights and Forecast - by Solutions
- 9.1.1. Know Your Customer (KYC) Systems
- 9.1.2. Compliance Reporting
- 9.1.3. Transaction Monitoring
- 9.1.4. Auditing and Reporting
- 9.1.5. Other Solutions
- 9.2. Market Analysis, Insights and Forecast - by Type
- 9.2.1. Software
- 9.2.2. Services
- 9.3. Market Analysis, Insights and Forecast - by Deployment Model
- 9.3.1. On-cloud
- 9.3.2. On-premise
- 9.1. Market Analysis, Insights and Forecast - by Solutions
- 10. Latin America Anti-Money Laundering Solutions Industry Analysis, Insights and Forecast, 2020-2032
- 10.1. Market Analysis, Insights and Forecast - by Solutions
- 10.1.1. Know Your Customer (KYC) Systems
- 10.1.2. Compliance Reporting
- 10.1.3. Transaction Monitoring
- 10.1.4. Auditing and Reporting
- 10.1.5. Other Solutions
- 10.2. Market Analysis, Insights and Forecast - by Type
- 10.2.1. Software
- 10.2.2. Services
- 10.3. Market Analysis, Insights and Forecast - by Deployment Model
- 10.3.1. On-cloud
- 10.3.2. On-premise
- 10.1. Market Analysis, Insights and Forecast - by Solutions
- 11. Middle East and Africa Anti-Money Laundering Solutions Industry Analysis, Insights and Forecast, 2020-2032
- 11.1. Market Analysis, Insights and Forecast - by Solutions
- 11.1.1. Know Your Customer (KYC) Systems
- 11.1.2. Compliance Reporting
- 11.1.3. Transaction Monitoring
- 11.1.4. Auditing and Reporting
- 11.1.5. Other Solutions
- 11.2. Market Analysis, Insights and Forecast - by Type
- 11.2.1. Software
- 11.2.2. Services
- 11.3. Market Analysis, Insights and Forecast - by Deployment Model
- 11.3.1. On-cloud
- 11.3.2. On-premise
- 11.1. Market Analysis, Insights and Forecast - by Solutions
- 12. Competitive Analysis
- 12.1. Company Profiles
- 12.1.1 NICE Actimize (Nice Ltd)
- 12.1.1.1. Company Overview
- 12.1.1.2. Products
- 12.1.1.3. Company Financials
- 12.1.1.4. SWOT Analysis
- 12.1.2 SAS Institute Inc
- 12.1.2.1. Company Overview
- 12.1.2.2. Products
- 12.1.2.3. Company Financials
- 12.1.2.4. SWOT Analysis
- 12.1.3 Fiserv Inc
- 12.1.3.1. Company Overview
- 12.1.3.2. Products
- 12.1.3.3. Company Financials
- 12.1.3.4. SWOT Analysis
- 12.1.4 Profile Systems & Software SA
- 12.1.4.1. Company Overview
- 12.1.4.2. Products
- 12.1.4.3. Company Financials
- 12.1.4.4. SWOT Analysis
- 12.1.5 Temenos
- 12.1.5.1. Company Overview
- 12.1.5.2. Products
- 12.1.5.3. Company Financials
- 12.1.5.4. SWOT Analysis
- 12.1.6 Refinitiv Ltd
- 12.1.6.1. Company Overview
- 12.1.6.2. Products
- 12.1.6.3. Company Financials
- 12.1.6.4. SWOT Analysis
- 12.1.7 Experian Information Solutions Inc (Experian Ltd)
- 12.1.7.1. Company Overview
- 12.1.7.2. Products
- 12.1.7.3. Company Financials
- 12.1.7.4. SWOT Analysis
- 12.1.8 Tata Consultancy Services Limited
- 12.1.8.1. Company Overview
- 12.1.8.2. Products
- 12.1.8.3. Company Financials
- 12.1.8.4. SWOT Analysis
- 12.1.9 Fair Isaac Corporation (FICO)
- 12.1.9.1. Company Overview
- 12.1.9.2. Products
- 12.1.9.3. Company Financials
- 12.1.9.4. SWOT Analysis
- 12.1.10 Intellect Design Arena*List Not Exhaustive
- 12.1.10.1. Company Overview
- 12.1.10.2. Products
- 12.1.10.3. Company Financials
- 12.1.10.4. SWOT Analysis
- 12.1.11 Oracle Corporation
- 12.1.11.1. Company Overview
- 12.1.11.2. Products
- 12.1.11.3. Company Financials
- 12.1.11.4. SWOT Analysis
- 12.1.12 Symphony Innovation LLC
- 12.1.12.1. Company Overview
- 12.1.12.2. Products
- 12.1.12.3. Company Financials
- 12.1.12.4. SWOT Analysis
- 12.1.13 Fidelity National Information Services Inc (FIS)
- 12.1.13.1. Company Overview
- 12.1.13.2. Products
- 12.1.13.3. Company Financials
- 12.1.13.4. SWOT Analysis
- 12.1.14 ACI Worldwide Inc
- 12.1.14.1. Company Overview
- 12.1.14.2. Products
- 12.1.14.3. Company Financials
- 12.1.14.4. SWOT Analysis
- 12.1.15 Wolters Kluwer NV
- 12.1.15.1. Company Overview
- 12.1.15.2. Products
- 12.1.15.3. Company Financials
- 12.1.15.4. SWOT Analysis
- 12.1.16 Ltimindtree Limited
- 12.1.16.1. Company Overview
- 12.1.16.2. Products
- 12.1.16.3. Company Financials
- 12.1.16.4. SWOT Analysis
- 12.1.1 NICE Actimize (Nice Ltd)
- 12.2. Market Entropy
- 12.2.1 Company's Key Areas Served
- 12.2.2 Recent Developments
- 12.3. Company Market Share Analysis 2025
- 12.3.1 Top 5 Companies Market Share Analysis
- 12.3.2 Top 3 Companies Market Share Analysis
- 12.4. List of Potential Customers
- 13. Research Methodology
List of Figures
- Figure 1: Global Anti-Money Laundering Solutions Industry Revenue Breakdown (Million, %) by Region 2025 & 2033
- Figure 2: North America Anti-Money Laundering Solutions Industry Revenue (Million), by Solutions 2025 & 2033
- Figure 3: North America Anti-Money Laundering Solutions Industry Revenue Share (%), by Solutions 2025 & 2033
- Figure 4: North America Anti-Money Laundering Solutions Industry Revenue (Million), by Type 2025 & 2033
- Figure 5: North America Anti-Money Laundering Solutions Industry Revenue Share (%), by Type 2025 & 2033
- Figure 6: North America Anti-Money Laundering Solutions Industry Revenue (Million), by Deployment Model 2025 & 2033
- Figure 7: North America Anti-Money Laundering Solutions Industry Revenue Share (%), by Deployment Model 2025 & 2033
- Figure 8: North America Anti-Money Laundering Solutions Industry Revenue (Million), by Country 2025 & 2033
- Figure 9: North America Anti-Money Laundering Solutions Industry Revenue Share (%), by Country 2025 & 2033
- Figure 10: Europe Anti-Money Laundering Solutions Industry Revenue (Million), by Solutions 2025 & 2033
- Figure 11: Europe Anti-Money Laundering Solutions Industry Revenue Share (%), by Solutions 2025 & 2033
- Figure 12: Europe Anti-Money Laundering Solutions Industry Revenue (Million), by Type 2025 & 2033
- Figure 13: Europe Anti-Money Laundering Solutions Industry Revenue Share (%), by Type 2025 & 2033
- Figure 14: Europe Anti-Money Laundering Solutions Industry Revenue (Million), by Deployment Model 2025 & 2033
- Figure 15: Europe Anti-Money Laundering Solutions Industry Revenue Share (%), by Deployment Model 2025 & 2033
- Figure 16: Europe Anti-Money Laundering Solutions Industry Revenue (Million), by Country 2025 & 2033
- Figure 17: Europe Anti-Money Laundering Solutions Industry Revenue Share (%), by Country 2025 & 2033
- Figure 18: Asia Pacific Anti-Money Laundering Solutions Industry Revenue (Million), by Solutions 2025 & 2033
- Figure 19: Asia Pacific Anti-Money Laundering Solutions Industry Revenue Share (%), by Solutions 2025 & 2033
- Figure 20: Asia Pacific Anti-Money Laundering Solutions Industry Revenue (Million), by Type 2025 & 2033
- Figure 21: Asia Pacific Anti-Money Laundering Solutions Industry Revenue Share (%), by Type 2025 & 2033
- Figure 22: Asia Pacific Anti-Money Laundering Solutions Industry Revenue (Million), by Deployment Model 2025 & 2033
- Figure 23: Asia Pacific Anti-Money Laundering Solutions Industry Revenue Share (%), by Deployment Model 2025 & 2033
- Figure 24: Asia Pacific Anti-Money Laundering Solutions Industry Revenue (Million), by Country 2025 & 2033
- Figure 25: Asia Pacific Anti-Money Laundering Solutions Industry Revenue Share (%), by Country 2025 & 2033
- Figure 26: Latin America Anti-Money Laundering Solutions Industry Revenue (Million), by Solutions 2025 & 2033
- Figure 27: Latin America Anti-Money Laundering Solutions Industry Revenue Share (%), by Solutions 2025 & 2033
- Figure 28: Latin America Anti-Money Laundering Solutions Industry Revenue (Million), by Type 2025 & 2033
- Figure 29: Latin America Anti-Money Laundering Solutions Industry Revenue Share (%), by Type 2025 & 2033
- Figure 30: Latin America Anti-Money Laundering Solutions Industry Revenue (Million), by Deployment Model 2025 & 2033
- Figure 31: Latin America Anti-Money Laundering Solutions Industry Revenue Share (%), by Deployment Model 2025 & 2033
- Figure 32: Latin America Anti-Money Laundering Solutions Industry Revenue (Million), by Country 2025 & 2033
- Figure 33: Latin America Anti-Money Laundering Solutions Industry Revenue Share (%), by Country 2025 & 2033
- Figure 34: Middle East and Africa Anti-Money Laundering Solutions Industry Revenue (Million), by Solutions 2025 & 2033
- Figure 35: Middle East and Africa Anti-Money Laundering Solutions Industry Revenue Share (%), by Solutions 2025 & 2033
- Figure 36: Middle East and Africa Anti-Money Laundering Solutions Industry Revenue (Million), by Type 2025 & 2033
- Figure 37: Middle East and Africa Anti-Money Laundering Solutions Industry Revenue Share (%), by Type 2025 & 2033
- Figure 38: Middle East and Africa Anti-Money Laundering Solutions Industry Revenue (Million), by Deployment Model 2025 & 2033
- Figure 39: Middle East and Africa Anti-Money Laundering Solutions Industry Revenue Share (%), by Deployment Model 2025 & 2033
- Figure 40: Middle East and Africa Anti-Money Laundering Solutions Industry Revenue (Million), by Country 2025 & 2033
- Figure 41: Middle East and Africa Anti-Money Laundering Solutions Industry Revenue Share (%), by Country 2025 & 2033
List of Tables
- Table 1: Global Anti-Money Laundering Solutions Industry Revenue Million Forecast, by Solutions 2020 & 2033
- Table 2: Global Anti-Money Laundering Solutions Industry Revenue Million Forecast, by Type 2020 & 2033
- Table 3: Global Anti-Money Laundering Solutions Industry Revenue Million Forecast, by Deployment Model 2020 & 2033
- Table 4: Global Anti-Money Laundering Solutions Industry Revenue Million Forecast, by Region 2020 & 2033
- Table 5: Global Anti-Money Laundering Solutions Industry Revenue Million Forecast, by Solutions 2020 & 2033
- Table 6: Global Anti-Money Laundering Solutions Industry Revenue Million Forecast, by Type 2020 & 2033
- Table 7: Global Anti-Money Laundering Solutions Industry Revenue Million Forecast, by Deployment Model 2020 & 2033
- Table 8: Global Anti-Money Laundering Solutions Industry Revenue Million Forecast, by Country 2020 & 2033
- Table 9: United States Anti-Money Laundering Solutions Industry Revenue (Million) Forecast, by Application 2020 & 2033
- Table 10: Canada Anti-Money Laundering Solutions Industry Revenue (Million) Forecast, by Application 2020 & 2033
- Table 11: Global Anti-Money Laundering Solutions Industry Revenue Million Forecast, by Solutions 2020 & 2033
- Table 12: Global Anti-Money Laundering Solutions Industry Revenue Million Forecast, by Type 2020 & 2033
- Table 13: Global Anti-Money Laundering Solutions Industry Revenue Million Forecast, by Deployment Model 2020 & 2033
- Table 14: Global Anti-Money Laundering Solutions Industry Revenue Million Forecast, by Country 2020 & 2033
- Table 15: United Kingdom Anti-Money Laundering Solutions Industry Revenue (Million) Forecast, by Application 2020 & 2033
- Table 16: Germany Anti-Money Laundering Solutions Industry Revenue (Million) Forecast, by Application 2020 & 2033
- Table 17: France Anti-Money Laundering Solutions Industry Revenue (Million) Forecast, by Application 2020 & 2033
- Table 18: Spain Anti-Money Laundering Solutions Industry Revenue (Million) Forecast, by Application 2020 & 2033
- Table 19: Rest of Europe Anti-Money Laundering Solutions Industry Revenue (Million) Forecast, by Application 2020 & 2033
- Table 20: Global Anti-Money Laundering Solutions Industry Revenue Million Forecast, by Solutions 2020 & 2033
- Table 21: Global Anti-Money Laundering Solutions Industry Revenue Million Forecast, by Type 2020 & 2033
- Table 22: Global Anti-Money Laundering Solutions Industry Revenue Million Forecast, by Deployment Model 2020 & 2033
- Table 23: Global Anti-Money Laundering Solutions Industry Revenue Million Forecast, by Country 2020 & 2033
- Table 24: China Anti-Money Laundering Solutions Industry Revenue (Million) Forecast, by Application 2020 & 2033
- Table 25: Japan Anti-Money Laundering Solutions Industry Revenue (Million) Forecast, by Application 2020 & 2033
- Table 26: India Anti-Money Laundering Solutions Industry Revenue (Million) Forecast, by Application 2020 & 2033
- Table 27: Southeast Asia Anti-Money Laundering Solutions Industry Revenue (Million) Forecast, by Application 2020 & 2033
- Table 28: Rest of Asia Pacific Anti-Money Laundering Solutions Industry Revenue (Million) Forecast, by Application 2020 & 2033
- Table 29: Global Anti-Money Laundering Solutions Industry Revenue Million Forecast, by Solutions 2020 & 2033
- Table 30: Global Anti-Money Laundering Solutions Industry Revenue Million Forecast, by Type 2020 & 2033
- Table 31: Global Anti-Money Laundering Solutions Industry Revenue Million Forecast, by Deployment Model 2020 & 2033
- Table 32: Global Anti-Money Laundering Solutions Industry Revenue Million Forecast, by Country 2020 & 2033
- Table 33: Global Anti-Money Laundering Solutions Industry Revenue Million Forecast, by Solutions 2020 & 2033
- Table 34: Global Anti-Money Laundering Solutions Industry Revenue Million Forecast, by Type 2020 & 2033
- Table 35: Global Anti-Money Laundering Solutions Industry Revenue Million Forecast, by Deployment Model 2020 & 2033
- Table 36: Global Anti-Money Laundering Solutions Industry Revenue Million Forecast, by Country 2020 & 2033
Frequently Asked Questions
1. What is the projected Compound Annual Growth Rate (CAGR) of the Anti-Money Laundering Solutions Industry?
The projected CAGR is approximately 15.06%.
2. Which companies are prominent players in the Anti-Money Laundering Solutions Industry?
Key companies in the market include NICE Actimize (Nice Ltd), SAS Institute Inc, Fiserv Inc, Profile Systems & Software SA, Temenos, Refinitiv Ltd, Experian Information Solutions Inc (Experian Ltd), Tata Consultancy Services Limited, Fair Isaac Corporation (FICO), Intellect Design Arena*List Not Exhaustive, Oracle Corporation, Symphony Innovation LLC, Fidelity National Information Services Inc (FIS), ACI Worldwide Inc, Wolters Kluwer NV, Ltimindtree Limited.
3. What are the main segments of the Anti-Money Laundering Solutions Industry?
The market segments include Solutions, Type, Deployment Model.
4. Can you provide details about the market size?
The market size is estimated to be USD 2.98 Million as of 2022.
5. What are some drivers contributing to market growth?
Increased Adoption of Digital/Mobile Payment Solutions; Stringent Government Regulations for Compliance Management.
6. What are the notable trends driving market growth?
Know Your Customer (KYC) Systems to Witness Major Growth.
7. Are there any restraints impacting market growth?
Lack of Skilled Professionals.
8. Can you provide examples of recent developments in the market?
January 2023 - IMTF, one of the leaders in regulatory technology and process automation for financial institutions, acquired the Siron anti-money laundering and compliance solutions developed by US-based FICO Corporation. With this acquisition, IMTF assumed the global operations of all Siron anti-financial crime solutions.
9. What pricing options are available for accessing the report?
Pricing options include single-user, multi-user, and enterprise licenses priced at USD 4750, USD 5250, and USD 8750 respectively.
10. Is the market size provided in terms of value or volume?
The market size is provided in terms of value, measured in Million.
11. Are there any specific market keywords associated with the report?
Yes, the market keyword associated with the report is "Anti-Money Laundering Solutions Industry," which aids in identifying and referencing the specific market segment covered.
12. How do I determine which pricing option suits my needs best?
The pricing options vary based on user requirements and access needs. Individual users may opt for single-user licenses, while businesses requiring broader access may choose multi-user or enterprise licenses for cost-effective access to the report.
13. Are there any additional resources or data provided in the Anti-Money Laundering Solutions Industry report?
While the report offers comprehensive insights, it's advisable to review the specific contents or supplementary materials provided to ascertain if additional resources or data are available.
14. How can I stay updated on further developments or reports in the Anti-Money Laundering Solutions Industry?
To stay informed about further developments, trends, and reports in the Anti-Money Laundering Solutions Industry, consider subscribing to industry newsletters, following relevant companies and organizations, or regularly checking reputable industry news sources and publications.
Methodology
Step 1 - Identification of Relevant Samples Size from Population Database


Step 2 - Approaches for Defining Global Market Size (Value, Volume* & Price*)

Note*: In applicable scenarios
Step 3 - Data Sources
Primary Research
- Web Analytics
- Survey Reports
- Research Institute
- Latest Research Reports
- Opinion Leaders
Secondary Research
- Annual Reports
- White Paper
- Latest Press Release
- Industry Association
- Paid Database
- Investor Presentations

Step 4 - Data Triangulation
Involves using different sources of information in order to increase the validity of a study
These sources are likely to be stakeholders in a program - participants, other researchers, program staff, other community members, and so on.
Then we put all data in single framework & apply various statistical tools to find out the dynamic on the market.
During the analysis stage, feedback from the stakeholder groups would be compared to determine areas of agreement as well as areas of divergence