

Key Insights
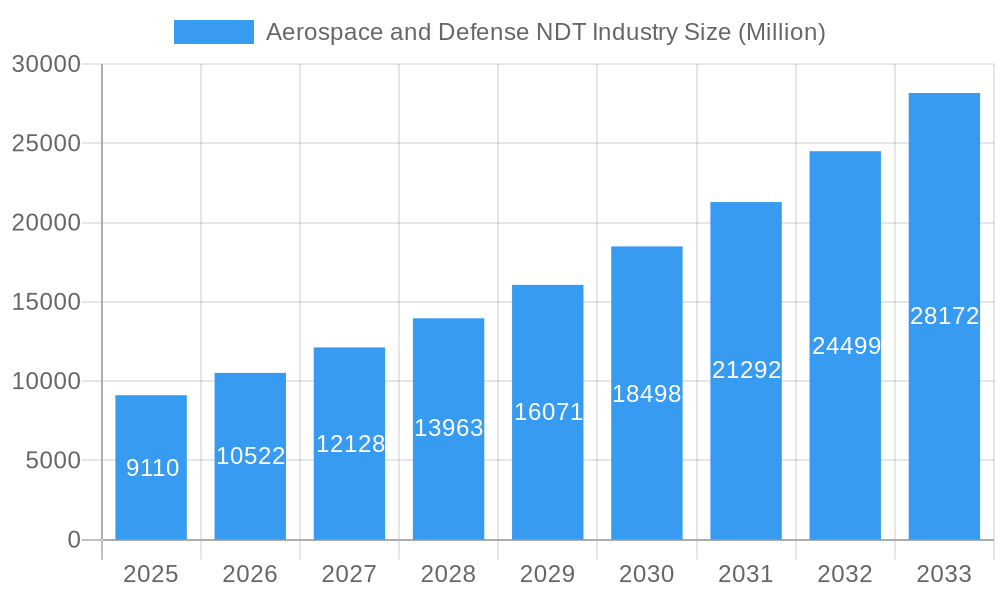
The Aerospace and Defense Non-Destructive Testing (NDT) market is experiencing robust growth, driven by increasing demand for enhanced aircraft safety and stricter regulatory compliance. The market, valued at $9.11 billion in 2025, is projected to expand at a Compound Annual Growth Rate (CAGR) of 15.74% from 2025 to 2033. This growth is fueled by several key factors. Firstly, the rising adoption of advanced NDT technologies, such as ultrasonic testing and eddy current testing, allows for more precise and efficient detection of flaws in aircraft components and defense systems. Secondly, the increasing complexity of aerospace and defense equipment necessitates more sophisticated inspection methods to ensure structural integrity and operational safety. Furthermore, stringent government regulations and industry standards mandate rigorous NDT procedures throughout the lifecycle of these assets. The market's segmentation reveals a significant contribution from both service providers and equipment manufacturers, with radiography testing and ultrasonic testing holding substantial market shares due to their established reliability and versatility. Competition is fierce, with key players like Fujifilm, Intertek, Magnaflux, and Olympus constantly innovating and expanding their service portfolios to cater to the evolving needs of the industry.
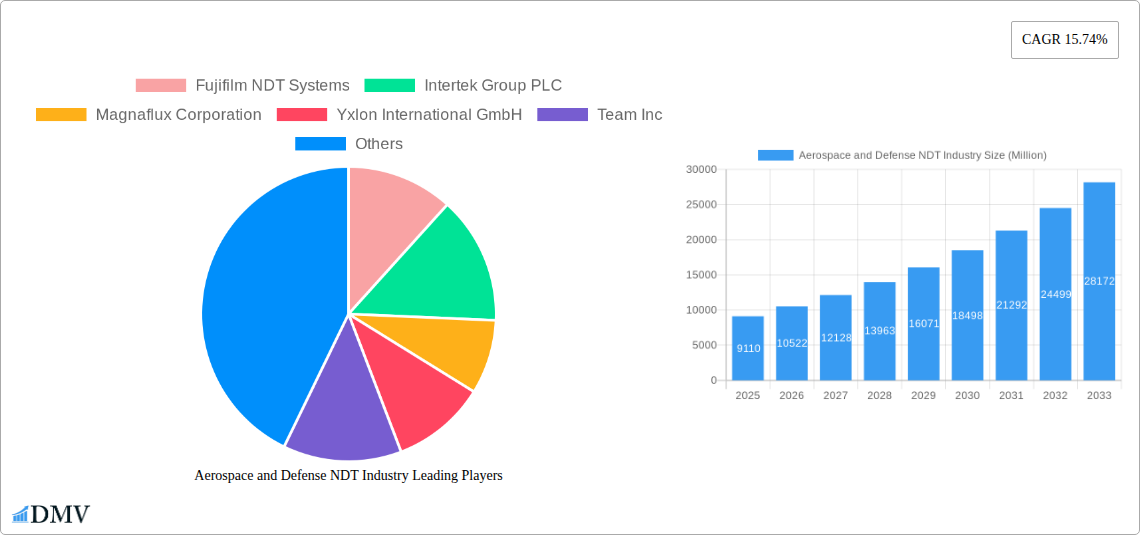
Aerospace and Defense NDT Industry Market Size (In Billion)
Geographical expansion presents significant opportunities, with regions like Asia-Pacific expected to witness particularly rapid growth due to increasing investments in aerospace and defense infrastructure and a rising number of aircraft manufacturing facilities. However, factors such as high initial investment costs associated with advanced NDT equipment and the skilled labor shortage could potentially restrain market growth in certain regions. Nevertheless, the long-term outlook for the Aerospace and Defense NDT market remains positive, driven by sustained demand for high-quality, reliable inspection services and technologies. The ongoing development of artificial intelligence (AI) and machine learning (ML) integrated NDT solutions presents a particularly compelling avenue for future growth, promising faster, more accurate, and cost-effective inspection processes. This will be critical to maintaining pace with the rapid advancements in aerospace and defense technologies.
Aerospace and Defense NDT Industry Company Market Share
Aerospace and Defense NDT Industry Market Report: 2019-2033
This comprehensive report provides an in-depth analysis of the Aerospace and Defense Non-Destructive Testing (NDT) industry, projecting a market value exceeding $XX Million by 2033. The study covers the period 2019-2033, with a base year of 2025 and a forecast period of 2025-2033. This report is essential for stakeholders seeking to understand market dynamics, identify growth opportunities, and navigate the competitive landscape.
Aerospace and Defense NDT Industry Market Composition & Trends
The Aerospace and Defense NDT market, valued at $XX Million in 2025, exhibits a moderately consolidated structure. Key players such as Fujifilm NDT Systems, Intertek Group PLC, Magnaflux Corporation, and Olympus Corporation hold significant market share, while numerous smaller companies contribute to the overall market volume. Market share distribution is dynamic, influenced by factors like technological innovation, acquisitions, and regulatory changes. The industry experiences continuous innovation driven by the need for enhanced inspection techniques to meet stringent safety and quality standards. Stringent regulatory compliance requirements, particularly within the aerospace and defense sectors, impose significant influence on market growth and operations. Substitute products are limited, mainly alternative inspection methodologies which rarely offer comparable accuracy or efficiency. The end-user profile primarily consists of aerospace manufacturers, defense contractors, and maintenance, repair, and overhaul (MRO) service providers. M&A activity has been moderate, with deal values ranging from $XX Million to $XX Million in recent years, primarily focused on strengthening technology portfolios and expanding geographic reach.
- Market Concentration: Moderately Consolidated
- Top 5 Players Market Share: xx%
- Average M&A Deal Value (2019-2024): $XX Million
- Regulatory Landscape: Stringent, driving demand for advanced NDT solutions.
Aerospace and Defense NDT Industry Industry Evolution
The Aerospace and Defense NDT industry demonstrates consistent growth, driven by increasing demand for safer and more reliable aircraft and defense systems. The historical period (2019-2024) witnessed an average annual growth rate (CAGR) of xx%, primarily attributed to technological advancements and the growing complexity of aerospace and defense components. Technological advancements, particularly in automated inspection systems and advanced data analytics, are transforming the industry. The adoption rate of automated systems is steadily increasing, with xx% of major players already utilizing them. Emerging trends such as the use of artificial intelligence (AI) and machine learning (ML) for enhanced defect detection and predictive maintenance are further shaping industry dynamics. Shifting consumer demands toward improved safety standards, faster inspection processes, and reduced operational costs are influencing the development of innovative NDT solutions.
Leading Regions, Countries, or Segments in Aerospace and Defense NDT Industry
North America currently dominates the Aerospace and Defense NDT market, driven by a strong presence of major aerospace and defense manufacturers and a robust regulatory framework. Europe and Asia-Pacific are also significant markets, exhibiting strong growth potential.
By Type:
- Service Segment Dominance: The service segment holds a larger market share due to the increasing outsourcing of NDT activities. Drivers include cost-effectiveness, access to specialized expertise, and the need for flexible capacity.
- Equipment Segment Growth: Steady growth driven by investments in advanced NDT equipment.
By Technology:
- Radiography Testing: Remains a dominant technology due to its versatility and ability to detect internal flaws. Growth is driven by advancements in digital radiography.
- Ultrasonic Testing: High adoption rate, driven by its portability and ability to inspect various materials. Advancements in phased array technology enhance its efficiency.
- Magnetic Particle Testing and Electromagnetic Testing: Strong demand in applications involving ferrous metals. Growth is driven by developments in high-sensitivity detectors and advanced signal processing.
- Liquid Penetrant Testing: A widely used method for detecting surface flaws. Continued growth due to simplicity and cost-effectiveness.
- Visual Inspection: Significant market share, used for initial assessments and supporting other methods. Ongoing innovation in digital imaging and remote inspection techniques.
- Eddy Current Testing: Growing adoption due to its speed and suitability for conducting inspections on conductive materials.
Key Drivers (for dominant regions/segments):
- High investment in aerospace and defense infrastructure.
- Stringent regulatory requirements for quality control and safety.
- Adoption of advanced technologies such as AI and automation.
Aerospace and Defense NDT Industry Product Innovations
Recent product innovations focus on enhanced automation, portability, and data analysis capabilities. New systems integrate AI-powered defect recognition, providing faster and more accurate results. Software advancements enable efficient data management and reporting, streamlining inspection workflows and reducing human error. This leads to greater operational efficiency, faster turnaround times, and reduced inspection costs.
Propelling Factors for Aerospace and Defense NDT Industry Growth
Several factors drive the industry’s growth, including increasing demand for advanced NDT solutions due to stringent regulatory frameworks in aerospace and defense; rising adoption of advanced technologies like AI and automation for improved efficiency and accuracy; and increased investment in R&D to develop more sophisticated NDT techniques. Economic growth in key markets further fuels demand for air travel and defense systems.
Obstacles in the Aerospace and Defense NDT Industry Market
The market faces challenges such as high upfront investment costs for advanced NDT equipment, potential supply chain disruptions impacting component availability and production cycles, and intense competition among established and emerging players. Regulatory hurdles and compliance requirements for NDT methods vary across different jurisdictions, resulting in added complexities and costs.
Future Opportunities in Aerospace and Defense NDT Industry
Emerging opportunities lie in the adoption of advanced technologies, such as AI-powered predictive maintenance and remote inspection capabilities. Growing demand for sustainable aerospace and defense technologies drives innovation in environmentally friendly NDT methods. Expanding into new markets, particularly in developing economies, offers significant growth potential.
Major Players in the Aerospace and Defense NDT Industry Ecosystem
Key Developments in Aerospace and Defense NDT Industry Industry
- March 2024: Eddyfi Technologies launches TubePro 6, advanced pre-inspection and reporting software, enhancing efficiency in heat exchanger inspections.
- February 2024: Rad Source NDT launches NDT 1000 X-ray Inspection System, capable of handling materials up to 0.5 inches thick, offering improved precision and speed.
Strategic Aerospace and Defense NDT Industry Market Forecast
The Aerospace and Defense NDT market is poised for robust growth, driven by technological advancements and increasing demand for reliable and efficient inspection solutions. The market is expected to experience a CAGR of xx% during the forecast period (2025-2033), exceeding $XX Million by 2033. This growth will be fueled by the ongoing adoption of advanced NDT technologies, rising investments in aerospace and defense infrastructure, and the need to meet stringent regulatory requirements.
Aerospace and Defense NDT Industry Segmentation
-
1. Type
- 1.1. Service
- 1.2. Equipment
-
2. Technology
- 2.1. Radiography Testing
- 2.2. Ultrasonic Testing
- 2.3. Magnetic
- 2.4. Liquid Penetrant Testing
- 2.5. Visual Inspection
- 2.6. Eddy Current
Aerospace and Defense NDT Industry Segmentation By Geography
- 1. North America
- 2. Europe
- 3. Asia
- 4. Australia and New Zealand
- 5. Latin America
- 6. Middle East and Africa
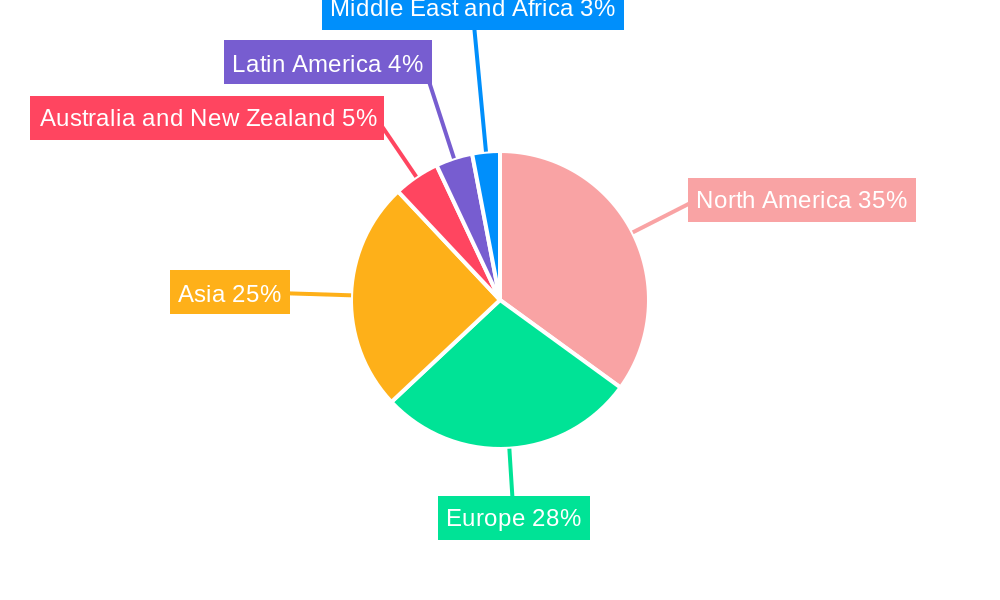
Aerospace and Defense NDT Industry Regional Market Share
Geographic Coverage of Aerospace and Defense NDT Industry
Aerospace and Defense NDT Industry REPORT HIGHLIGHTS
| Aspects | Details |
|---|---|
| Study Period | 2020-2034 |
| Base Year | 2025 |
| Estimated Year | 2026 |
| Forecast Period | 2026-2034 |
| Historical Period | 2020-2025 |
| Growth Rate | CAGR of 15.74% from 2020-2034 |
| Segmentation |
|
Table of Contents
- 1. Introduction
- 1.1. Research Scope
- 1.2. Market Segmentation
- 1.3. Research Objective
- 1.4. Definitions and Assumptions
- 2. Executive Summary
- 2.1. Market Snapshot
- 3. Market Dynamics
- 3.1. Market Drivers
- 3.2. Market Restrains
- 3.3. Market Trends
- 3.4. Market Opportunities
- 4. Market Factor Analysis
- 4.1. Porters Five Forces
- 4.1.1. Bargaining Power of Suppliers
- 4.1.2. Bargaining Power of Buyers
- 4.1.3. Threat of New Entrants
- 4.1.4. Threat of Substitutes
- 4.1.5. Competitive Rivalry
- 4.2. PESTEL analysis
- 4.3. BCG Analysis
- 4.3.1. Stars (High Growth, High Market Share)
- 4.3.2. Cash Cows (Low Growth, High Market Share)
- 4.3.3. Question Mark (High Growth, Low Market Share)
- 4.3.4. Dogs (Low Growth, Low Market Share)
- 4.4. Ansoff Matrix Analysis
- 4.5. Supply Chain Analysis
- 4.6. Regulatory Landscape
- 4.7. Current Market Potential and Opportunity Assessment (TAM–SAM–SOM Framework)
- 4.8. DMV Analyst Note
- 4.1. Porters Five Forces
- 5. Market Analysis, Insights and Forecast 2021-2033
- 5.1. Market Analysis, Insights and Forecast - by Type
- 5.1.1. Service
- 5.1.2. Equipment
- 5.2. Market Analysis, Insights and Forecast - by Technology
- 5.2.1. Radiography Testing
- 5.2.2. Ultrasonic Testing
- 5.2.3. Magnetic
- 5.2.4. Liquid Penetrant Testing
- 5.2.5. Visual Inspection
- 5.2.6. Eddy Current
- 5.3. Market Analysis, Insights and Forecast - by Region
- 5.3.1. North America
- 5.3.2. Europe
- 5.3.3. Asia
- 5.3.4. Australia and New Zealand
- 5.3.5. Latin America
- 5.3.6. Middle East and Africa
- 5.1. Market Analysis, Insights and Forecast - by Type
- 6. Global Aerospace and Defense NDT Industry Analysis, Insights and Forecast, 2021-2033
- 6.1. Market Analysis, Insights and Forecast - by Type
- 6.1.1. Service
- 6.1.2. Equipment
- 6.2. Market Analysis, Insights and Forecast - by Technology
- 6.2.1. Radiography Testing
- 6.2.2. Ultrasonic Testing
- 6.2.3. Magnetic
- 6.2.4. Liquid Penetrant Testing
- 6.2.5. Visual Inspection
- 6.2.6. Eddy Current
- 6.1. Market Analysis, Insights and Forecast - by Type
- 7. North America Aerospace and Defense NDT Industry Analysis, Insights and Forecast, 2020-2032
- 7.1. Market Analysis, Insights and Forecast - by Type
- 7.1.1. Service
- 7.1.2. Equipment
- 7.2. Market Analysis, Insights and Forecast - by Technology
- 7.2.1. Radiography Testing
- 7.2.2. Ultrasonic Testing
- 7.2.3. Magnetic
- 7.2.4. Liquid Penetrant Testing
- 7.2.5. Visual Inspection
- 7.2.6. Eddy Current
- 7.1. Market Analysis, Insights and Forecast - by Type
- 8. Europe Aerospace and Defense NDT Industry Analysis, Insights and Forecast, 2020-2032
- 8.1. Market Analysis, Insights and Forecast - by Type
- 8.1.1. Service
- 8.1.2. Equipment
- 8.2. Market Analysis, Insights and Forecast - by Technology
- 8.2.1. Radiography Testing
- 8.2.2. Ultrasonic Testing
- 8.2.3. Magnetic
- 8.2.4. Liquid Penetrant Testing
- 8.2.5. Visual Inspection
- 8.2.6. Eddy Current
- 8.1. Market Analysis, Insights and Forecast - by Type
- 9. Asia Aerospace and Defense NDT Industry Analysis, Insights and Forecast, 2020-2032
- 9.1. Market Analysis, Insights and Forecast - by Type
- 9.1.1. Service
- 9.1.2. Equipment
- 9.2. Market Analysis, Insights and Forecast - by Technology
- 9.2.1. Radiography Testing
- 9.2.2. Ultrasonic Testing
- 9.2.3. Magnetic
- 9.2.4. Liquid Penetrant Testing
- 9.2.5. Visual Inspection
- 9.2.6. Eddy Current
- 9.1. Market Analysis, Insights and Forecast - by Type
- 10. Australia and New Zealand Aerospace and Defense NDT Industry Analysis, Insights and Forecast, 2020-2032
- 10.1. Market Analysis, Insights and Forecast - by Type
- 10.1.1. Service
- 10.1.2. Equipment
- 10.2. Market Analysis, Insights and Forecast - by Technology
- 10.2.1. Radiography Testing
- 10.2.2. Ultrasonic Testing
- 10.2.3. Magnetic
- 10.2.4. Liquid Penetrant Testing
- 10.2.5. Visual Inspection
- 10.2.6. Eddy Current
- 10.1. Market Analysis, Insights and Forecast - by Type
- 11. Latin America Aerospace and Defense NDT Industry Analysis, Insights and Forecast, 2020-2032
- 11.1. Market Analysis, Insights and Forecast - by Type
- 11.1.1. Service
- 11.1.2. Equipment
- 11.2. Market Analysis, Insights and Forecast - by Technology
- 11.2.1. Radiography Testing
- 11.2.2. Ultrasonic Testing
- 11.2.3. Magnetic
- 11.2.4. Liquid Penetrant Testing
- 11.2.5. Visual Inspection
- 11.2.6. Eddy Current
- 11.1. Market Analysis, Insights and Forecast - by Type
- 12. Middle East and Africa Aerospace and Defense NDT Industry Analysis, Insights and Forecast, 2020-2032
- 12.1. Market Analysis, Insights and Forecast - by Type
- 12.1.1. Service
- 12.1.2. Equipment
- 12.2. Market Analysis, Insights and Forecast - by Technology
- 12.2.1. Radiography Testing
- 12.2.2. Ultrasonic Testing
- 12.2.3. Magnetic
- 12.2.4. Liquid Penetrant Testing
- 12.2.5. Visual Inspection
- 12.2.6. Eddy Current
- 12.1. Market Analysis, Insights and Forecast - by Type
- 13. Competitive Analysis
- 13.1. Company Profiles
- 13.1.1 Fujifilm NDT Systems
- 13.1.1.1. Company Overview
- 13.1.1.2. Products
- 13.1.1.3. Company Financials
- 13.1.1.4. SWOT Analysis
- 13.1.2 Intertek Group PLC
- 13.1.2.1. Company Overview
- 13.1.2.2. Products
- 13.1.2.3. Company Financials
- 13.1.2.4. SWOT Analysis
- 13.1.3 Magnaflux Corporation
- 13.1.3.1. Company Overview
- 13.1.3.2. Products
- 13.1.3.3. Company Financials
- 13.1.3.4. SWOT Analysis
- 13.1.4 Yxlon International GmbH
- 13.1.4.1. Company Overview
- 13.1.4.2. Products
- 13.1.4.3. Company Financials
- 13.1.4.4. SWOT Analysis
- 13.1.5 Team Inc
- 13.1.5.1. Company Overview
- 13.1.5.2. Products
- 13.1.5.3. Company Financials
- 13.1.5.4. SWOT Analysis
- 13.1.6 SGS Group
- 13.1.6.1. Company Overview
- 13.1.6.2. Products
- 13.1.6.3. Company Financials
- 13.1.6.4. SWOT Analysis
- 13.1.7 TUV Rheinland Ag
- 13.1.7.1. Company Overview
- 13.1.7.2. Products
- 13.1.7.3. Company Financials
- 13.1.7.4. SWOT Analysis
- 13.1.8 NikonMetrology Inc
- 13.1.8.1. Company Overview
- 13.1.8.2. Products
- 13.1.8.3. Company Financials
- 13.1.8.4. SWOT Analysis
- 13.1.9 Mistras Group
- 13.1.9.1. Company Overview
- 13.1.9.2. Products
- 13.1.9.3. Company Financials
- 13.1.9.4. SWOT Analysis
- 13.1.10 Olympus Corporation
- 13.1.10.1. Company Overview
- 13.1.10.2. Products
- 13.1.10.3. Company Financials
- 13.1.10.4. SWOT Analysis
- 13.1.11 GE Measurement and Control
- 13.1.11.1. Company Overview
- 13.1.11.2. Products
- 13.1.11.3. Company Financials
- 13.1.11.4. SWOT Analysis
- 13.1.12 Applus Services S A
- 13.1.12.1. Company Overview
- 13.1.12.2. Products
- 13.1.12.3. Company Financials
- 13.1.12.4. SWOT Analysis
- 13.1.13 FLIR Systems Inc *List Not Exhaustive
- 13.1.13.1. Company Overview
- 13.1.13.2. Products
- 13.1.13.3. Company Financials
- 13.1.13.4. SWOT Analysis
- 13.1.14 Gould-Bass Co
- 13.1.14.1. Company Overview
- 13.1.14.2. Products
- 13.1.14.3. Company Financials
- 13.1.14.4. SWOT Analysis
- 13.1.1 Fujifilm NDT Systems
- 13.2. Market Entropy
- 13.2.1 Company's Key Areas Served
- 13.2.2 Recent Developments
- 13.3. Company Market Share Analysis 2025
- 13.3.1 Top 5 Companies Market Share Analysis
- 13.3.2 Top 3 Companies Market Share Analysis
- 13.4. List of Potential Customers
- 14. Research Methodology
List of Figures
- Figure 1: Global Aerospace and Defense NDT Industry Revenue Breakdown (Million, %) by Region 2025 & 2033
- Figure 2: North America Aerospace and Defense NDT Industry Revenue (Million), by Type 2025 & 2033
- Figure 3: North America Aerospace and Defense NDT Industry Revenue Share (%), by Type 2025 & 2033
- Figure 4: North America Aerospace and Defense NDT Industry Revenue (Million), by Technology 2025 & 2033
- Figure 5: North America Aerospace and Defense NDT Industry Revenue Share (%), by Technology 2025 & 2033
- Figure 6: North America Aerospace and Defense NDT Industry Revenue (Million), by Country 2025 & 2033
- Figure 7: North America Aerospace and Defense NDT Industry Revenue Share (%), by Country 2025 & 2033
- Figure 8: Europe Aerospace and Defense NDT Industry Revenue (Million), by Type 2025 & 2033
- Figure 9: Europe Aerospace and Defense NDT Industry Revenue Share (%), by Type 2025 & 2033
- Figure 10: Europe Aerospace and Defense NDT Industry Revenue (Million), by Technology 2025 & 2033
- Figure 11: Europe Aerospace and Defense NDT Industry Revenue Share (%), by Technology 2025 & 2033
- Figure 12: Europe Aerospace and Defense NDT Industry Revenue (Million), by Country 2025 & 2033
- Figure 13: Europe Aerospace and Defense NDT Industry Revenue Share (%), by Country 2025 & 2033
- Figure 14: Asia Aerospace and Defense NDT Industry Revenue (Million), by Type 2025 & 2033
- Figure 15: Asia Aerospace and Defense NDT Industry Revenue Share (%), by Type 2025 & 2033
- Figure 16: Asia Aerospace and Defense NDT Industry Revenue (Million), by Technology 2025 & 2033
- Figure 17: Asia Aerospace and Defense NDT Industry Revenue Share (%), by Technology 2025 & 2033
- Figure 18: Asia Aerospace and Defense NDT Industry Revenue (Million), by Country 2025 & 2033
- Figure 19: Asia Aerospace and Defense NDT Industry Revenue Share (%), by Country 2025 & 2033
- Figure 20: Australia and New Zealand Aerospace and Defense NDT Industry Revenue (Million), by Type 2025 & 2033
- Figure 21: Australia and New Zealand Aerospace and Defense NDT Industry Revenue Share (%), by Type 2025 & 2033
- Figure 22: Australia and New Zealand Aerospace and Defense NDT Industry Revenue (Million), by Technology 2025 & 2033
- Figure 23: Australia and New Zealand Aerospace and Defense NDT Industry Revenue Share (%), by Technology 2025 & 2033
- Figure 24: Australia and New Zealand Aerospace and Defense NDT Industry Revenue (Million), by Country 2025 & 2033
- Figure 25: Australia and New Zealand Aerospace and Defense NDT Industry Revenue Share (%), by Country 2025 & 2033
- Figure 26: Latin America Aerospace and Defense NDT Industry Revenue (Million), by Type 2025 & 2033
- Figure 27: Latin America Aerospace and Defense NDT Industry Revenue Share (%), by Type 2025 & 2033
- Figure 28: Latin America Aerospace and Defense NDT Industry Revenue (Million), by Technology 2025 & 2033
- Figure 29: Latin America Aerospace and Defense NDT Industry Revenue Share (%), by Technology 2025 & 2033
- Figure 30: Latin America Aerospace and Defense NDT Industry Revenue (Million), by Country 2025 & 2033
- Figure 31: Latin America Aerospace and Defense NDT Industry Revenue Share (%), by Country 2025 & 2033
- Figure 32: Middle East and Africa Aerospace and Defense NDT Industry Revenue (Million), by Type 2025 & 2033
- Figure 33: Middle East and Africa Aerospace and Defense NDT Industry Revenue Share (%), by Type 2025 & 2033
- Figure 34: Middle East and Africa Aerospace and Defense NDT Industry Revenue (Million), by Technology 2025 & 2033
- Figure 35: Middle East and Africa Aerospace and Defense NDT Industry Revenue Share (%), by Technology 2025 & 2033
- Figure 36: Middle East and Africa Aerospace and Defense NDT Industry Revenue (Million), by Country 2025 & 2033
- Figure 37: Middle East and Africa Aerospace and Defense NDT Industry Revenue Share (%), by Country 2025 & 2033
List of Tables
- Table 1: Global Aerospace and Defense NDT Industry Revenue Million Forecast, by Type 2020 & 2033
- Table 2: Global Aerospace and Defense NDT Industry Revenue Million Forecast, by Technology 2020 & 2033
- Table 3: Global Aerospace and Defense NDT Industry Revenue Million Forecast, by Region 2020 & 2033
- Table 4: Global Aerospace and Defense NDT Industry Revenue Million Forecast, by Type 2020 & 2033
- Table 5: Global Aerospace and Defense NDT Industry Revenue Million Forecast, by Technology 2020 & 2033
- Table 6: Global Aerospace and Defense NDT Industry Revenue Million Forecast, by Country 2020 & 2033
- Table 7: Global Aerospace and Defense NDT Industry Revenue Million Forecast, by Type 2020 & 2033
- Table 8: Global Aerospace and Defense NDT Industry Revenue Million Forecast, by Technology 2020 & 2033
- Table 9: Global Aerospace and Defense NDT Industry Revenue Million Forecast, by Country 2020 & 2033
- Table 10: Global Aerospace and Defense NDT Industry Revenue Million Forecast, by Type 2020 & 2033
- Table 11: Global Aerospace and Defense NDT Industry Revenue Million Forecast, by Technology 2020 & 2033
- Table 12: Global Aerospace and Defense NDT Industry Revenue Million Forecast, by Country 2020 & 2033
- Table 13: Global Aerospace and Defense NDT Industry Revenue Million Forecast, by Type 2020 & 2033
- Table 14: Global Aerospace and Defense NDT Industry Revenue Million Forecast, by Technology 2020 & 2033
- Table 15: Global Aerospace and Defense NDT Industry Revenue Million Forecast, by Country 2020 & 2033
- Table 16: Global Aerospace and Defense NDT Industry Revenue Million Forecast, by Type 2020 & 2033
- Table 17: Global Aerospace and Defense NDT Industry Revenue Million Forecast, by Technology 2020 & 2033
- Table 18: Global Aerospace and Defense NDT Industry Revenue Million Forecast, by Country 2020 & 2033
- Table 19: Global Aerospace and Defense NDT Industry Revenue Million Forecast, by Type 2020 & 2033
- Table 20: Global Aerospace and Defense NDT Industry Revenue Million Forecast, by Technology 2020 & 2033
- Table 21: Global Aerospace and Defense NDT Industry Revenue Million Forecast, by Country 2020 & 2033
Frequently Asked Questions
1. What is the projected Compound Annual Growth Rate (CAGR) of the Aerospace and Defense NDT Industry?
The projected CAGR is approximately 15.74%.
2. Which companies are prominent players in the Aerospace and Defense NDT Industry?
Key companies in the market include Fujifilm NDT Systems, Intertek Group PLC, Magnaflux Corporation, Yxlon International GmbH, Team Inc, SGS Group, TUV Rheinland Ag, NikonMetrology Inc, Mistras Group, Olympus Corporation, GE Measurement and Control, Applus Services S A, FLIR Systems Inc *List Not Exhaustive, Gould-Bass Co.
3. What are the main segments of the Aerospace and Defense NDT Industry?
The market segments include Type, Technology.
4. Can you provide details about the market size?
The market size is estimated to be USD 9.11 Million as of 2022.
5. What are some drivers contributing to market growth?
Increasing Investments in Aerospace & Defense; Increasing Complexity of Machine and Infrastructure.
6. What are the notable trends driving market growth?
Radiography Testing Technology to Account for the Largest Share.
7. Are there any restraints impacting market growth?
Lack Of Technical Workforce; Relative Lack of Awareness.
8. Can you provide examples of recent developments in the market?
March 2024 – Eddyfi Technologies, a player in the global non-destructive testing (NDT) solutions market, unveils TubePro 6, its advanced pre-inspection and reporting software. TubePro 6 is equipping organizations with advanced tools. These features promise unmatched insights and operational efficiency, particularly in heat exchanger inspections.
9. What pricing options are available for accessing the report?
Pricing options include single-user, multi-user, and enterprise licenses priced at USD 4750, USD 5250, and USD 8750 respectively.
10. Is the market size provided in terms of value or volume?
The market size is provided in terms of value, measured in Million.
11. Are there any specific market keywords associated with the report?
Yes, the market keyword associated with the report is "Aerospace and Defense NDT Industry," which aids in identifying and referencing the specific market segment covered.
12. How do I determine which pricing option suits my needs best?
The pricing options vary based on user requirements and access needs. Individual users may opt for single-user licenses, while businesses requiring broader access may choose multi-user or enterprise licenses for cost-effective access to the report.
13. Are there any additional resources or data provided in the Aerospace and Defense NDT Industry report?
While the report offers comprehensive insights, it's advisable to review the specific contents or supplementary materials provided to ascertain if additional resources or data are available.
14. How can I stay updated on further developments or reports in the Aerospace and Defense NDT Industry?
To stay informed about further developments, trends, and reports in the Aerospace and Defense NDT Industry, consider subscribing to industry newsletters, following relevant companies and organizations, or regularly checking reputable industry news sources and publications.
Methodology
Step 1 - Identification of Relevant Samples Size from Population Database


Step 2 - Approaches for Defining Global Market Size (Value, Volume* & Price*)

Note*: In applicable scenarios
Step 3 - Data Sources
Primary Research
- Web Analytics
- Survey Reports
- Research Institute
- Latest Research Reports
- Opinion Leaders
Secondary Research
- Annual Reports
- White Paper
- Latest Press Release
- Industry Association
- Paid Database
- Investor Presentations

Step 4 - Data Triangulation
Involves using different sources of information in order to increase the validity of a study
These sources are likely to be stakeholders in a program - participants, other researchers, program staff, other community members, and so on.
Then we put all data in single framework & apply various statistical tools to find out the dynamic on the market.
During the analysis stage, feedback from the stakeholder groups would be compared to determine areas of agreement as well as areas of divergence