

Key Insights
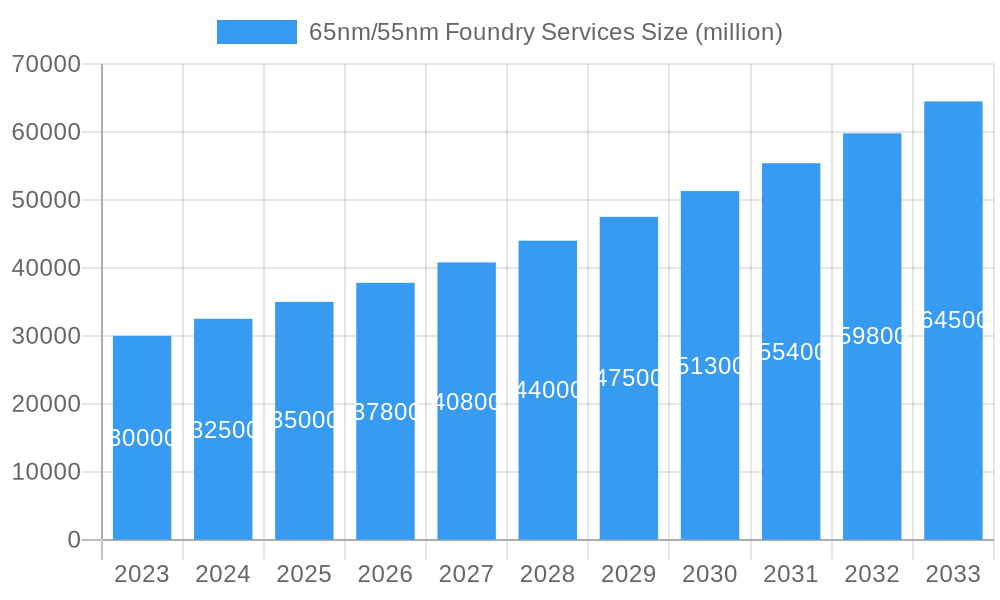
The global 65nm/55nm foundry services market is set for substantial growth, projected to reach $14.95 billion by 2025, with a CAGR of 15% through 2033. This expansion is driven by the persistent demand for cost-effective semiconductor manufacturing solutions. Key growth areas include the Internet of Things (IoT), microcontrollers (MCUs) in automotive and consumer electronics, advanced Display Driver Integrated Circuits (DDICs), and Image Sensors (CIS). These mature process nodes offer an optimal balance of performance, power efficiency, and cost for high-volume production.
65nm/55nm Foundry Services Market Size (In Billion)
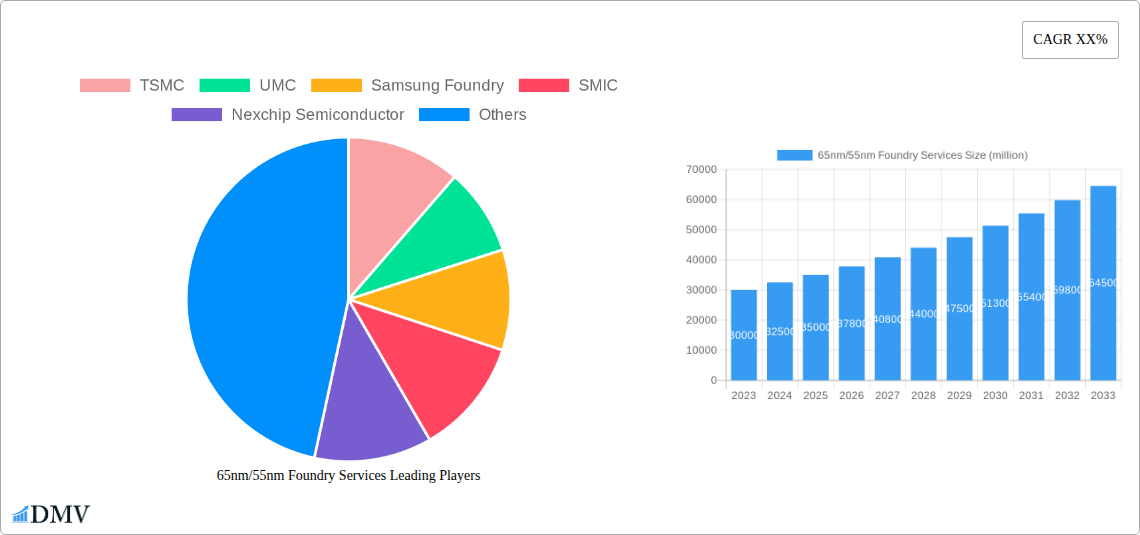
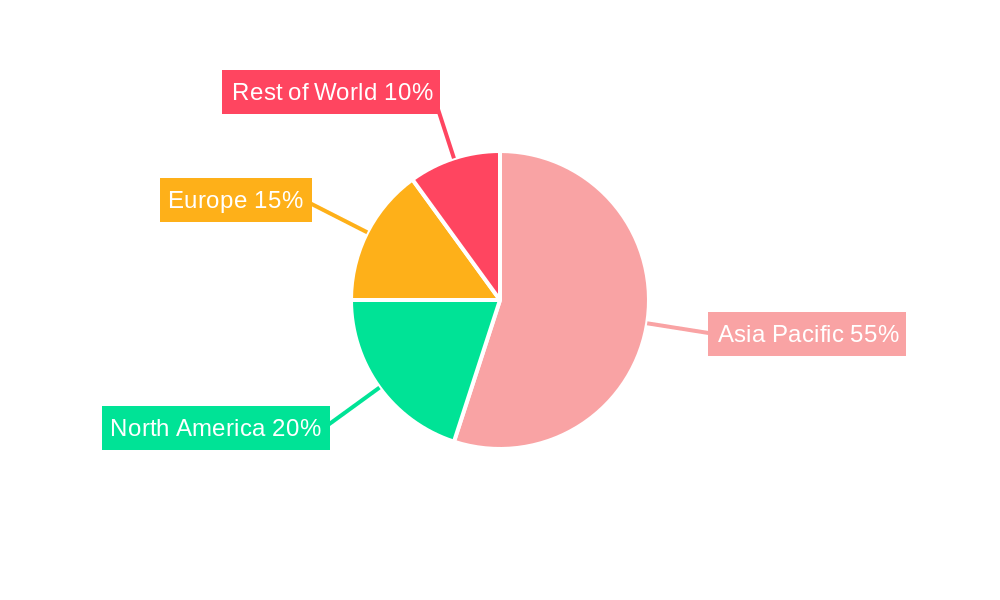
The competitive landscape features established foundries such as TSMC, UMC, Samsung Foundry, and SMIC, alongside emerging players investing in process optimization and capacity expansion. Specialized services for LED manufacturing and E-Tags are also gaining traction. While these nodes may not offer leading-edge performance for complex computations, their cost-effectiveness and reliability ensure their continued relevance. The Asia Pacific region, particularly China, dominates demand and manufacturing due to its robust electronics ecosystem and government support. North America and Europe remain significant markets, driven by specialized applications and R&D.
65nm/55nm Foundry Services Company Market Share
65nm/55nm Foundry Services Market Report
This comprehensive report delves into the dynamic landscape of 65nm and 55nm semiconductor foundry services, a critical segment powering a wide array of consumer electronics, industrial applications, and emerging technologies. Leveraging advanced foundry services expertise, this analysis offers deep insights into market trends, technological evolution, regional dominance, product innovation, growth drivers, obstacles, and future opportunities. With a study period spanning from 2019 to 2033, including a base year of 2025 and a forecast period from 2025 to 2033, this report equips stakeholders with the strategic intelligence needed to navigate this crucial semiconductor manufacturing sector.
65nm/55nm Foundry Services Market Composition & Trends
The 65nm/55nm foundry services market is characterized by a moderate to high level of concentration, with a few dominant players controlling significant market share. Key innovation catalysts include the relentless demand for cost-effective and power-efficient integrated circuits across various segments. Regulatory landscapes, particularly those concerning semiconductor supply chain security and export controls, play an increasingly influential role in shaping market dynamics and investment decisions. The existence of mature yet still relevant process nodes like 65nm and 55nm ensures a continuous demand, limiting the impact of direct substitute products for specific applications. End-user profiles are diverse, encompassing manufacturers of Display Driver ICs (DDIC), Complementary Metal-Oxide-Semiconductor Image Sensors (CIS), Light Emitting Diodes (LEDs), Electronic Tags (E-Tags), Microcontrollers (MCUs), and a broad spectrum of other electronic components. Merger and acquisition (M&A) activities, while not as frequent as in leading-edge nodes, are strategic, often aimed at consolidating capacity or acquiring specialized intellectual property. The overall market share distribution reflects the established presence of key foundries, with ongoing competition for wafer orders. Estimated M&A deal values are projected to reach in the range of $500 million to $1.5 billion over the forecast period, driven by strategic consolidation and capacity expansion initiatives.
65nm/55nm Foundry Services Industry Evolution
The 65nm/55nm foundry services industry has undergone a significant evolution, transitioning from its zenith to a mature yet indispensable segment of the global semiconductor manufacturing ecosystem. The historical period from 2019 to 2024 witnessed steady demand driven by the entrenched need for cost-optimized and reliable silicon for a multitude of applications. Growth trajectories during this phase were largely influenced by the sustained demand from the automotive, industrial, and consumer electronics sectors, where performance per watt and cost are paramount. Technological advancements, while not at the bleeding edge, focused on process refinement, yield improvement, and enabling new functionalities within these established nodes. For instance, advancements in gate dielectric materials and improved lithography techniques have allowed for enhanced performance and reduced leakage currents, extending the viability of these process technologies.
Shifting consumer demands, particularly the burgeoning requirement for smart devices, IoT applications, and advanced display technologies, have continued to fuel the need for 65nm and 55nm production. The base year of 2025 is projected to see a robust market, with estimated growth rates in the range of 5% to 7% year-over-year. Adoption metrics for these nodes remain high, particularly in segments where power consumption and thermal management are critical, and where the cost benefits of mature processes outweigh the marginal performance gains of more advanced nodes. The estimated market size for 65nm/55nm foundry services in 2025 is projected to be approximately $8.5 billion. The forecast period from 2025 to 2033 anticipates continued, albeit more moderate, growth, estimated at an average annual rate of 4% to 6%. This sustained demand is underpinned by the sheer volume of devices incorporating these process technologies. The ability of foundries to offer competitive pricing and consistent quality at these nodes remains a key factor in their continued relevance. Furthermore, ongoing research and development in areas such as advanced packaging and heterogeneous integration are enabling the deployment of 65nm/55nm chips in even more sophisticated applications, effectively extending their lifecycle and market penetration.
Leading Regions, Countries, or Segments in 65nm/55nm Foundry Services
The dominance in the 65nm/55nm foundry services market is largely dictated by geographical manufacturing concentration and the overwhelming demand from specific application segments. Asia, particularly Mainland China and Taiwan, stands as the leading region, driven by substantial government support, a well-established semiconductor manufacturing infrastructure, and the presence of major foundry players. Within this region, countries like Taiwan, with its pioneering foundries, and China, with its rapidly expanding indigenous capabilities, are at the forefront.
The Application: DDIC (Display Driver IC) segment represents a particularly strong area of dominance for 65nm/55nm foundry services. The continuous evolution of display technologies across smartphones, tablets, televisions, and automotive dashboards necessitates a high volume of cost-effective and power-efficient DDICs, making these process nodes ideal.
- Investment Trends: Significant investments in expanding wafer fabrication capacity for mature nodes continue in China and other Asian nations, fueled by national semiconductor strategies aimed at self-sufficiency and global market competitiveness. Estimated investments in new fabs for these process nodes are in the range of $2 billion to $5 billion annually.
- Regulatory Support: Favorable government policies, including tax incentives and subsidies, are crucial in attracting and retaining foundry business within these leading regions. These policies are designed to bolster domestic supply chains and foster innovation.
Beyond DDIC, the Application: CIS (Complementary Metal-Oxide-Semiconductor Image Sensors) also exhibits substantial reliance on 65nm/55nm processes. While higher resolution and advanced imaging features might leverage more advanced nodes, the vast majority of image sensors for consumer-grade cameras, security systems, and automotive applications continue to be manufactured on these mature processes due to their balance of performance, power consumption, and cost. The demand for LED drivers, essential for LED lighting and backlighting, further solidifies the position of these nodes.
- Technological Specialization: Foundries in leading regions have developed deep expertise in optimizing 65nm and 55nm processes for specific applications, offering tailored solutions that meet stringent performance and reliability requirements.
- Supply Chain Integration: The close proximity of foundries to downstream assembly and testing facilities, as well as to major consumer electronics manufacturers, creates a highly efficient and responsive supply chain, further reinforcing regional dominance.
The Type: 65nm process node, due to its established maturity and broad applicability, continues to command a significant portion of the market share. However, the Type: 55nm is gaining traction as it offers a slight improvement in performance and power efficiency while maintaining cost-effectiveness, making it an attractive option for next-generation designs within these application segments. The estimated total wafer starts for 65nm/55nm foundry services in 2025 are projected to be around 30 million wafers.
65nm/55nm Foundry Services Product Innovations
Product innovations within 65nm/55nm foundry services are focused on enhancing existing capabilities and enabling specific application demands rather than radical architectural shifts. Foundries are actively developing improved process flows for reduced leakage current, enabling lower power consumption in devices like E-Tags and MCUs. Innovations in analog and mixed-signal integration are crucial for applications like CIS and DDIC, allowing for higher levels of functionality on a single chip. Performance metrics are being optimized through finer control of doping profiles and advanced lithographic techniques, leading to improved signal-to-noise ratios for sensors and faster response times for display drivers. Unique selling propositions often lie in the foundry's ability to achieve high yields for complex designs, offer robust intellectual property (IP) libraries tailored for these nodes, and provide reliable long-term supply assurance, making them attractive for industries with extended product life cycles. The estimated percentage of revenue generated from enhanced performance features within these nodes is approximately 15%.
Propelling Factors for 65nm/55nm Foundry Services Growth
Several key growth drivers are propelling the 65nm/55nm foundry services market. The persistent and growing demand for cost-effective integrated circuits in high-volume consumer electronics remains a primary catalyst. This includes applications like smart home devices, wearables, and automotive electronics, where economies of scale are paramount. Technologically, advancements in packaging technologies, such as System-in-Package (SiP) and wafer-level packaging, allow for the integration of 65nm/55nm chips alongside more advanced components, extending their relevance. Economic factors, including the inherent cost advantage of these mature nodes compared to leading-edge processes, continue to make them the go-to choice for many applications. Furthermore, regulatory initiatives aimed at bolstering domestic semiconductor supply chains in various regions are driving increased investment in mature node manufacturing capacity. The estimated global market for mature node foundry services, including 65nm/55nm, is projected to reach $25 billion by 2028.
Obstacles in the 65nm/55nm Foundry Services Market
Despite its resilience, the 65nm/55nm foundry services market faces several obstacles. Regulatory challenges, particularly those related to geopolitical tensions and trade restrictions, can disrupt supply chains and impact international collaboration. The increasing complexity of lithographic processes, even at mature nodes, can lead to higher manufacturing costs and longer lead times if not managed efficiently. Competitive pressures from newer, more advanced nodes, while not directly replacing 65nm/55nm in all applications, exert a continuous push for innovation and efficiency. Furthermore, the potential for supply chain disruptions due to unforeseen events, such as natural disasters or pandemics, remains a persistent concern. For instance, a significant supply chain disruption could lead to an estimated price increase of 10% to 20% for available wafer capacity.
Future Opportunities in 65nm/55nm Foundry Services
Emerging opportunities in the 65nm/55nm foundry services market lie in catering to the burgeoning Internet of Things (IoT) sector, where massive deployment of sensors, microcontrollers, and connectivity chips requires cost-effective and power-efficient solutions. The continued growth of the automotive industry, particularly in areas like advanced driver-assistance systems (ADAS) and in-car infotainment, will sustain demand for robust and reliable chips manufactured on these nodes. Furthermore, the development of specialized foundry offerings for niche markets, such as medical devices and industrial automation, presents significant potential. Advances in AI-driven chip design and optimization are also poised to unlock new possibilities for leveraging these mature process technologies. The projected CAGR for the IoT semiconductor market is 15%, indicating substantial future demand.
Major Players in the 65nm/55nm Foundry Services Ecosystem
- TSMC
- UMC
- Samsung Foundry
- SMIC
- Nexchip Semiconductor
- Hua Hong Semiconductor
- Vanguard International Semiconductor
- DB Hitek
- CR Micro
Key Developments in 65nm/55nm Foundry Services Industry
- 2023: SMIC announces plans for expanded capacity in mature nodes to meet growing domestic demand.
- 2023: UMC reports strong demand for its 65nm and 55nm offerings, particularly from the automotive sector.
- 2024: Hua Hong Semiconductor invests in new equipment to enhance its 55nm process capabilities.
- 2024: TSMC continues to optimize its mature node offerings, focusing on yield improvements and cost reduction.
- 2025: Nexchip Semiconductor aims to increase its market share in DDIC manufacturing using 65nm and 55nm processes.
- 2025: Vanguard International Semiconductor (VIS) focuses on expanding its capacity for industrial and automotive applications.
- 2025: DB Hitek announces new product development for CIS sensors on its 55nm platform.
- 2026: CR Micro plans strategic upgrades to its 65nm fabrication lines.
Strategic 65nm/55nm Foundry Services Market Forecast
The strategic outlook for 65nm/55nm foundry services remains positive, driven by ongoing demand from high-volume applications and the inherent cost advantages of these mature process nodes. Future growth will be fueled by the expanding IoT ecosystem, the continuous evolution of automotive electronics, and the strategic initiatives of governments to strengthen domestic semiconductor supply chains. Foundries that can offer consistent quality, competitive pricing, and reliable long-term supply will be well-positioned to capitalize on these opportunities. The estimated market potential for 65nm/55nm foundry services by 2033 is projected to exceed $12 billion. The emphasis on specialized IP development and advanced packaging integration will further enhance the value proposition of these services, ensuring their continued relevance in the global semiconductor industry.
65nm/55nm Foundry Services Segmentation
-
1. Application
- 1.1. DDIC
- 1.2. CIS
- 1.3. LED
- 1.4. E-Tag
- 1.5. MCU
- 1.6. Others
-
2. Types
- 2.1. 65nm
- 2.2. 55nm
65nm/55nm Foundry Services Segmentation By Geography
-
1. North America
- 1.1. United States
- 1.2. Canada
- 1.3. Mexico
-
2. South America
- 2.1. Brazil
- 2.2. Argentina
- 2.3. Rest of South America
-
3. Europe
- 3.1. United Kingdom
- 3.2. Germany
- 3.3. France
- 3.4. Italy
- 3.5. Spain
- 3.6. Russia
- 3.7. Benelux
- 3.8. Nordics
- 3.9. Rest of Europe
-
4. Middle East & Africa
- 4.1. Turkey
- 4.2. Israel
- 4.3. GCC
- 4.4. North Africa
- 4.5. South Africa
- 4.6. Rest of Middle East & Africa
-
5. Asia Pacific
- 5.1. China
- 5.2. India
- 5.3. Japan
- 5.4. South Korea
- 5.5. ASEAN
- 5.6. Oceania
- 5.7. Rest of Asia Pacific
65nm/55nm Foundry Services Regional Market Share
Geographic Coverage of 65nm/55nm Foundry Services
65nm/55nm Foundry Services REPORT HIGHLIGHTS
| Aspects | Details |
|---|---|
| Study Period | 2020-2034 |
| Base Year | 2025 |
| Estimated Year | 2026 |
| Forecast Period | 2026-2034 |
| Historical Period | 2020-2025 |
| Growth Rate | CAGR of 15% from 2020-2034 |
| Segmentation |
|
Table of Contents
- 1. Introduction
- 1.1. Research Scope
- 1.2. Market Segmentation
- 1.3. Research Methodology
- 1.4. Definitions and Assumptions
- 2. Executive Summary
- 2.1. Introduction
- 3. Market Dynamics
- 3.1. Introduction
- 3.2. Market Drivers
- 3.3. Market Restrains
- 3.4. Market Trends
- 4. Market Factor Analysis
- 4.1. Porters Five Forces
- 4.2. Supply/Value Chain
- 4.3. PESTEL analysis
- 4.4. Market Entropy
- 4.5. Patent/Trademark Analysis
- 5. Global 65nm/55nm Foundry Services Analysis, Insights and Forecast, 2020-2032
- 5.1. Market Analysis, Insights and Forecast - by Application
- 5.1.1. DDIC
- 5.1.2. CIS
- 5.1.3. LED
- 5.1.4. E-Tag
- 5.1.5. MCU
- 5.1.6. Others
- 5.2. Market Analysis, Insights and Forecast - by Types
- 5.2.1. 65nm
- 5.2.2. 55nm
- 5.3. Market Analysis, Insights and Forecast - by Region
- 5.3.1. North America
- 5.3.2. South America
- 5.3.3. Europe
- 5.3.4. Middle East & Africa
- 5.3.5. Asia Pacific
- 5.1. Market Analysis, Insights and Forecast - by Application
- 6. North America 65nm/55nm Foundry Services Analysis, Insights and Forecast, 2020-2032
- 6.1. Market Analysis, Insights and Forecast - by Application
- 6.1.1. DDIC
- 6.1.2. CIS
- 6.1.3. LED
- 6.1.4. E-Tag
- 6.1.5. MCU
- 6.1.6. Others
- 6.2. Market Analysis, Insights and Forecast - by Types
- 6.2.1. 65nm
- 6.2.2. 55nm
- 6.1. Market Analysis, Insights and Forecast - by Application
- 7. South America 65nm/55nm Foundry Services Analysis, Insights and Forecast, 2020-2032
- 7.1. Market Analysis, Insights and Forecast - by Application
- 7.1.1. DDIC
- 7.1.2. CIS
- 7.1.3. LED
- 7.1.4. E-Tag
- 7.1.5. MCU
- 7.1.6. Others
- 7.2. Market Analysis, Insights and Forecast - by Types
- 7.2.1. 65nm
- 7.2.2. 55nm
- 7.1. Market Analysis, Insights and Forecast - by Application
- 8. Europe 65nm/55nm Foundry Services Analysis, Insights and Forecast, 2020-2032
- 8.1. Market Analysis, Insights and Forecast - by Application
- 8.1.1. DDIC
- 8.1.2. CIS
- 8.1.3. LED
- 8.1.4. E-Tag
- 8.1.5. MCU
- 8.1.6. Others
- 8.2. Market Analysis, Insights and Forecast - by Types
- 8.2.1. 65nm
- 8.2.2. 55nm
- 8.1. Market Analysis, Insights and Forecast - by Application
- 9. Middle East & Africa 65nm/55nm Foundry Services Analysis, Insights and Forecast, 2020-2032
- 9.1. Market Analysis, Insights and Forecast - by Application
- 9.1.1. DDIC
- 9.1.2. CIS
- 9.1.3. LED
- 9.1.4. E-Tag
- 9.1.5. MCU
- 9.1.6. Others
- 9.2. Market Analysis, Insights and Forecast - by Types
- 9.2.1. 65nm
- 9.2.2. 55nm
- 9.1. Market Analysis, Insights and Forecast - by Application
- 10. Asia Pacific 65nm/55nm Foundry Services Analysis, Insights and Forecast, 2020-2032
- 10.1. Market Analysis, Insights and Forecast - by Application
- 10.1.1. DDIC
- 10.1.2. CIS
- 10.1.3. LED
- 10.1.4. E-Tag
- 10.1.5. MCU
- 10.1.6. Others
- 10.2. Market Analysis, Insights and Forecast - by Types
- 10.2.1. 65nm
- 10.2.2. 55nm
- 10.1. Market Analysis, Insights and Forecast - by Application
- 11. Competitive Analysis
- 11.1. Global Market Share Analysis 2025
- 11.2. Company Profiles
- 11.2.1 TSMC
- 11.2.1.1. Overview
- 11.2.1.2. Products
- 11.2.1.3. SWOT Analysis
- 11.2.1.4. Recent Developments
- 11.2.1.5. Financials (Based on Availability)
- 11.2.2 UMC
- 11.2.2.1. Overview
- 11.2.2.2. Products
- 11.2.2.3. SWOT Analysis
- 11.2.2.4. Recent Developments
- 11.2.2.5. Financials (Based on Availability)
- 11.2.3 Samsung Foundry
- 11.2.3.1. Overview
- 11.2.3.2. Products
- 11.2.3.3. SWOT Analysis
- 11.2.3.4. Recent Developments
- 11.2.3.5. Financials (Based on Availability)
- 11.2.4 SMIC
- 11.2.4.1. Overview
- 11.2.4.2. Products
- 11.2.4.3. SWOT Analysis
- 11.2.4.4. Recent Developments
- 11.2.4.5. Financials (Based on Availability)
- 11.2.5 Nexchip Semiconductor
- 11.2.5.1. Overview
- 11.2.5.2. Products
- 11.2.5.3. SWOT Analysis
- 11.2.5.4. Recent Developments
- 11.2.5.5. Financials (Based on Availability)
- 11.2.6 Hua Hong Semiconductor
- 11.2.6.1. Overview
- 11.2.6.2. Products
- 11.2.6.3. SWOT Analysis
- 11.2.6.4. Recent Developments
- 11.2.6.5. Financials (Based on Availability)
- 11.2.7 Vanguard International Semiconductor
- 11.2.7.1. Overview
- 11.2.7.2. Products
- 11.2.7.3. SWOT Analysis
- 11.2.7.4. Recent Developments
- 11.2.7.5. Financials (Based on Availability)
- 11.2.8 DB Hitek
- 11.2.8.1. Overview
- 11.2.8.2. Products
- 11.2.8.3. SWOT Analysis
- 11.2.8.4. Recent Developments
- 11.2.8.5. Financials (Based on Availability)
- 11.2.9 CR Micro
- 11.2.9.1. Overview
- 11.2.9.2. Products
- 11.2.9.3. SWOT Analysis
- 11.2.9.4. Recent Developments
- 11.2.9.5. Financials (Based on Availability)
- 11.2.1 TSMC
List of Figures
- Figure 1: Global 65nm/55nm Foundry Services Revenue Breakdown (billion, %) by Region 2025 & 2033
- Figure 2: North America 65nm/55nm Foundry Services Revenue (billion), by Application 2025 & 2033
- Figure 3: North America 65nm/55nm Foundry Services Revenue Share (%), by Application 2025 & 2033
- Figure 4: North America 65nm/55nm Foundry Services Revenue (billion), by Types 2025 & 2033
- Figure 5: North America 65nm/55nm Foundry Services Revenue Share (%), by Types 2025 & 2033
- Figure 6: North America 65nm/55nm Foundry Services Revenue (billion), by Country 2025 & 2033
- Figure 7: North America 65nm/55nm Foundry Services Revenue Share (%), by Country 2025 & 2033
- Figure 8: South America 65nm/55nm Foundry Services Revenue (billion), by Application 2025 & 2033
- Figure 9: South America 65nm/55nm Foundry Services Revenue Share (%), by Application 2025 & 2033
- Figure 10: South America 65nm/55nm Foundry Services Revenue (billion), by Types 2025 & 2033
- Figure 11: South America 65nm/55nm Foundry Services Revenue Share (%), by Types 2025 & 2033
- Figure 12: South America 65nm/55nm Foundry Services Revenue (billion), by Country 2025 & 2033
- Figure 13: South America 65nm/55nm Foundry Services Revenue Share (%), by Country 2025 & 2033
- Figure 14: Europe 65nm/55nm Foundry Services Revenue (billion), by Application 2025 & 2033
- Figure 15: Europe 65nm/55nm Foundry Services Revenue Share (%), by Application 2025 & 2033
- Figure 16: Europe 65nm/55nm Foundry Services Revenue (billion), by Types 2025 & 2033
- Figure 17: Europe 65nm/55nm Foundry Services Revenue Share (%), by Types 2025 & 2033
- Figure 18: Europe 65nm/55nm Foundry Services Revenue (billion), by Country 2025 & 2033
- Figure 19: Europe 65nm/55nm Foundry Services Revenue Share (%), by Country 2025 & 2033
- Figure 20: Middle East & Africa 65nm/55nm Foundry Services Revenue (billion), by Application 2025 & 2033
- Figure 21: Middle East & Africa 65nm/55nm Foundry Services Revenue Share (%), by Application 2025 & 2033
- Figure 22: Middle East & Africa 65nm/55nm Foundry Services Revenue (billion), by Types 2025 & 2033
- Figure 23: Middle East & Africa 65nm/55nm Foundry Services Revenue Share (%), by Types 2025 & 2033
- Figure 24: Middle East & Africa 65nm/55nm Foundry Services Revenue (billion), by Country 2025 & 2033
- Figure 25: Middle East & Africa 65nm/55nm Foundry Services Revenue Share (%), by Country 2025 & 2033
- Figure 26: Asia Pacific 65nm/55nm Foundry Services Revenue (billion), by Application 2025 & 2033
- Figure 27: Asia Pacific 65nm/55nm Foundry Services Revenue Share (%), by Application 2025 & 2033
- Figure 28: Asia Pacific 65nm/55nm Foundry Services Revenue (billion), by Types 2025 & 2033
- Figure 29: Asia Pacific 65nm/55nm Foundry Services Revenue Share (%), by Types 2025 & 2033
- Figure 30: Asia Pacific 65nm/55nm Foundry Services Revenue (billion), by Country 2025 & 2033
- Figure 31: Asia Pacific 65nm/55nm Foundry Services Revenue Share (%), by Country 2025 & 2033
List of Tables
- Table 1: Global 65nm/55nm Foundry Services Revenue billion Forecast, by Application 2020 & 2033
- Table 2: Global 65nm/55nm Foundry Services Revenue billion Forecast, by Types 2020 & 2033
- Table 3: Global 65nm/55nm Foundry Services Revenue billion Forecast, by Region 2020 & 2033
- Table 4: Global 65nm/55nm Foundry Services Revenue billion Forecast, by Application 2020 & 2033
- Table 5: Global 65nm/55nm Foundry Services Revenue billion Forecast, by Types 2020 & 2033
- Table 6: Global 65nm/55nm Foundry Services Revenue billion Forecast, by Country 2020 & 2033
- Table 7: United States 65nm/55nm Foundry Services Revenue (billion) Forecast, by Application 2020 & 2033
- Table 8: Canada 65nm/55nm Foundry Services Revenue (billion) Forecast, by Application 2020 & 2033
- Table 9: Mexico 65nm/55nm Foundry Services Revenue (billion) Forecast, by Application 2020 & 2033
- Table 10: Global 65nm/55nm Foundry Services Revenue billion Forecast, by Application 2020 & 2033
- Table 11: Global 65nm/55nm Foundry Services Revenue billion Forecast, by Types 2020 & 2033
- Table 12: Global 65nm/55nm Foundry Services Revenue billion Forecast, by Country 2020 & 2033
- Table 13: Brazil 65nm/55nm Foundry Services Revenue (billion) Forecast, by Application 2020 & 2033
- Table 14: Argentina 65nm/55nm Foundry Services Revenue (billion) Forecast, by Application 2020 & 2033
- Table 15: Rest of South America 65nm/55nm Foundry Services Revenue (billion) Forecast, by Application 2020 & 2033
- Table 16: Global 65nm/55nm Foundry Services Revenue billion Forecast, by Application 2020 & 2033
- Table 17: Global 65nm/55nm Foundry Services Revenue billion Forecast, by Types 2020 & 2033
- Table 18: Global 65nm/55nm Foundry Services Revenue billion Forecast, by Country 2020 & 2033
- Table 19: United Kingdom 65nm/55nm Foundry Services Revenue (billion) Forecast, by Application 2020 & 2033
- Table 20: Germany 65nm/55nm Foundry Services Revenue (billion) Forecast, by Application 2020 & 2033
- Table 21: France 65nm/55nm Foundry Services Revenue (billion) Forecast, by Application 2020 & 2033
- Table 22: Italy 65nm/55nm Foundry Services Revenue (billion) Forecast, by Application 2020 & 2033
- Table 23: Spain 65nm/55nm Foundry Services Revenue (billion) Forecast, by Application 2020 & 2033
- Table 24: Russia 65nm/55nm Foundry Services Revenue (billion) Forecast, by Application 2020 & 2033
- Table 25: Benelux 65nm/55nm Foundry Services Revenue (billion) Forecast, by Application 2020 & 2033
- Table 26: Nordics 65nm/55nm Foundry Services Revenue (billion) Forecast, by Application 2020 & 2033
- Table 27: Rest of Europe 65nm/55nm Foundry Services Revenue (billion) Forecast, by Application 2020 & 2033
- Table 28: Global 65nm/55nm Foundry Services Revenue billion Forecast, by Application 2020 & 2033
- Table 29: Global 65nm/55nm Foundry Services Revenue billion Forecast, by Types 2020 & 2033
- Table 30: Global 65nm/55nm Foundry Services Revenue billion Forecast, by Country 2020 & 2033
- Table 31: Turkey 65nm/55nm Foundry Services Revenue (billion) Forecast, by Application 2020 & 2033
- Table 32: Israel 65nm/55nm Foundry Services Revenue (billion) Forecast, by Application 2020 & 2033
- Table 33: GCC 65nm/55nm Foundry Services Revenue (billion) Forecast, by Application 2020 & 2033
- Table 34: North Africa 65nm/55nm Foundry Services Revenue (billion) Forecast, by Application 2020 & 2033
- Table 35: South Africa 65nm/55nm Foundry Services Revenue (billion) Forecast, by Application 2020 & 2033
- Table 36: Rest of Middle East & Africa 65nm/55nm Foundry Services Revenue (billion) Forecast, by Application 2020 & 2033
- Table 37: Global 65nm/55nm Foundry Services Revenue billion Forecast, by Application 2020 & 2033
- Table 38: Global 65nm/55nm Foundry Services Revenue billion Forecast, by Types 2020 & 2033
- Table 39: Global 65nm/55nm Foundry Services Revenue billion Forecast, by Country 2020 & 2033
- Table 40: China 65nm/55nm Foundry Services Revenue (billion) Forecast, by Application 2020 & 2033
- Table 41: India 65nm/55nm Foundry Services Revenue (billion) Forecast, by Application 2020 & 2033
- Table 42: Japan 65nm/55nm Foundry Services Revenue (billion) Forecast, by Application 2020 & 2033
- Table 43: South Korea 65nm/55nm Foundry Services Revenue (billion) Forecast, by Application 2020 & 2033
- Table 44: ASEAN 65nm/55nm Foundry Services Revenue (billion) Forecast, by Application 2020 & 2033
- Table 45: Oceania 65nm/55nm Foundry Services Revenue (billion) Forecast, by Application 2020 & 2033
- Table 46: Rest of Asia Pacific 65nm/55nm Foundry Services Revenue (billion) Forecast, by Application 2020 & 2033
Frequently Asked Questions
1. What is the projected Compound Annual Growth Rate (CAGR) of the 65nm/55nm Foundry Services?
The projected CAGR is approximately 15%.
2. Which companies are prominent players in the 65nm/55nm Foundry Services?
Key companies in the market include TSMC, UMC, Samsung Foundry, SMIC, Nexchip Semiconductor, Hua Hong Semiconductor, Vanguard International Semiconductor, DB Hitek, CR Micro.
3. What are the main segments of the 65nm/55nm Foundry Services?
The market segments include Application, Types.
4. Can you provide details about the market size?
The market size is estimated to be USD 14.95 billion as of 2022.
5. What are some drivers contributing to market growth?
N/A
6. What are the notable trends driving market growth?
N/A
7. Are there any restraints impacting market growth?
N/A
8. Can you provide examples of recent developments in the market?
N/A
9. What pricing options are available for accessing the report?
Pricing options include single-user, multi-user, and enterprise licenses priced at USD 2900.00, USD 4350.00, and USD 5800.00 respectively.
10. Is the market size provided in terms of value or volume?
The market size is provided in terms of value, measured in billion.
11. Are there any specific market keywords associated with the report?
Yes, the market keyword associated with the report is "65nm/55nm Foundry Services," which aids in identifying and referencing the specific market segment covered.
12. How do I determine which pricing option suits my needs best?
The pricing options vary based on user requirements and access needs. Individual users may opt for single-user licenses, while businesses requiring broader access may choose multi-user or enterprise licenses for cost-effective access to the report.
13. Are there any additional resources or data provided in the 65nm/55nm Foundry Services report?
While the report offers comprehensive insights, it's advisable to review the specific contents or supplementary materials provided to ascertain if additional resources or data are available.
14. How can I stay updated on further developments or reports in the 65nm/55nm Foundry Services?
To stay informed about further developments, trends, and reports in the 65nm/55nm Foundry Services, consider subscribing to industry newsletters, following relevant companies and organizations, or regularly checking reputable industry news sources and publications.
Methodology
Step 1 - Identification of Relevant Samples Size from Population Database


Step 2 - Approaches for Defining Global Market Size (Value, Volume* & Price*)

Note*: In applicable scenarios
Step 3 - Data Sources
Primary Research
- Web Analytics
- Survey Reports
- Research Institute
- Latest Research Reports
- Opinion Leaders
Secondary Research
- Annual Reports
- White Paper
- Latest Press Release
- Industry Association
- Paid Database
- Investor Presentations

Step 4 - Data Triangulation
Involves using different sources of information in order to increase the validity of a study
These sources are likely to be stakeholders in a program - participants, other researchers, program staff, other community members, and so on.
Then we put all data in single framework & apply various statistical tools to find out the dynamic on the market.
During the analysis stage, feedback from the stakeholder groups would be compared to determine areas of agreement as well as areas of divergence