

Key Insights
The 3D Interactive Projector market is poised for significant expansion, projecting a market size of approximately USD 1.2 billion in 2024, with an impressive Compound Annual Growth Rate (CAGR) of 9.7%. This robust growth is primarily fueled by the increasing adoption of immersive technologies in educational settings for enhanced learning experiences, the growing demand for dynamic and engaging presentations in the corporate sector, and the evolving needs of government institutions for advanced visualization and training solutions. The integration of 3D interactivity is transforming traditional projection methods, making them more collaborative and engaging, thereby driving adoption across various verticals. Key trends shaping this market include the development of higher resolution and brighter projectors, advancements in multi-touch capabilities, and the increasing affordability of these sophisticated devices.
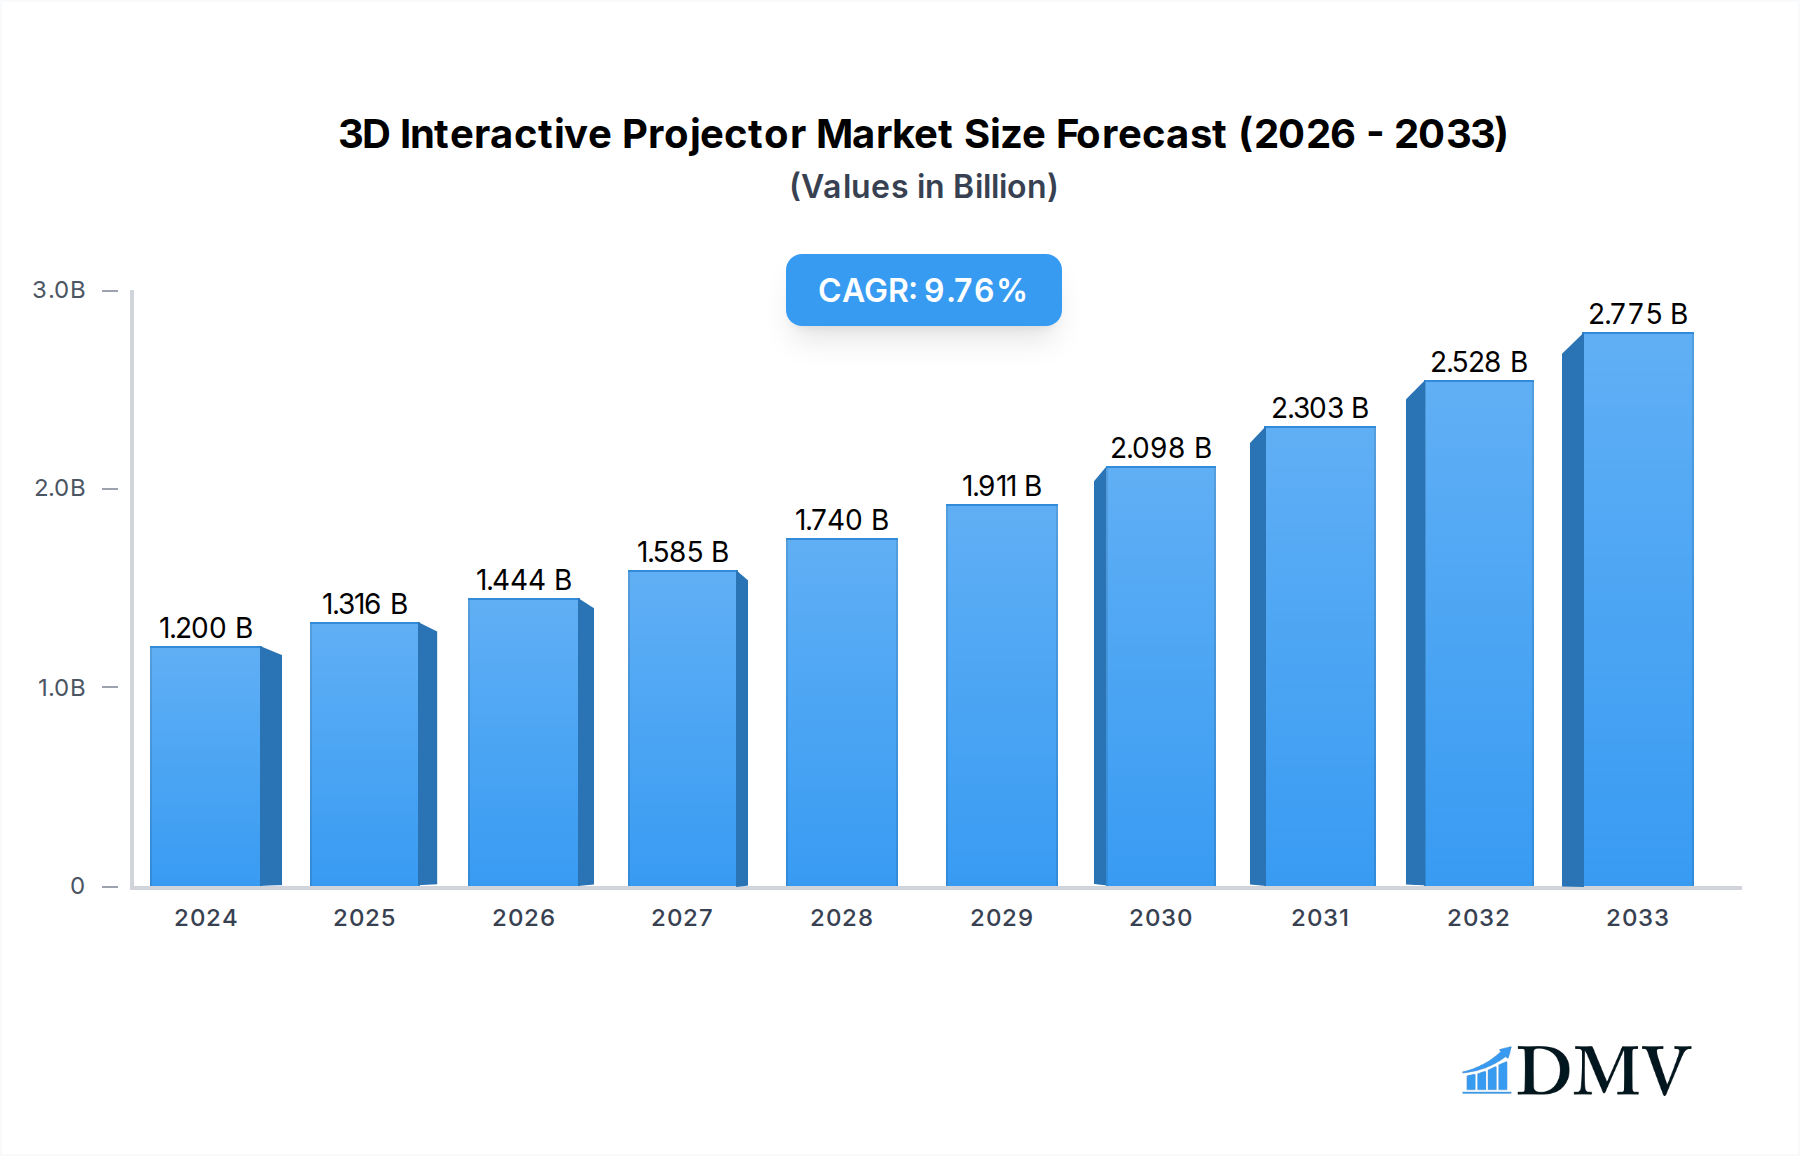
3D Interactive Projector Market Size (In Billion)
Despite its promising trajectory, the market faces certain restraints, such as the high initial cost of some advanced 3D interactive projectors and the ongoing need for compatible 3D content creation and infrastructure. However, these challenges are progressively being overcome by technological innovations and wider content availability. The market is segmented by application into Education, Corporate, and Government, with each segment exhibiting unique growth drivers and adoption rates. In terms of technology, DLP, LCD, and LCoS are the primary types, with continuous innovation in each to improve performance and cost-effectiveness. Leading companies like Seiko Epson Corp., BenQ Corp., and Mimio Boxlight are at the forefront, driving innovation and market penetration across key regions like North America, Europe, and Asia Pacific, with emerging economies in Asia Pacific showing substantial future growth potential.

3D Interactive Projector Company Market Share
3D Interactive Projector Market Composition & Trends Report Description
This comprehensive report offers an in-depth analysis of the 3D interactive projector market, dissecting its core composition and evolving trends from the historical period of 2019–2024, through the base and estimated year of 2025, and projecting forward to 2033. With a study period spanning 2019–2033, this research provides a robust understanding of the interactive projector technology landscape. We meticulously evaluate market concentration, identifying key players and their competitive positioning. Innovation catalysts, such as advancements in 3D projection technology and AI integration, are highlighted as critical drivers. The report also scrutinizes the regulatory landscapes impacting the adoption of interactive whiteboard projectors and the presence of substitute products, alongside detailed end-user profiles across education projectors, corporate projectors, and government projectors. Furthermore, we analyze Mergers & Acquisitions (M&A) activities, including the reported deal values in billions, offering insights into market consolidation. The market share distribution is presented with precision, with the total market size projected to reach xx billion by 2033.
- Market Share Distribution: Detailed breakdown of market share by company and segment.
- M&A Deal Values: Analysis of significant M&A transactions in billions, reflecting market consolidation trends.
- Innovation Catalysts: Examination of R&D investments and emerging technologies driving market growth.
- Regulatory Impact: Assessment of government policies and standards affecting smart projector deployment.
- Substitute Product Analysis: Evaluation of alternative display technologies and their competitive threat.
3D Interactive Projector Industry Evolution Report Description
This section delves into the dynamic 3D interactive projector industry evolution, charting its market growth trajectories and technological advancements from 2019 to 2033. We meticulously analyze the shifting consumer demands and their impact on the 3D display projector market. With a focus on the forecast period of 2025–2033, this analysis reveals the compound annual growth rate (CAGR) of xx%, with the market size projected to ascend to xx billion by 2033. Key technological breakthroughs, including enhancements in laser projector technology and the integration of touch functionality, are explored in detail. The report provides specific data points on adoption metrics for interactive projectors for classrooms and conference room projectors, showcasing the increasing penetration of these innovative solutions. The historical period of 2019–2024 provides a foundational understanding of past performance and market shifts, enabling a well-informed projection of future industry dynamics.
Leading Regions, Countries, or Segments in 3D Interactive Projector Report Description
This section highlights the dominant regions, countries, and segments within the global 3D interactive projector market. Analyzing applications across education, corporate, and government sectors, and types including DLP, LCD, and LCoS projectors, this part provides granular insights into market leadership. In the education segment, North America is identified as the leading region, driven by substantial government investments in educational technology and the widespread adoption of interactive projectors for smart classrooms. The projected market size for education applications is xx billion by 2033. In the corporate realm, Asia Pacific emerges as a significant growth hub, fueled by rapid digitalization and the increasing demand for collaborative meeting room solutions. Key drivers include aggressive investment trends in AI-powered interactive projectors and favorable regulatory support for technological upgrades. The government sector witnesses steady growth, particularly in Europe, with a focus on enhancing public service delivery through interactive display solutions.
- Dominant Application Segment: Education, characterized by a projected market size of xx billion by 2033, driven by initiatives for digital learning.
- Leading Region (Education): North America, due to substantial government funding and high adoption rates of smart projectors for schools.
- Key Driver (Corporate): The growing demand for enhanced collaboration and presentation tools in enterprises.
- Emerging Technology Adoption: The increasing preference for 4K interactive projectors and short-throw interactive projectors across all segments.
- Regulatory Support: Government initiatives promoting technology integration in public institutions.
3D Interactive Projector Product Innovations Report Description
This report details the cutting-edge product innovations within the 3D interactive projector market. We explore advancements in interactive projection technology, focusing on enhanced touch sensitivity, improved resolution up to xxK, and seamless integration with digital platforms. Applications range from immersive educational experiences with interactive whiteboards for schools to dynamic business presentations and engaging public displays. Performance metrics such as brightness levels reaching xx lumens, contrast ratios of xx:1, and extended lamp life exceeding xx,000 hours are highlighted. Unique selling propositions include the development of ultra-short-throw interactive projectors that minimize shadows and enable larger screen sizes in confined spaces. Technological advancements in AI-powered features for content recognition and user interaction are also discussed, positioning these interactive displays as transformative tools for various sectors. The projected market value for innovative products is estimated at xx billion by 2033.
Propelling Factors for 3D Interactive Projector Growth Report Description
Several key factors are propelling the substantial growth of the 3D interactive projector market. Technological advancements, including the miniaturization of components, increased processing power, and enhanced 3D projection capabilities, are making these devices more accessible and versatile. Economic influences, such as the increasing IT spending by corporations and educational institutions seeking to improve engagement and productivity, are significant drivers. Regulatory support, with governments worldwide promoting digital transformation in education and public services, further fuels adoption. For instance, the xx billion allocated for digital education infrastructure in the United States underscores this trend. The growing demand for immersive and collaborative experiences in both professional and educational settings is a primary catalyst.
Obstacles in the 3D Interactive Projector Market Report Description
Despite robust growth, the 3D interactive projector market faces several obstacles. Regulatory challenges, including varying standards for digital content and data privacy, can slow down widespread adoption. Supply chain disruptions, as evidenced by recent global events, can impact production and increase costs, potentially affecting the availability of interactive projectors. Competitive pressures from alternative display technologies like large-format interactive flat panels and the high initial investment cost for advanced 3D interactive projectors also present barriers. The estimated impact of these obstacles on market growth is a reduction in the projected CAGR by xx%.
Future Opportunities in 3D Interactive Projector Report Description
The 3D interactive projector market is ripe with future opportunities. Emerging markets in developing economies, coupled with increasing internet penetration, present vast untapped potential for interactive display solutions. New technologies, such as augmented reality (AR) integration and advanced haptic feedback, promise to revolutionize user interaction and content creation. Shifting consumer trends towards personalized learning and remote collaboration further drive the demand for sophisticated interactive projectors. The development of AI-driven features for intuitive operation and content analysis is another significant avenue for innovation and market expansion, with an estimated market opportunity of xx billion by 2033.
Major Players in the 3D Interactive Projector Ecosystem Report Description
The 3D interactive projector market is characterized by a strong ecosystem of leading global companies. These innovators are at the forefront of developing and deploying advanced interactive display technologies.
- Seiko Epson Corp.
- BenQ Corp.
- Mimio Boxlight
- Dell Technologies Inc
- Panasonic Corp.
- CASIO COMPUTER Co.,Ltd.
- NEC Display Solutions,Ltd.
- Optoma Technology Inc
- Touchjet Inc.
- Delta Electronics Inc.
Key Developments in 3D Interactive Projector Industry Report Description
The 3D interactive projector industry has witnessed significant developments that have reshaped market dynamics and technological advancements.
- 2023 January: Seiko Epson Corp. launched a new series of ultra-short-throw laser interactive projectors for education, enhancing classroom engagement.
- 2023 March: BenQ Corp. introduced AI-powered interactive projectors with advanced annotation features for corporate environments, boosting meeting productivity.
- 2023 June: Mimio Boxlight acquired a key competitor, consolidating its position in the interactive education technology market.
- 2023 September: Dell Technologies Inc. showcased its latest 4K interactive projectors with enhanced connectivity options for seamless integration.
- 2024 February: Panasonic Corp. unveiled new interactive projectors with built-in whiteboarding capabilities, simplifying collaborative workflows.
- 2024 April: CASIO COMPUTER Co.,Ltd. announced a significant increase in the lifespan of its lamp-free projectors, reducing total cost of ownership.
- 2024 July: NEC Display Solutions,Ltd. partnered with a leading software provider to offer integrated interactive presentation solutions.
- 2024 October: Optoma Technology Inc. released a new range of portable interactive projectors designed for mobile professionals and educators.
Strategic 3D Interactive Projector Market Forecast Report Description
The strategic 3D interactive projector market forecast indicates a robust growth trajectory, driven by continuous technological innovation and escalating demand for immersive collaborative solutions. Future opportunities in emerging markets and the development of advanced features like AI integration and AR compatibility will significantly fuel market expansion. The projected market value of xx billion by 2033 signifies substantial potential. Key growth catalysts include the increasing digitalization of education, the demand for enhanced productivity in corporate settings, and government initiatives promoting technological adoption. The market is poised for sustained expansion, offering significant opportunities for stakeholders investing in interactive projector technology.
3D Interactive Projector Segmentation
-
1. Application
- 1.1. Education
- 1.2. Corporate
- 1.3. Government
-
2. Types
- 2.1. DLP
- 2.2. LCD
- 2.3. LCoS
3D Interactive Projector Segmentation By Geography
-
1. North America
- 1.1. United States
- 1.2. Canada
- 1.3. Mexico
-
2. South America
- 2.1. Brazil
- 2.2. Argentina
- 2.3. Rest of South America
-
3. Europe
- 3.1. United Kingdom
- 3.2. Germany
- 3.3. France
- 3.4. Italy
- 3.5. Spain
- 3.6. Russia
- 3.7. Benelux
- 3.8. Nordics
- 3.9. Rest of Europe
-
4. Middle East & Africa
- 4.1. Turkey
- 4.2. Israel
- 4.3. GCC
- 4.4. North Africa
- 4.5. South Africa
- 4.6. Rest of Middle East & Africa
-
5. Asia Pacific
- 5.1. China
- 5.2. India
- 5.3. Japan
- 5.4. South Korea
- 5.5. ASEAN
- 5.6. Oceania
- 5.7. Rest of Asia Pacific
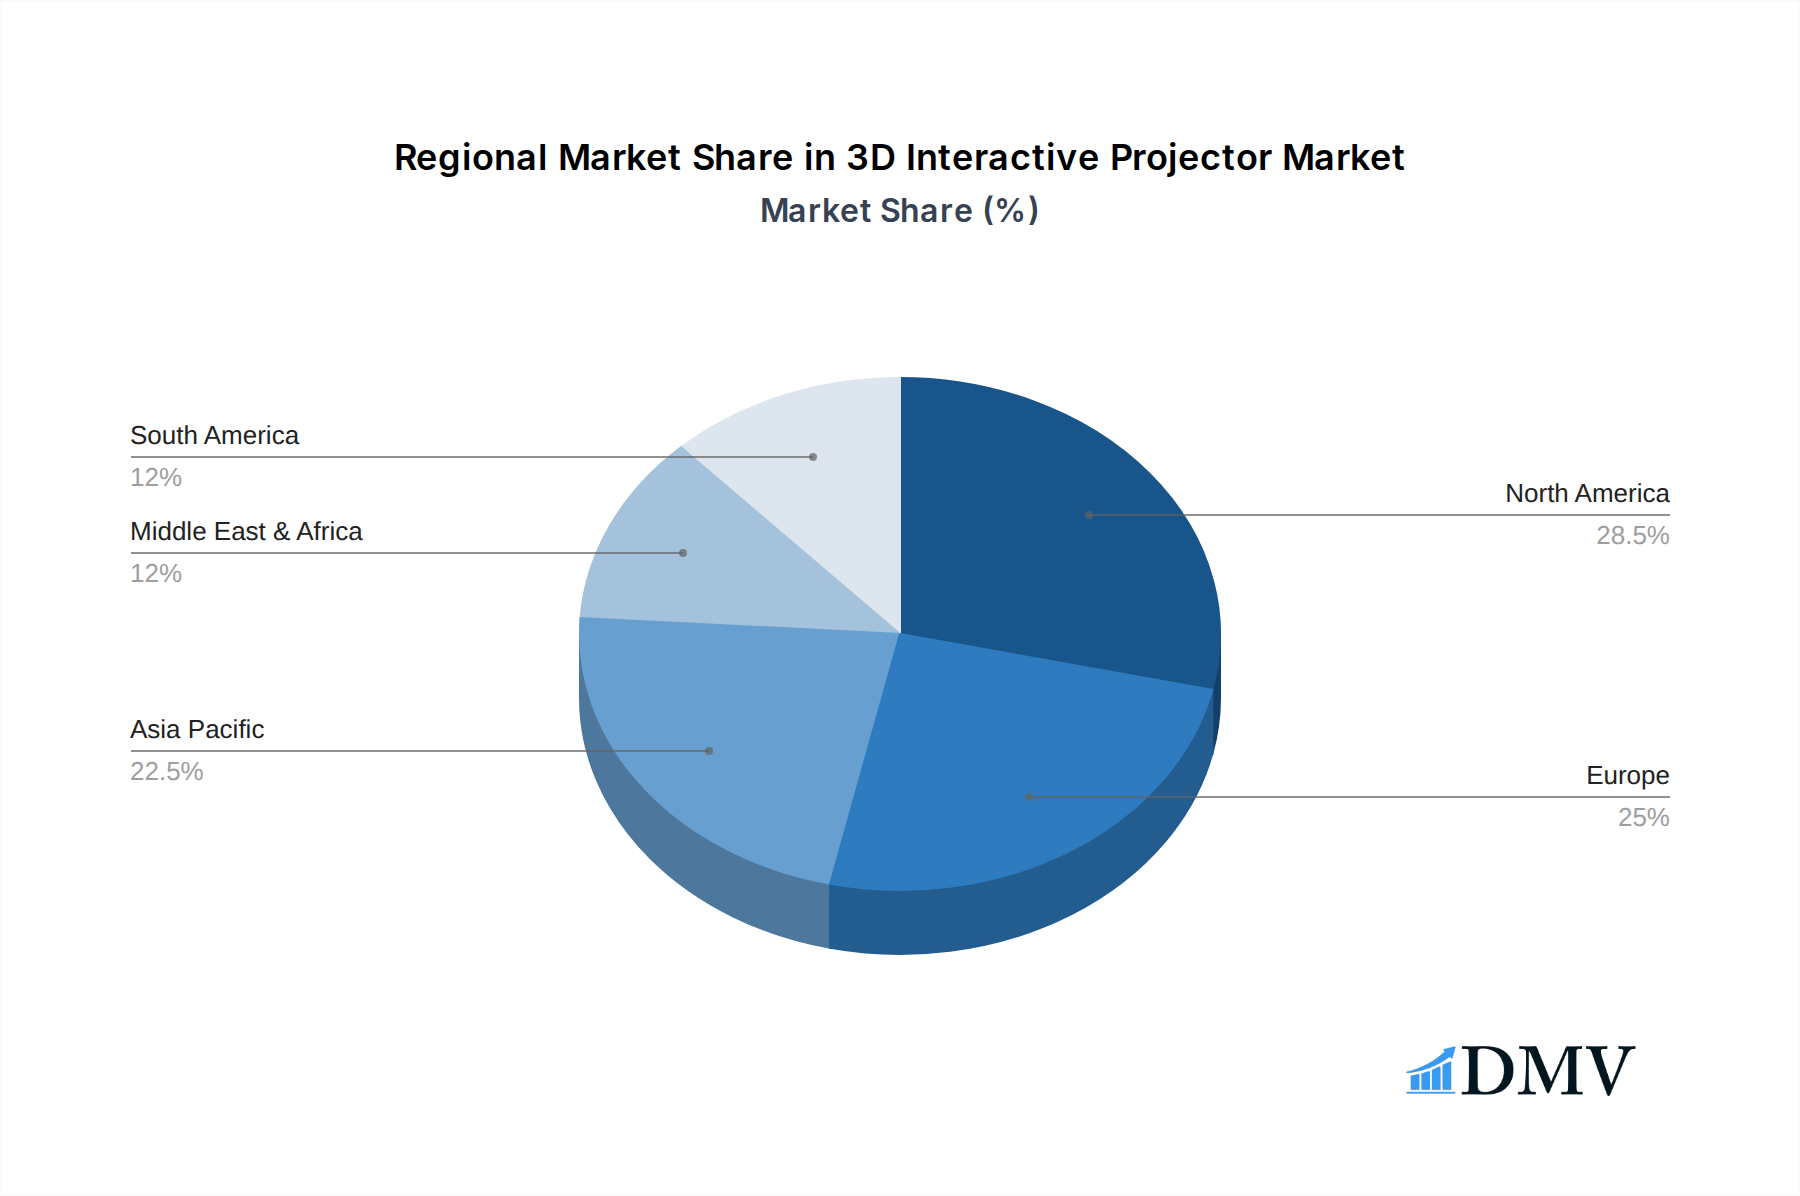
3D Interactive Projector Regional Market Share
Geographic Coverage of 3D Interactive Projector
3D Interactive Projector REPORT HIGHLIGHTS
| Aspects | Details |
|---|---|
| Study Period | 2020-2034 |
| Base Year | 2025 |
| Estimated Year | 2026 |
| Forecast Period | 2026-2034 |
| Historical Period | 2020-2025 |
| Growth Rate | CAGR of 9.7% from 2020-2034 |
| Segmentation |
|
Table of Contents
- 1. Introduction
- 1.1. Research Scope
- 1.2. Market Segmentation
- 1.3. Research Methodology
- 1.4. Definitions and Assumptions
- 2. Executive Summary
- 2.1. Introduction
- 3. Market Dynamics
- 3.1. Introduction
- 3.2. Market Drivers
- 3.3. Market Restrains
- 3.4. Market Trends
- 4. Market Factor Analysis
- 4.1. Porters Five Forces
- 4.2. Supply/Value Chain
- 4.3. PESTEL analysis
- 4.4. Market Entropy
- 4.5. Patent/Trademark Analysis
- 5. Global 3D Interactive Projector Analysis, Insights and Forecast, 2020-2032
- 5.1. Market Analysis, Insights and Forecast - by Application
- 5.1.1. Education
- 5.1.2. Corporate
- 5.1.3. Government
- 5.2. Market Analysis, Insights and Forecast - by Types
- 5.2.1. DLP
- 5.2.2. LCD
- 5.2.3. LCoS
- 5.3. Market Analysis, Insights and Forecast - by Region
- 5.3.1. North America
- 5.3.2. South America
- 5.3.3. Europe
- 5.3.4. Middle East & Africa
- 5.3.5. Asia Pacific
- 5.1. Market Analysis, Insights and Forecast - by Application
- 6. North America 3D Interactive Projector Analysis, Insights and Forecast, 2020-2032
- 6.1. Market Analysis, Insights and Forecast - by Application
- 6.1.1. Education
- 6.1.2. Corporate
- 6.1.3. Government
- 6.2. Market Analysis, Insights and Forecast - by Types
- 6.2.1. DLP
- 6.2.2. LCD
- 6.2.3. LCoS
- 6.1. Market Analysis, Insights and Forecast - by Application
- 7. South America 3D Interactive Projector Analysis, Insights and Forecast, 2020-2032
- 7.1. Market Analysis, Insights and Forecast - by Application
- 7.1.1. Education
- 7.1.2. Corporate
- 7.1.3. Government
- 7.2. Market Analysis, Insights and Forecast - by Types
- 7.2.1. DLP
- 7.2.2. LCD
- 7.2.3. LCoS
- 7.1. Market Analysis, Insights and Forecast - by Application
- 8. Europe 3D Interactive Projector Analysis, Insights and Forecast, 2020-2032
- 8.1. Market Analysis, Insights and Forecast - by Application
- 8.1.1. Education
- 8.1.2. Corporate
- 8.1.3. Government
- 8.2. Market Analysis, Insights and Forecast - by Types
- 8.2.1. DLP
- 8.2.2. LCD
- 8.2.3. LCoS
- 8.1. Market Analysis, Insights and Forecast - by Application
- 9. Middle East & Africa 3D Interactive Projector Analysis, Insights and Forecast, 2020-2032
- 9.1. Market Analysis, Insights and Forecast - by Application
- 9.1.1. Education
- 9.1.2. Corporate
- 9.1.3. Government
- 9.2. Market Analysis, Insights and Forecast - by Types
- 9.2.1. DLP
- 9.2.2. LCD
- 9.2.3. LCoS
- 9.1. Market Analysis, Insights and Forecast - by Application
- 10. Asia Pacific 3D Interactive Projector Analysis, Insights and Forecast, 2020-2032
- 10.1. Market Analysis, Insights and Forecast - by Application
- 10.1.1. Education
- 10.1.2. Corporate
- 10.1.3. Government
- 10.2. Market Analysis, Insights and Forecast - by Types
- 10.2.1. DLP
- 10.2.2. LCD
- 10.2.3. LCoS
- 10.1. Market Analysis, Insights and Forecast - by Application
- 11. Competitive Analysis
- 11.1. Global Market Share Analysis 2025
- 11.2. Company Profiles
- 11.2.1 Seiko Epson Corp. (Japan)
- 11.2.1.1. Overview
- 11.2.1.2. Products
- 11.2.1.3. SWOT Analysis
- 11.2.1.4. Recent Developments
- 11.2.1.5. Financials (Based on Availability)
- 11.2.2 BenQ Corp. (Taiwan)
- 11.2.2.1. Overview
- 11.2.2.2. Products
- 11.2.2.3. SWOT Analysis
- 11.2.2.4. Recent Developments
- 11.2.2.5. Financials (Based on Availability)
- 11.2.3 Mimio Boxlight (US)
- 11.2.3.1. Overview
- 11.2.3.2. Products
- 11.2.3.3. SWOT Analysis
- 11.2.3.4. Recent Developments
- 11.2.3.5. Financials (Based on Availability)
- 11.2.4 Dell Technologies Inc (US)
- 11.2.4.1. Overview
- 11.2.4.2. Products
- 11.2.4.3. SWOT Analysis
- 11.2.4.4. Recent Developments
- 11.2.4.5. Financials (Based on Availability)
- 11.2.5 Panasonic Corp. (Japan)
- 11.2.5.1. Overview
- 11.2.5.2. Products
- 11.2.5.3. SWOT Analysis
- 11.2.5.4. Recent Developments
- 11.2.5.5. Financials (Based on Availability)
- 11.2.6 CASIO COMPUTER Co.
- 11.2.6.1. Overview
- 11.2.6.2. Products
- 11.2.6.3. SWOT Analysis
- 11.2.6.4. Recent Developments
- 11.2.6.5. Financials (Based on Availability)
- 11.2.7 Ltd. (Japan)
- 11.2.7.1. Overview
- 11.2.7.2. Products
- 11.2.7.3. SWOT Analysis
- 11.2.7.4. Recent Developments
- 11.2.7.5. Financials (Based on Availability)
- 11.2.8 NEC Display Solutions
- 11.2.8.1. Overview
- 11.2.8.2. Products
- 11.2.8.3. SWOT Analysis
- 11.2.8.4. Recent Developments
- 11.2.8.5. Financials (Based on Availability)
- 11.2.9 Ltd. (Japan)
- 11.2.9.1. Overview
- 11.2.9.2. Products
- 11.2.9.3. SWOT Analysis
- 11.2.9.4. Recent Developments
- 11.2.9.5. Financials (Based on Availability)
- 11.2.10 Optoma Technology Inc (US)
- 11.2.10.1. Overview
- 11.2.10.2. Products
- 11.2.10.3. SWOT Analysis
- 11.2.10.4. Recent Developments
- 11.2.10.5. Financials (Based on Availability)
- 11.2.11 Touchjet Inc. (Singapore)
- 11.2.11.1. Overview
- 11.2.11.2. Products
- 11.2.11.3. SWOT Analysis
- 11.2.11.4. Recent Developments
- 11.2.11.5. Financials (Based on Availability)
- 11.2.12 Delta Electronics Inc. (Taiwan)
- 11.2.12.1. Overview
- 11.2.12.2. Products
- 11.2.12.3. SWOT Analysis
- 11.2.12.4. Recent Developments
- 11.2.12.5. Financials (Based on Availability)
- 11.2.1 Seiko Epson Corp. (Japan)
List of Figures
- Figure 1: Global 3D Interactive Projector Revenue Breakdown (undefined, %) by Region 2025 & 2033
- Figure 2: North America 3D Interactive Projector Revenue (undefined), by Application 2025 & 2033
- Figure 3: North America 3D Interactive Projector Revenue Share (%), by Application 2025 & 2033
- Figure 4: North America 3D Interactive Projector Revenue (undefined), by Types 2025 & 2033
- Figure 5: North America 3D Interactive Projector Revenue Share (%), by Types 2025 & 2033
- Figure 6: North America 3D Interactive Projector Revenue (undefined), by Country 2025 & 2033
- Figure 7: North America 3D Interactive Projector Revenue Share (%), by Country 2025 & 2033
- Figure 8: South America 3D Interactive Projector Revenue (undefined), by Application 2025 & 2033
- Figure 9: South America 3D Interactive Projector Revenue Share (%), by Application 2025 & 2033
- Figure 10: South America 3D Interactive Projector Revenue (undefined), by Types 2025 & 2033
- Figure 11: South America 3D Interactive Projector Revenue Share (%), by Types 2025 & 2033
- Figure 12: South America 3D Interactive Projector Revenue (undefined), by Country 2025 & 2033
- Figure 13: South America 3D Interactive Projector Revenue Share (%), by Country 2025 & 2033
- Figure 14: Europe 3D Interactive Projector Revenue (undefined), by Application 2025 & 2033
- Figure 15: Europe 3D Interactive Projector Revenue Share (%), by Application 2025 & 2033
- Figure 16: Europe 3D Interactive Projector Revenue (undefined), by Types 2025 & 2033
- Figure 17: Europe 3D Interactive Projector Revenue Share (%), by Types 2025 & 2033
- Figure 18: Europe 3D Interactive Projector Revenue (undefined), by Country 2025 & 2033
- Figure 19: Europe 3D Interactive Projector Revenue Share (%), by Country 2025 & 2033
- Figure 20: Middle East & Africa 3D Interactive Projector Revenue (undefined), by Application 2025 & 2033
- Figure 21: Middle East & Africa 3D Interactive Projector Revenue Share (%), by Application 2025 & 2033
- Figure 22: Middle East & Africa 3D Interactive Projector Revenue (undefined), by Types 2025 & 2033
- Figure 23: Middle East & Africa 3D Interactive Projector Revenue Share (%), by Types 2025 & 2033
- Figure 24: Middle East & Africa 3D Interactive Projector Revenue (undefined), by Country 2025 & 2033
- Figure 25: Middle East & Africa 3D Interactive Projector Revenue Share (%), by Country 2025 & 2033
- Figure 26: Asia Pacific 3D Interactive Projector Revenue (undefined), by Application 2025 & 2033
- Figure 27: Asia Pacific 3D Interactive Projector Revenue Share (%), by Application 2025 & 2033
- Figure 28: Asia Pacific 3D Interactive Projector Revenue (undefined), by Types 2025 & 2033
- Figure 29: Asia Pacific 3D Interactive Projector Revenue Share (%), by Types 2025 & 2033
- Figure 30: Asia Pacific 3D Interactive Projector Revenue (undefined), by Country 2025 & 2033
- Figure 31: Asia Pacific 3D Interactive Projector Revenue Share (%), by Country 2025 & 2033
List of Tables
- Table 1: Global 3D Interactive Projector Revenue undefined Forecast, by Application 2020 & 2033
- Table 2: Global 3D Interactive Projector Revenue undefined Forecast, by Types 2020 & 2033
- Table 3: Global 3D Interactive Projector Revenue undefined Forecast, by Region 2020 & 2033
- Table 4: Global 3D Interactive Projector Revenue undefined Forecast, by Application 2020 & 2033
- Table 5: Global 3D Interactive Projector Revenue undefined Forecast, by Types 2020 & 2033
- Table 6: Global 3D Interactive Projector Revenue undefined Forecast, by Country 2020 & 2033
- Table 7: United States 3D Interactive Projector Revenue (undefined) Forecast, by Application 2020 & 2033
- Table 8: Canada 3D Interactive Projector Revenue (undefined) Forecast, by Application 2020 & 2033
- Table 9: Mexico 3D Interactive Projector Revenue (undefined) Forecast, by Application 2020 & 2033
- Table 10: Global 3D Interactive Projector Revenue undefined Forecast, by Application 2020 & 2033
- Table 11: Global 3D Interactive Projector Revenue undefined Forecast, by Types 2020 & 2033
- Table 12: Global 3D Interactive Projector Revenue undefined Forecast, by Country 2020 & 2033
- Table 13: Brazil 3D Interactive Projector Revenue (undefined) Forecast, by Application 2020 & 2033
- Table 14: Argentina 3D Interactive Projector Revenue (undefined) Forecast, by Application 2020 & 2033
- Table 15: Rest of South America 3D Interactive Projector Revenue (undefined) Forecast, by Application 2020 & 2033
- Table 16: Global 3D Interactive Projector Revenue undefined Forecast, by Application 2020 & 2033
- Table 17: Global 3D Interactive Projector Revenue undefined Forecast, by Types 2020 & 2033
- Table 18: Global 3D Interactive Projector Revenue undefined Forecast, by Country 2020 & 2033
- Table 19: United Kingdom 3D Interactive Projector Revenue (undefined) Forecast, by Application 2020 & 2033
- Table 20: Germany 3D Interactive Projector Revenue (undefined) Forecast, by Application 2020 & 2033
- Table 21: France 3D Interactive Projector Revenue (undefined) Forecast, by Application 2020 & 2033
- Table 22: Italy 3D Interactive Projector Revenue (undefined) Forecast, by Application 2020 & 2033
- Table 23: Spain 3D Interactive Projector Revenue (undefined) Forecast, by Application 2020 & 2033
- Table 24: Russia 3D Interactive Projector Revenue (undefined) Forecast, by Application 2020 & 2033
- Table 25: Benelux 3D Interactive Projector Revenue (undefined) Forecast, by Application 2020 & 2033
- Table 26: Nordics 3D Interactive Projector Revenue (undefined) Forecast, by Application 2020 & 2033
- Table 27: Rest of Europe 3D Interactive Projector Revenue (undefined) Forecast, by Application 2020 & 2033
- Table 28: Global 3D Interactive Projector Revenue undefined Forecast, by Application 2020 & 2033
- Table 29: Global 3D Interactive Projector Revenue undefined Forecast, by Types 2020 & 2033
- Table 30: Global 3D Interactive Projector Revenue undefined Forecast, by Country 2020 & 2033
- Table 31: Turkey 3D Interactive Projector Revenue (undefined) Forecast, by Application 2020 & 2033
- Table 32: Israel 3D Interactive Projector Revenue (undefined) Forecast, by Application 2020 & 2033
- Table 33: GCC 3D Interactive Projector Revenue (undefined) Forecast, by Application 2020 & 2033
- Table 34: North Africa 3D Interactive Projector Revenue (undefined) Forecast, by Application 2020 & 2033
- Table 35: South Africa 3D Interactive Projector Revenue (undefined) Forecast, by Application 2020 & 2033
- Table 36: Rest of Middle East & Africa 3D Interactive Projector Revenue (undefined) Forecast, by Application 2020 & 2033
- Table 37: Global 3D Interactive Projector Revenue undefined Forecast, by Application 2020 & 2033
- Table 38: Global 3D Interactive Projector Revenue undefined Forecast, by Types 2020 & 2033
- Table 39: Global 3D Interactive Projector Revenue undefined Forecast, by Country 2020 & 2033
- Table 40: China 3D Interactive Projector Revenue (undefined) Forecast, by Application 2020 & 2033
- Table 41: India 3D Interactive Projector Revenue (undefined) Forecast, by Application 2020 & 2033
- Table 42: Japan 3D Interactive Projector Revenue (undefined) Forecast, by Application 2020 & 2033
- Table 43: South Korea 3D Interactive Projector Revenue (undefined) Forecast, by Application 2020 & 2033
- Table 44: ASEAN 3D Interactive Projector Revenue (undefined) Forecast, by Application 2020 & 2033
- Table 45: Oceania 3D Interactive Projector Revenue (undefined) Forecast, by Application 2020 & 2033
- Table 46: Rest of Asia Pacific 3D Interactive Projector Revenue (undefined) Forecast, by Application 2020 & 2033
Frequently Asked Questions
1. What is the projected Compound Annual Growth Rate (CAGR) of the 3D Interactive Projector?
The projected CAGR is approximately 9.7%.
2. Which companies are prominent players in the 3D Interactive Projector?
Key companies in the market include Seiko Epson Corp. (Japan), BenQ Corp. (Taiwan), Mimio Boxlight (US), Dell Technologies Inc (US), Panasonic Corp. (Japan), CASIO COMPUTER Co., Ltd. (Japan), NEC Display Solutions, Ltd. (Japan), Optoma Technology Inc (US), Touchjet Inc. (Singapore), Delta Electronics Inc. (Taiwan).
3. What are the main segments of the 3D Interactive Projector?
The market segments include Application, Types.
4. Can you provide details about the market size?
The market size is estimated to be USD XXX N/A as of 2022.
5. What are some drivers contributing to market growth?
N/A
6. What are the notable trends driving market growth?
N/A
7. Are there any restraints impacting market growth?
N/A
8. Can you provide examples of recent developments in the market?
N/A
9. What pricing options are available for accessing the report?
Pricing options include single-user, multi-user, and enterprise licenses priced at USD 2900.00, USD 4350.00, and USD 5800.00 respectively.
10. Is the market size provided in terms of value or volume?
The market size is provided in terms of value, measured in N/A.
11. Are there any specific market keywords associated with the report?
Yes, the market keyword associated with the report is "3D Interactive Projector," which aids in identifying and referencing the specific market segment covered.
12. How do I determine which pricing option suits my needs best?
The pricing options vary based on user requirements and access needs. Individual users may opt for single-user licenses, while businesses requiring broader access may choose multi-user or enterprise licenses for cost-effective access to the report.
13. Are there any additional resources or data provided in the 3D Interactive Projector report?
While the report offers comprehensive insights, it's advisable to review the specific contents or supplementary materials provided to ascertain if additional resources or data are available.
14. How can I stay updated on further developments or reports in the 3D Interactive Projector?
To stay informed about further developments, trends, and reports in the 3D Interactive Projector, consider subscribing to industry newsletters, following relevant companies and organizations, or regularly checking reputable industry news sources and publications.
Methodology
Step 1 - Identification of Relevant Samples Size from Population Database


Step 2 - Approaches for Defining Global Market Size (Value, Volume* & Price*)

Note*: In applicable scenarios
Step 3 - Data Sources
Primary Research
- Web Analytics
- Survey Reports
- Research Institute
- Latest Research Reports
- Opinion Leaders
Secondary Research
- Annual Reports
- White Paper
- Latest Press Release
- Industry Association
- Paid Database
- Investor Presentations

Step 4 - Data Triangulation
Involves using different sources of information in order to increase the validity of a study
These sources are likely to be stakeholders in a program - participants, other researchers, program staff, other community members, and so on.
Then we put all data in single framework & apply various statistical tools to find out the dynamic on the market.
During the analysis stage, feedback from the stakeholder groups would be compared to determine areas of agreement as well as areas of divergence