

Key Insights
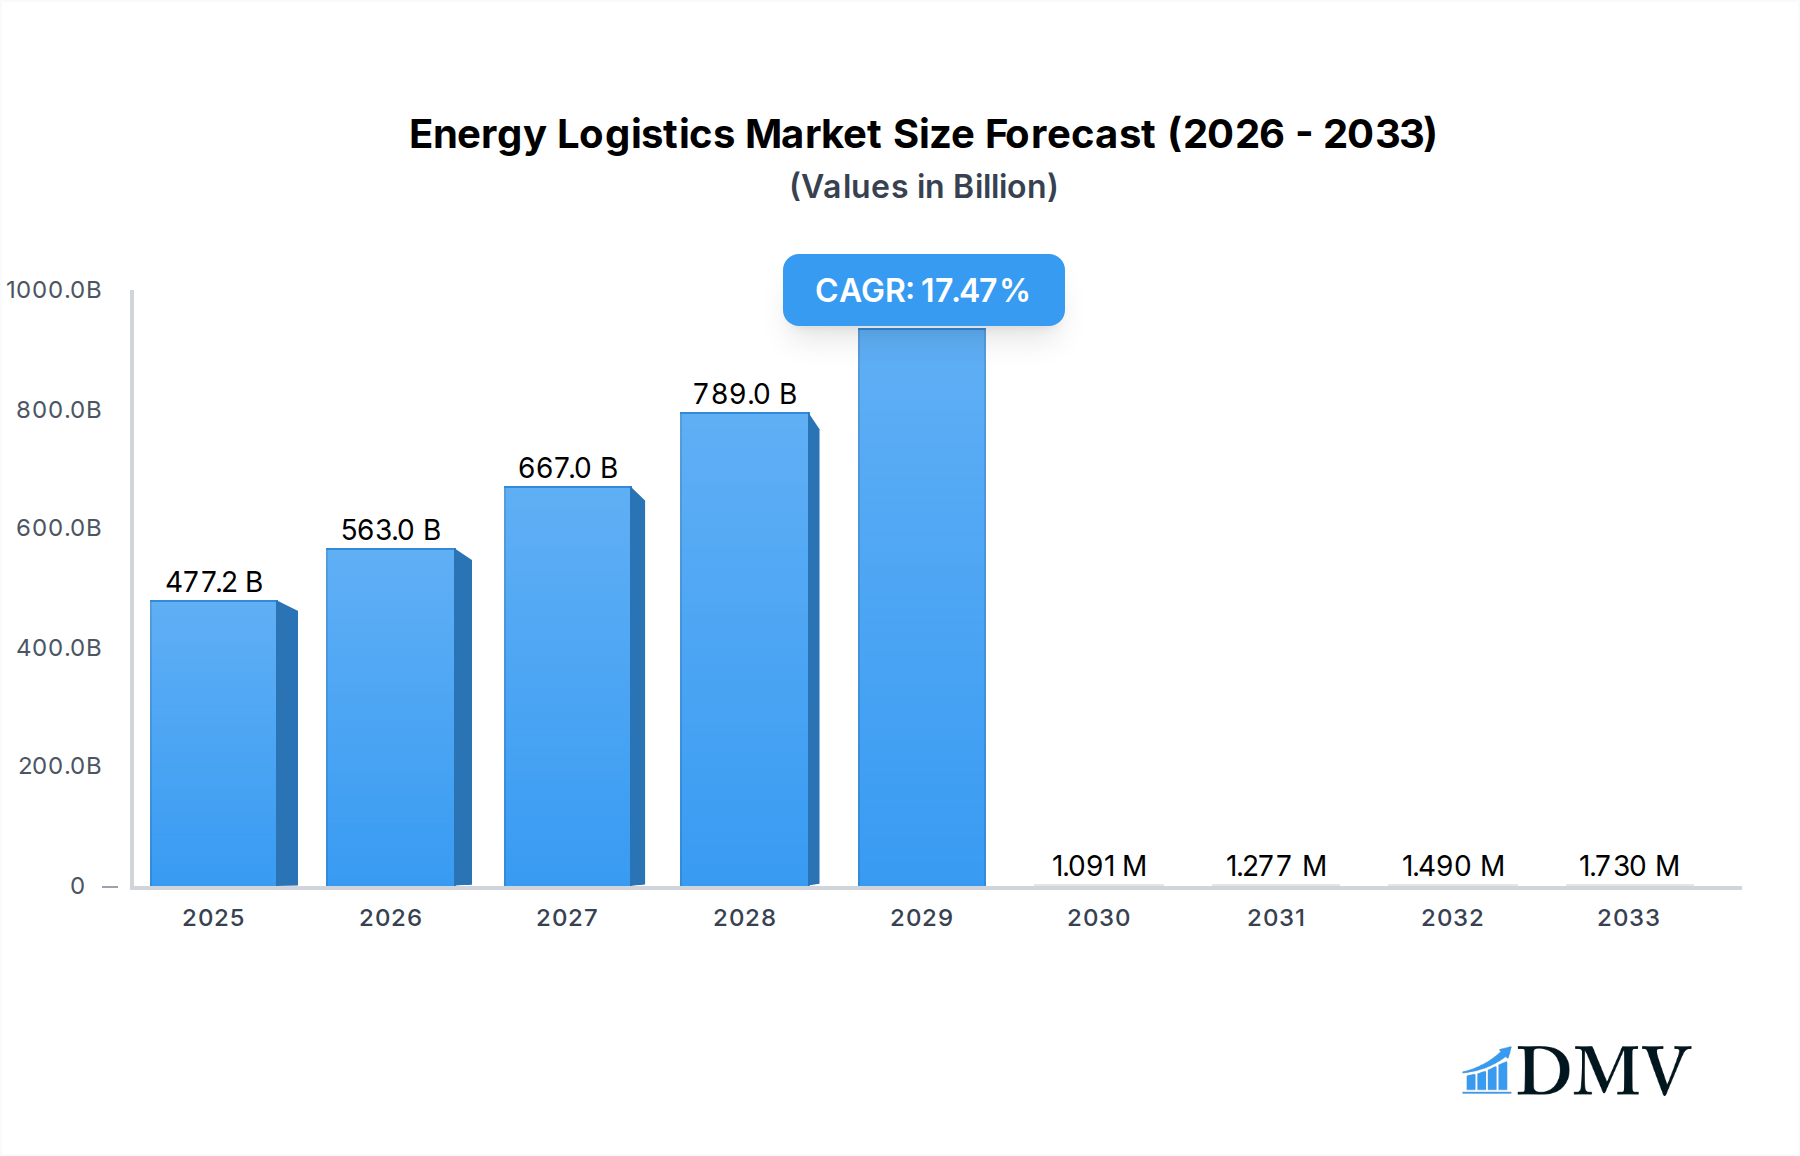
The Energy Logistics Market is poised for substantial expansion, projected to reach $477.2 billion in 2025. This robust growth is underpinned by a compelling Compound Annual Growth Rate (CAGR) of 17.9%, indicating a dynamic and expanding sector. The market's expansion is significantly fueled by the increasing demand for efficient and specialized logistics solutions across the oil and gas industry, which continues to be a dominant force. Furthermore, the accelerating transition towards renewable energy sources, including solar, wind, and hydroelectric power, necessitates sophisticated logistical frameworks for the transportation of oversized components, raw materials, and completed infrastructure. Power generation and energy mining sectors also contribute to this upward trajectory, requiring specialized handling and transportation for heavy machinery, fuels, and extracted resources. The imperative to move these vital energy components across diverse geographical locations and through various modes of transport—including railways, airways, roadways, and waterways—is a primary driver. As global energy demand continues to rise and the industry diversifies its sources, the complexity and scale of energy logistics operations are set to increase, demanding innovative and optimized supply chain management.

Energy Logistics Market Market Size (In Billion)
Looking ahead, the market's growth is expected to be shaped by several key trends and evolving dynamics. The integration of advanced technologies, such as artificial intelligence, IoT, and blockchain, is revolutionizing energy logistics by enhancing visibility, optimizing routes, and improving operational efficiency. Sustainability is also emerging as a critical factor, with companies increasingly focusing on eco-friendly logistics solutions and reducing their carbon footprint. The government sector plays a pivotal role through infrastructure development and policy support, while the private sector's investment in energy projects drives demand for specialized logistics. Major players like Maersk, DHL, ExxonMobil, and Chevron are actively shaping the market through strategic investments, technological advancements, and expansion into emerging markets. While the market presents immense opportunities, potential restraints such as geopolitical instability, fluctuating energy prices, and complex regulatory environments can pose challenges. However, the overall outlook remains exceptionally positive, driven by the indispensable nature of energy and the evolving global energy landscape.
Energy Logistics Market Company Market Share
Here's the SEO-optimized report description for the Energy Logistics Market:
This in-depth report provides a definitive analysis of the global energy logistics market, a critical sector underpinning the world's energy supply chain. Spanning the historical period of 2019–2024, with a base year of 2025 and a comprehensive forecast extending to 2033, this research offers unparalleled insights into market dynamics, growth drivers, and emerging trends. We delve deep into the intricacies of transporting vital energy resources, from fossil fuels to renewables, across diverse geographical landscapes and through various modes of transport. This report is an essential resource for stakeholders seeking to navigate the complexities of energy supply chain management, oil and gas logistics, renewable energy transportation, and power generation logistics.
Energy Logistics Market Market Composition & Trends
The energy logistics market is characterized by a dynamic interplay of large, established players and emerging innovators, with a notable market concentration among key energy logistics companies such as Maersk, DHL, ExxonMobil, Kuehne + Nagel, C H Robinson, COSCO Shipping Lines, Chevron, Mediterranean Shipping Company (MSC), BP, and TransCanada. The market's trajectory is significantly influenced by continuous innovation, particularly in sustainable logistics solutions and digital transformation, alongside evolving energy logistics regulations. Substitute products, while present in some niche applications, generally face challenges in matching the scale and efficiency required for bulk energy movements. End-user profiles are diverse, encompassing the government sector and the private sector, each with distinct procurement strategies and demands. Mergers and acquisitions (M&A) are a significant feature, with recent deal values estimated to be in the billions, reflecting strategic consolidation and expansion within the energy logistics sector. The market share distribution is highly competitive, with major players often vying for dominance in specific segments.
Energy Logistics Market Industry Evolution
The energy logistics market has undergone a remarkable transformation driven by a confluence of factors throughout the historical period (2019–2024) and projected for the forecast period (2025–2033). Initial growth trajectories were largely dictated by the stable demand for oil and gas logistics, a foundational pillar of the industry. However, the escalating focus on climate change and the global energy transition has propelled renewable energy logistics into a prominent growth segment. Technological advancements have been pivotal, with the adoption of AI-powered route optimization, real-time tracking systems, and autonomous vessels and vehicles significantly enhancing efficiency and reducing operational costs. These advancements are crucial for managing the complex logistical requirements of distributed renewable energy sources. Shifting consumer demands, influenced by environmental consciousness and a desire for more sustainable energy solutions, have further accelerated the diversification of the energy mix and, consequently, the energy logistics services required. For instance, the growth rate in the transportation of components for solar and wind farms has seen a CAGR of approximately 12% during the historical period, a trend expected to continue. Furthermore, the power generation logistics segment is adapting to accommodate the integration of diverse energy sources, requiring flexible and responsive supply chains. The energy mining logistics sector, while facing its own unique challenges, continues to be a substantial contributor, especially in regions with significant mineral resource extraction. Overall, the industry's evolution is marked by an increasing emphasis on sustainability, digitalization, and adaptability to meet the burgeoning demands of a global energy landscape in flux. The estimated market size for energy logistics is projected to reach over $2,500 billion by 2033, showcasing substantial growth potential.
Leading Regions, Countries, or Segments in Energy Logistics Market
Within the energy logistics market, the Oil & Gas application segment continues to command a significant share, driven by ongoing global demand and established infrastructure. However, the Renewable Energy segment is emerging as a powerful growth engine, propelled by substantial global investments and favorable governmental policies aimed at decarbonization. Key regions demonstrating leadership in this domain include North America, Europe, and increasingly, Asia-Pacific, owing to rapid industrialization and a strong push towards renewable energy adoption.
Dominant Application Segment: Oil & Gas: Despite the rise of renewables, the oil and gas logistics sector remains dominant due to its scale and the persistent global reliance on these energy sources.
- Key Drivers: Consistent global demand, existing extensive infrastructure, and the need for efficient transportation of crude oil, natural gas, and refined products.
- Dominance Factors: Mature supply chains, specialized handling equipment, and established long-term contracts ensure continued market leadership.
High-Growth Application Segment: Renewable Energy: This segment is experiencing exponential growth, driven by aggressive climate targets and technological advancements.
- Key Drivers: Government incentives, declining costs of renewable technologies, and increasing corporate sustainability mandates.
- Dominance Factors: Expanding manufacturing capacity for solar panels, wind turbines, and battery storage solutions, requiring specialized and often oversized transportation solutions. North America and Europe are leading in renewable energy infrastructure development and, consequently, the associated logistics.
Significant Application Segment: Power Generation: This segment encompasses the logistics of fuel for traditional power plants and components for new energy infrastructure.
- Key Drivers: Growing global energy demand and the transition towards cleaner power generation methods.
- Dominance Factors: The need for reliable and cost-effective transportation of coal, natural gas, nuclear fuels, and components for grid modernization.
End-User Dominance: Private Sector: The private sector is the primary driver of demand in the energy logistics market, comprising energy companies, manufacturers, and industrial consumers.
- Key Drivers: Commercial interests, profit motives, and the imperative to secure energy supplies efficiently.
- Dominance Factors: The vast majority of energy production and consumption is managed by private entities, dictating the volume and nature of logistics services required.
Mode of Transport Dominance: Waterways: For bulk energy transportation, waterways (oceans and inland waterways) remain the most cost-effective and efficient mode.
- Key Drivers: High capacity, lower per-unit cost for long-distance transport of crude oil, LNG, coal, and large components.
- Dominance Factors: The sheer volume of global energy trade necessitates the use of large tankers, container ships, and barges, making waterways indispensable. The Mediterranean Shipping Company (MSC) and COSCO Shipping Lines are prime examples of dominant players leveraging this mode.
Energy Logistics Market Product Innovations
Innovation within the energy logistics market is focused on enhancing efficiency, sustainability, and safety. Companies are developing advanced tracking and monitoring systems leveraging IoT and blockchain for real-time visibility across the supply chain, from extraction to consumption. This includes smart containers for hazardous materials and predictive maintenance solutions for fleets. Furthermore, there's a significant push towards adopting alternative fuels for transportation fleets, such as electric trucks and LNG-powered vessels, to reduce carbon footprints. Performance metrics are improving with a focus on reduced transit times, lower operational costs, and minimized environmental impact. Unique selling propositions are emerging around integrated logistics solutions that combine multimodal transport with specialized energy handling expertise. The estimated value of innovation in this market is projected to be in the hundreds of billions over the forecast period.
Propelling Factors for Energy Logistics Market Growth
The energy logistics market is propelled by a potent combination of technological advancements, robust economic growth, and supportive regulatory frameworks. The increasing global demand for energy, coupled with the ongoing energy transition towards renewables, necessitates sophisticated and expansive logistics networks. Technological innovations, such as AI-driven route optimization and the adoption of digital twins for supply chain visualization, are enhancing operational efficiency and reducing costs. Furthermore, substantial government investments in renewable energy infrastructure and the ongoing exploration and extraction of fossil fuels create continuous demand for specialized transportation and storage solutions. Economic growth in developing nations also plays a crucial role, as rising industrialization and urbanization translate to higher energy consumption and, consequently, increased logistics activity. The market is estimated to grow at a CAGR of approximately 7.5% from 2025 to 2033.
Obstacles in the Energy Logistics Market Market
Despite robust growth, the energy logistics market faces significant obstacles. Stringent environmental regulations and compliance requirements in different regions can increase operational costs and complexity. Supply chain disruptions, stemming from geopolitical instability, natural disasters, or trade disputes, pose a constant threat to timely delivery and cost predictability. Fierce competitive pressures among logistics providers can lead to price wars, impacting profit margins. Moreover, the high capital investment required for specialized equipment and infrastructure, particularly for handling hazardous materials or large renewable energy components, presents a substantial barrier to entry for smaller players. The estimated impact of these disruptions on market growth could lead to a reduction of up to 5% in projected revenues during periods of severe instability.
Future Opportunities in Energy Logistics Market
The energy logistics market is brimming with emerging opportunities. The rapid expansion of the renewable energy sector, including offshore wind farms and large-scale solar projects, requires specialized transportation and installation logistics. The growing adoption of electric vehicles (EVs) is creating new demands for battery logistics and charging infrastructure deployment. Furthermore, the increasing exploration and production of unconventional oil and gas reserves in remote locations present opportunities for specialized logistical solutions. Digitalization and the implementation of smart technologies offer avenues for enhanced efficiency, predictive analytics, and improved customer service. The market is also seeing opportunities in the development of multimodal logistics hubs that seamlessly integrate various transport modes for optimal energy delivery. The estimated market opportunity from new energy technologies alone could exceed $500 billion by 2033.
Major Players in the Energy Logistics Market Ecosystem
- Maersk
- DHL
- ExxonMobil
- Kuehne + Nagel
- C H Robinson
- COSCO Shipping Lines
- Chevron
- Mediterranean Shipping Company (MSC)
- BP
- TransCanada
- 7 Other Companies
Key Developments in Energy Logistics Market Industry
- 2023/07: Maersk announces expansion of its cold chain logistics services, crucial for the transportation of temperature-sensitive energy products.
- 2023/05: DHL invests in a fleet of electric trucks to enhance sustainability in its last-mile energy delivery operations.
- 2023/04: ExxonMobil pilots an AI-driven platform to optimize its global oil and gas supply chain, reducing transit times by an estimated 8%.
- 2023/03: Kuehne + Nagel acquires a specialized logistics firm focusing on renewable energy project cargo, strengthening its capabilities in this segment.
- 2023/02: C H Robinson enhances its intermodal solutions for energy commodity transportation, improving cost-effectiveness for clients.
- 2023/01: COSCO Shipping Lines expands its tanker fleet to meet the growing demand for global oil and gas transport.
- 2022/12: Mediterranean Shipping Company (MSC) deploys new, larger container vessels, increasing capacity for energy-related equipment.
- 2022/11: Chevron announces a strategic partnership for developing advanced biofuels, requiring new logistics pathways.
- 2022/10: BP makes significant investments in hydrogen infrastructure, signaling a shift in its future logistics needs.
- 2022/09: TransCanada (now TC Energy) finalizes a major pipeline expansion, impacting the transportation of natural gas.
Strategic Energy Logistics Market Market Forecast
The strategic outlook for the energy logistics market is overwhelmingly positive, driven by ongoing global energy demand and the accelerating energy transition. Future growth catalysts include substantial investments in renewable energy infrastructure, the growing adoption of new energy technologies, and the continued importance of traditional oil and gas logistics. Companies that embrace digital transformation, enhance their sustainable logistics offerings, and adapt to evolving regulatory landscapes will be best positioned for success. The market's potential is further bolstered by emerging economies' increasing energy needs and the development of more efficient and resilient supply chains. The overall market is projected to reach over $2,500 billion by 2033, with a strong emphasis on innovative and sustainable logistics solutions.
Energy Logistics Market Segmentation
-
1. Application
- 1.1. Oil & Gas
- 1.2. Renewable Energy
- 1.3. Power Generation
- 1.4. Energy Mining
-
2. End-User
- 2.1. Government Sector
- 2.2. Private Sector
-
3. Mode of Transport
- 3.1. Railways
- 3.2. Airways
- 3.3. Roadways
- 3.4. Waterways
Energy Logistics Market Segmentation By Geography
-
1. North America
- 1.1. United States
- 1.2. Canada
- 1.3. Mexico
-
2. South America
- 2.1. Brazil
- 2.2. Argentina
- 2.3. Rest of South America
-
3. Europe
- 3.1. United Kingdom
- 3.2. Germany
- 3.3. France
- 3.4. Italy
- 3.5. Spain
- 3.6. Russia
- 3.7. Benelux
- 3.8. Nordics
- 3.9. Rest of Europe
-
4. Middle East & Africa
- 4.1. Turkey
- 4.2. Israel
- 4.3. GCC
- 4.4. North Africa
- 4.5. South Africa
- 4.6. Rest of Middle East & Africa
-
5. Asia Pacific
- 5.1. China
- 5.2. India
- 5.3. Japan
- 5.4. South Korea
- 5.5. ASEAN
- 5.6. Oceania
- 5.7. Rest of Asia Pacific
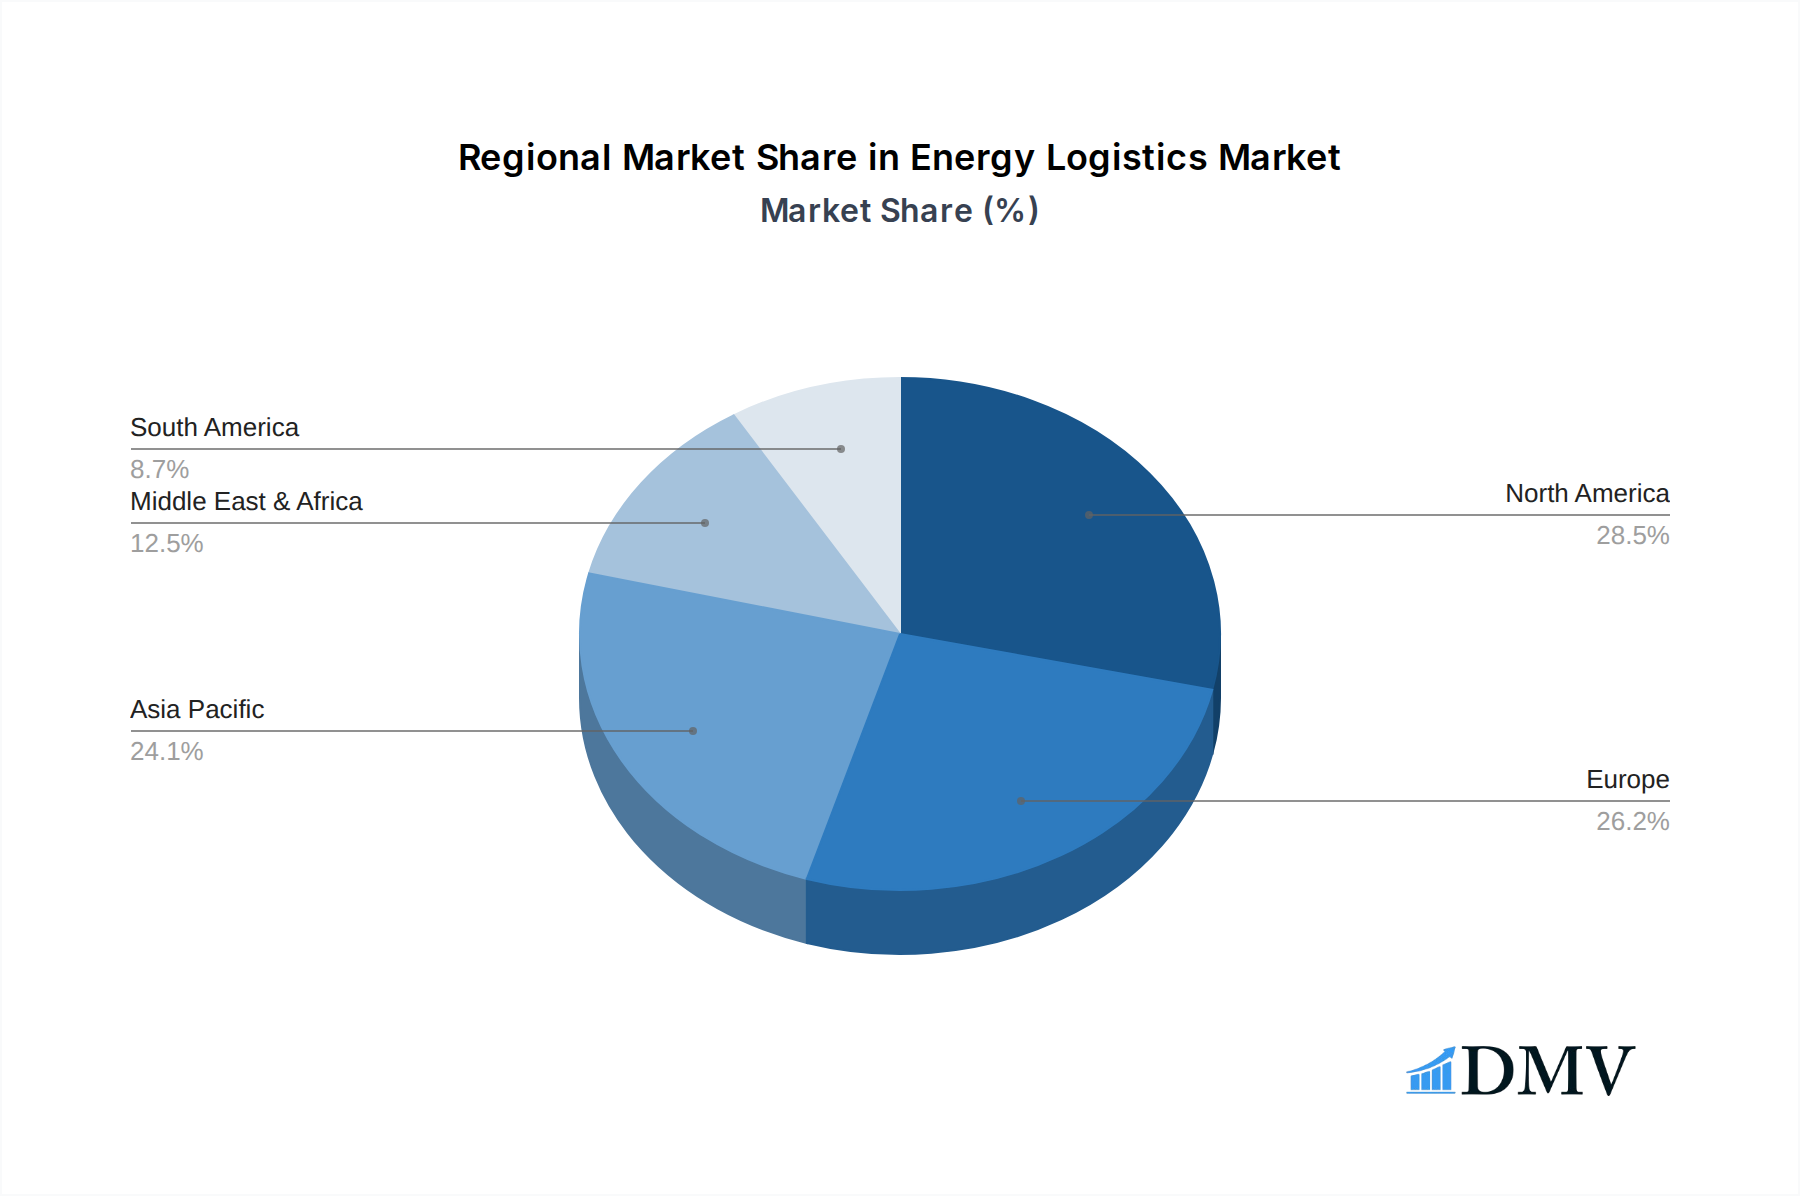
Energy Logistics Market Regional Market Share
Geographic Coverage of Energy Logistics Market
Energy Logistics Market REPORT HIGHLIGHTS
| Aspects | Details |
|---|---|
| Study Period | 2020-2034 |
| Base Year | 2025 |
| Estimated Year | 2026 |
| Forecast Period | 2026-2034 |
| Historical Period | 2020-2025 |
| Growth Rate | CAGR of 17.9% from 2020-2034 |
| Segmentation |
|
Table of Contents
- 1. Introduction
- 1.1. Research Scope
- 1.2. Market Segmentation
- 1.3. Research Objective
- 1.4. Definitions and Assumptions
- 2. Executive Summary
- 2.1. Market Snapshot
- 3. Market Dynamics
- 3.1. Market Drivers
- 3.2. Market Restrains
- 3.3. Market Trends
- 3.4. Market Opportunities
- 4. Market Factor Analysis
- 4.1. Porters Five Forces
- 4.1.1. Bargaining Power of Suppliers
- 4.1.2. Bargaining Power of Buyers
- 4.1.3. Threat of New Entrants
- 4.1.4. Threat of Substitutes
- 4.1.5. Competitive Rivalry
- 4.2. PESTEL analysis
- 4.3. BCG Analysis
- 4.3.1. Stars (High Growth, High Market Share)
- 4.3.2. Cash Cows (Low Growth, High Market Share)
- 4.3.3. Question Mark (High Growth, Low Market Share)
- 4.3.4. Dogs (Low Growth, Low Market Share)
- 4.4. Ansoff Matrix Analysis
- 4.5. Supply Chain Analysis
- 4.6. Regulatory Landscape
- 4.7. Current Market Potential and Opportunity Assessment (TAM–SAM–SOM Framework)
- 4.8. DMV Analyst Note
- 4.1. Porters Five Forces
- 5. Market Analysis, Insights and Forecast 2021-2033
- 5.1. Market Analysis, Insights and Forecast - by Application
- 5.1.1. Oil & Gas
- 5.1.2. Renewable Energy
- 5.1.3. Power Generation
- 5.1.4. Energy Mining
- 5.2. Market Analysis, Insights and Forecast - by End-User
- 5.2.1. Government Sector
- 5.2.2. Private Sector
- 5.3. Market Analysis, Insights and Forecast - by Mode of Transport
- 5.3.1. Railways
- 5.3.2. Airways
- 5.3.3. Roadways
- 5.3.4. Waterways
- 5.4. Market Analysis, Insights and Forecast - by Region
- 5.4.1. North America
- 5.4.2. South America
- 5.4.3. Europe
- 5.4.4. Middle East & Africa
- 5.4.5. Asia Pacific
- 5.1. Market Analysis, Insights and Forecast - by Application
- 6. Global Energy Logistics Market Analysis, Insights and Forecast, 2021-2033
- 6.1. Market Analysis, Insights and Forecast - by Application
- 6.1.1. Oil & Gas
- 6.1.2. Renewable Energy
- 6.1.3. Power Generation
- 6.1.4. Energy Mining
- 6.2. Market Analysis, Insights and Forecast - by End-User
- 6.2.1. Government Sector
- 6.2.2. Private Sector
- 6.3. Market Analysis, Insights and Forecast - by Mode of Transport
- 6.3.1. Railways
- 6.3.2. Airways
- 6.3.3. Roadways
- 6.3.4. Waterways
- 6.1. Market Analysis, Insights and Forecast - by Application
- 7. North America Energy Logistics Market Analysis, Insights and Forecast, 2020-2032
- 7.1. Market Analysis, Insights and Forecast - by Application
- 7.1.1. Oil & Gas
- 7.1.2. Renewable Energy
- 7.1.3. Power Generation
- 7.1.4. Energy Mining
- 7.2. Market Analysis, Insights and Forecast - by End-User
- 7.2.1. Government Sector
- 7.2.2. Private Sector
- 7.3. Market Analysis, Insights and Forecast - by Mode of Transport
- 7.3.1. Railways
- 7.3.2. Airways
- 7.3.3. Roadways
- 7.3.4. Waterways
- 7.1. Market Analysis, Insights and Forecast - by Application
- 8. South America Energy Logistics Market Analysis, Insights and Forecast, 2020-2032
- 8.1. Market Analysis, Insights and Forecast - by Application
- 8.1.1. Oil & Gas
- 8.1.2. Renewable Energy
- 8.1.3. Power Generation
- 8.1.4. Energy Mining
- 8.2. Market Analysis, Insights and Forecast - by End-User
- 8.2.1. Government Sector
- 8.2.2. Private Sector
- 8.3. Market Analysis, Insights and Forecast - by Mode of Transport
- 8.3.1. Railways
- 8.3.2. Airways
- 8.3.3. Roadways
- 8.3.4. Waterways
- 8.1. Market Analysis, Insights and Forecast - by Application
- 9. Europe Energy Logistics Market Analysis, Insights and Forecast, 2020-2032
- 9.1. Market Analysis, Insights and Forecast - by Application
- 9.1.1. Oil & Gas
- 9.1.2. Renewable Energy
- 9.1.3. Power Generation
- 9.1.4. Energy Mining
- 9.2. Market Analysis, Insights and Forecast - by End-User
- 9.2.1. Government Sector
- 9.2.2. Private Sector
- 9.3. Market Analysis, Insights and Forecast - by Mode of Transport
- 9.3.1. Railways
- 9.3.2. Airways
- 9.3.3. Roadways
- 9.3.4. Waterways
- 9.1. Market Analysis, Insights and Forecast - by Application
- 10. Middle East & Africa Energy Logistics Market Analysis, Insights and Forecast, 2020-2032
- 10.1. Market Analysis, Insights and Forecast - by Application
- 10.1.1. Oil & Gas
- 10.1.2. Renewable Energy
- 10.1.3. Power Generation
- 10.1.4. Energy Mining
- 10.2. Market Analysis, Insights and Forecast - by End-User
- 10.2.1. Government Sector
- 10.2.2. Private Sector
- 10.3. Market Analysis, Insights and Forecast - by Mode of Transport
- 10.3.1. Railways
- 10.3.2. Airways
- 10.3.3. Roadways
- 10.3.4. Waterways
- 10.1. Market Analysis, Insights and Forecast - by Application
- 11. Asia Pacific Energy Logistics Market Analysis, Insights and Forecast, 2020-2032
- 11.1. Market Analysis, Insights and Forecast - by Application
- 11.1.1. Oil & Gas
- 11.1.2. Renewable Energy
- 11.1.3. Power Generation
- 11.1.4. Energy Mining
- 11.2. Market Analysis, Insights and Forecast - by End-User
- 11.2.1. Government Sector
- 11.2.2. Private Sector
- 11.3. Market Analysis, Insights and Forecast - by Mode of Transport
- 11.3.1. Railways
- 11.3.2. Airways
- 11.3.3. Roadways
- 11.3.4. Waterways
- 11.1. Market Analysis, Insights and Forecast - by Application
- 12. Competitive Analysis
- 12.1. Company Profiles
- 12.1.1 Maersk
- 12.1.1.1. Company Overview
- 12.1.1.2. Products
- 12.1.1.3. Company Financials
- 12.1.1.4. SWOT Analysis
- 12.1.2 DHL
- 12.1.2.1. Company Overview
- 12.1.2.2. Products
- 12.1.2.3. Company Financials
- 12.1.2.4. SWOT Analysis
- 12.1.3 ExxonMobil
- 12.1.3.1. Company Overview
- 12.1.3.2. Products
- 12.1.3.3. Company Financials
- 12.1.3.4. SWOT Analysis
- 12.1.4 Kuehne + Nagel
- 12.1.4.1. Company Overview
- 12.1.4.2. Products
- 12.1.4.3. Company Financials
- 12.1.4.4. SWOT Analysis
- 12.1.5 C H Robinson
- 12.1.5.1. Company Overview
- 12.1.5.2. Products
- 12.1.5.3. Company Financials
- 12.1.5.4. SWOT Analysis
- 12.1.6 COSCO Shipping Lines
- 12.1.6.1. Company Overview
- 12.1.6.2. Products
- 12.1.6.3. Company Financials
- 12.1.6.4. SWOT Analysis
- 12.1.7 Chevron
- 12.1.7.1. Company Overview
- 12.1.7.2. Products
- 12.1.7.3. Company Financials
- 12.1.7.4. SWOT Analysis
- 12.1.8 Mediterranean Shipping Company (MSC)
- 12.1.8.1. Company Overview
- 12.1.8.2. Products
- 12.1.8.3. Company Financials
- 12.1.8.4. SWOT Analysis
- 12.1.9 BP
- 12.1.9.1. Company Overview
- 12.1.9.2. Products
- 12.1.9.3. Company Financials
- 12.1.9.4. SWOT Analysis
- 12.1.10 TransCanada**List Not Exhaustive 7 3 Other Companie
- 12.1.10.1. Company Overview
- 12.1.10.2. Products
- 12.1.10.3. Company Financials
- 12.1.10.4. SWOT Analysis
- 12.1.1 Maersk
- 12.2. Market Entropy
- 12.2.1 Company's Key Areas Served
- 12.2.2 Recent Developments
- 12.3. Company Market Share Analysis 2025
- 12.3.1 Top 5 Companies Market Share Analysis
- 12.3.2 Top 3 Companies Market Share Analysis
- 12.4. List of Potential Customers
- 13. Research Methodology
List of Figures
- Figure 1: Global Energy Logistics Market Revenue Breakdown (billion, %) by Region 2025 & 2033
- Figure 2: North America Energy Logistics Market Revenue (billion), by Application 2025 & 2033
- Figure 3: North America Energy Logistics Market Revenue Share (%), by Application 2025 & 2033
- Figure 4: North America Energy Logistics Market Revenue (billion), by End-User 2025 & 2033
- Figure 5: North America Energy Logistics Market Revenue Share (%), by End-User 2025 & 2033
- Figure 6: North America Energy Logistics Market Revenue (billion), by Mode of Transport 2025 & 2033
- Figure 7: North America Energy Logistics Market Revenue Share (%), by Mode of Transport 2025 & 2033
- Figure 8: North America Energy Logistics Market Revenue (billion), by Country 2025 & 2033
- Figure 9: North America Energy Logistics Market Revenue Share (%), by Country 2025 & 2033
- Figure 10: South America Energy Logistics Market Revenue (billion), by Application 2025 & 2033
- Figure 11: South America Energy Logistics Market Revenue Share (%), by Application 2025 & 2033
- Figure 12: South America Energy Logistics Market Revenue (billion), by End-User 2025 & 2033
- Figure 13: South America Energy Logistics Market Revenue Share (%), by End-User 2025 & 2033
- Figure 14: South America Energy Logistics Market Revenue (billion), by Mode of Transport 2025 & 2033
- Figure 15: South America Energy Logistics Market Revenue Share (%), by Mode of Transport 2025 & 2033
- Figure 16: South America Energy Logistics Market Revenue (billion), by Country 2025 & 2033
- Figure 17: South America Energy Logistics Market Revenue Share (%), by Country 2025 & 2033
- Figure 18: Europe Energy Logistics Market Revenue (billion), by Application 2025 & 2033
- Figure 19: Europe Energy Logistics Market Revenue Share (%), by Application 2025 & 2033
- Figure 20: Europe Energy Logistics Market Revenue (billion), by End-User 2025 & 2033
- Figure 21: Europe Energy Logistics Market Revenue Share (%), by End-User 2025 & 2033
- Figure 22: Europe Energy Logistics Market Revenue (billion), by Mode of Transport 2025 & 2033
- Figure 23: Europe Energy Logistics Market Revenue Share (%), by Mode of Transport 2025 & 2033
- Figure 24: Europe Energy Logistics Market Revenue (billion), by Country 2025 & 2033
- Figure 25: Europe Energy Logistics Market Revenue Share (%), by Country 2025 & 2033
- Figure 26: Middle East & Africa Energy Logistics Market Revenue (billion), by Application 2025 & 2033
- Figure 27: Middle East & Africa Energy Logistics Market Revenue Share (%), by Application 2025 & 2033
- Figure 28: Middle East & Africa Energy Logistics Market Revenue (billion), by End-User 2025 & 2033
- Figure 29: Middle East & Africa Energy Logistics Market Revenue Share (%), by End-User 2025 & 2033
- Figure 30: Middle East & Africa Energy Logistics Market Revenue (billion), by Mode of Transport 2025 & 2033
- Figure 31: Middle East & Africa Energy Logistics Market Revenue Share (%), by Mode of Transport 2025 & 2033
- Figure 32: Middle East & Africa Energy Logistics Market Revenue (billion), by Country 2025 & 2033
- Figure 33: Middle East & Africa Energy Logistics Market Revenue Share (%), by Country 2025 & 2033
- Figure 34: Asia Pacific Energy Logistics Market Revenue (billion), by Application 2025 & 2033
- Figure 35: Asia Pacific Energy Logistics Market Revenue Share (%), by Application 2025 & 2033
- Figure 36: Asia Pacific Energy Logistics Market Revenue (billion), by End-User 2025 & 2033
- Figure 37: Asia Pacific Energy Logistics Market Revenue Share (%), by End-User 2025 & 2033
- Figure 38: Asia Pacific Energy Logistics Market Revenue (billion), by Mode of Transport 2025 & 2033
- Figure 39: Asia Pacific Energy Logistics Market Revenue Share (%), by Mode of Transport 2025 & 2033
- Figure 40: Asia Pacific Energy Logistics Market Revenue (billion), by Country 2025 & 2033
- Figure 41: Asia Pacific Energy Logistics Market Revenue Share (%), by Country 2025 & 2033
List of Tables
- Table 1: Global Energy Logistics Market Revenue billion Forecast, by Application 2020 & 2033
- Table 2: Global Energy Logistics Market Revenue billion Forecast, by End-User 2020 & 2033
- Table 3: Global Energy Logistics Market Revenue billion Forecast, by Mode of Transport 2020 & 2033
- Table 4: Global Energy Logistics Market Revenue billion Forecast, by Region 2020 & 2033
- Table 5: Global Energy Logistics Market Revenue billion Forecast, by Application 2020 & 2033
- Table 6: Global Energy Logistics Market Revenue billion Forecast, by End-User 2020 & 2033
- Table 7: Global Energy Logistics Market Revenue billion Forecast, by Mode of Transport 2020 & 2033
- Table 8: Global Energy Logistics Market Revenue billion Forecast, by Country 2020 & 2033
- Table 9: United States Energy Logistics Market Revenue (billion) Forecast, by Application 2020 & 2033
- Table 10: Canada Energy Logistics Market Revenue (billion) Forecast, by Application 2020 & 2033
- Table 11: Mexico Energy Logistics Market Revenue (billion) Forecast, by Application 2020 & 2033
- Table 12: Global Energy Logistics Market Revenue billion Forecast, by Application 2020 & 2033
- Table 13: Global Energy Logistics Market Revenue billion Forecast, by End-User 2020 & 2033
- Table 14: Global Energy Logistics Market Revenue billion Forecast, by Mode of Transport 2020 & 2033
- Table 15: Global Energy Logistics Market Revenue billion Forecast, by Country 2020 & 2033
- Table 16: Brazil Energy Logistics Market Revenue (billion) Forecast, by Application 2020 & 2033
- Table 17: Argentina Energy Logistics Market Revenue (billion) Forecast, by Application 2020 & 2033
- Table 18: Rest of South America Energy Logistics Market Revenue (billion) Forecast, by Application 2020 & 2033
- Table 19: Global Energy Logistics Market Revenue billion Forecast, by Application 2020 & 2033
- Table 20: Global Energy Logistics Market Revenue billion Forecast, by End-User 2020 & 2033
- Table 21: Global Energy Logistics Market Revenue billion Forecast, by Mode of Transport 2020 & 2033
- Table 22: Global Energy Logistics Market Revenue billion Forecast, by Country 2020 & 2033
- Table 23: United Kingdom Energy Logistics Market Revenue (billion) Forecast, by Application 2020 & 2033
- Table 24: Germany Energy Logistics Market Revenue (billion) Forecast, by Application 2020 & 2033
- Table 25: France Energy Logistics Market Revenue (billion) Forecast, by Application 2020 & 2033
- Table 26: Italy Energy Logistics Market Revenue (billion) Forecast, by Application 2020 & 2033
- Table 27: Spain Energy Logistics Market Revenue (billion) Forecast, by Application 2020 & 2033
- Table 28: Russia Energy Logistics Market Revenue (billion) Forecast, by Application 2020 & 2033
- Table 29: Benelux Energy Logistics Market Revenue (billion) Forecast, by Application 2020 & 2033
- Table 30: Nordics Energy Logistics Market Revenue (billion) Forecast, by Application 2020 & 2033
- Table 31: Rest of Europe Energy Logistics Market Revenue (billion) Forecast, by Application 2020 & 2033
- Table 32: Global Energy Logistics Market Revenue billion Forecast, by Application 2020 & 2033
- Table 33: Global Energy Logistics Market Revenue billion Forecast, by End-User 2020 & 2033
- Table 34: Global Energy Logistics Market Revenue billion Forecast, by Mode of Transport 2020 & 2033
- Table 35: Global Energy Logistics Market Revenue billion Forecast, by Country 2020 & 2033
- Table 36: Turkey Energy Logistics Market Revenue (billion) Forecast, by Application 2020 & 2033
- Table 37: Israel Energy Logistics Market Revenue (billion) Forecast, by Application 2020 & 2033
- Table 38: GCC Energy Logistics Market Revenue (billion) Forecast, by Application 2020 & 2033
- Table 39: North Africa Energy Logistics Market Revenue (billion) Forecast, by Application 2020 & 2033
- Table 40: South Africa Energy Logistics Market Revenue (billion) Forecast, by Application 2020 & 2033
- Table 41: Rest of Middle East & Africa Energy Logistics Market Revenue (billion) Forecast, by Application 2020 & 2033
- Table 42: Global Energy Logistics Market Revenue billion Forecast, by Application 2020 & 2033
- Table 43: Global Energy Logistics Market Revenue billion Forecast, by End-User 2020 & 2033
- Table 44: Global Energy Logistics Market Revenue billion Forecast, by Mode of Transport 2020 & 2033
- Table 45: Global Energy Logistics Market Revenue billion Forecast, by Country 2020 & 2033
- Table 46: China Energy Logistics Market Revenue (billion) Forecast, by Application 2020 & 2033
- Table 47: India Energy Logistics Market Revenue (billion) Forecast, by Application 2020 & 2033
- Table 48: Japan Energy Logistics Market Revenue (billion) Forecast, by Application 2020 & 2033
- Table 49: South Korea Energy Logistics Market Revenue (billion) Forecast, by Application 2020 & 2033
- Table 50: ASEAN Energy Logistics Market Revenue (billion) Forecast, by Application 2020 & 2033
- Table 51: Oceania Energy Logistics Market Revenue (billion) Forecast, by Application 2020 & 2033
- Table 52: Rest of Asia Pacific Energy Logistics Market Revenue (billion) Forecast, by Application 2020 & 2033
Frequently Asked Questions
1. What is the projected Compound Annual Growth Rate (CAGR) of the Energy Logistics Market?
The projected CAGR is approximately 17.9%.
2. Which companies are prominent players in the Energy Logistics Market?
Key companies in the market include Maersk, DHL, ExxonMobil, Kuehne + Nagel, C H Robinson, COSCO Shipping Lines, Chevron, Mediterranean Shipping Company (MSC), BP, TransCanada**List Not Exhaustive 7 3 Other Companie.
3. What are the main segments of the Energy Logistics Market?
The market segments include Application, End-User, Mode of Transport.
4. Can you provide details about the market size?
The market size is estimated to be USD 477.2 billion as of 2022.
5. What are some drivers contributing to market growth?
Industrial Growth Supporting the Market; Global Trade Driving the Market.
6. What are the notable trends driving market growth?
The Oil & Gas Segment is booming.
7. Are there any restraints impacting market growth?
Compliance Challenges Affecting the Market; Limited Infrastructure Inhibiting the Market.
8. Can you provide examples of recent developments in the market?
N/A
9. What pricing options are available for accessing the report?
Pricing options include single-user, multi-user, and enterprise licenses priced at USD 3800, USD 4500, and USD 5800 respectively.
10. Is the market size provided in terms of value or volume?
The market size is provided in terms of value, measured in billion.
11. Are there any specific market keywords associated with the report?
Yes, the market keyword associated with the report is "Energy Logistics Market," which aids in identifying and referencing the specific market segment covered.
12. How do I determine which pricing option suits my needs best?
The pricing options vary based on user requirements and access needs. Individual users may opt for single-user licenses, while businesses requiring broader access may choose multi-user or enterprise licenses for cost-effective access to the report.
13. Are there any additional resources or data provided in the Energy Logistics Market report?
While the report offers comprehensive insights, it's advisable to review the specific contents or supplementary materials provided to ascertain if additional resources or data are available.
14. How can I stay updated on further developments or reports in the Energy Logistics Market?
To stay informed about further developments, trends, and reports in the Energy Logistics Market, consider subscribing to industry newsletters, following relevant companies and organizations, or regularly checking reputable industry news sources and publications.
Methodology
Step 1 - Identification of Relevant Samples Size from Population Database


Step 2 - Approaches for Defining Global Market Size (Value, Volume* & Price*)

Note*: In applicable scenarios
Step 3 - Data Sources
Primary Research
- Web Analytics
- Survey Reports
- Research Institute
- Latest Research Reports
- Opinion Leaders
Secondary Research
- Annual Reports
- White Paper
- Latest Press Release
- Industry Association
- Paid Database
- Investor Presentations

Step 4 - Data Triangulation
Involves using different sources of information in order to increase the validity of a study
These sources are likely to be stakeholders in a program - participants, other researchers, program staff, other community members, and so on.
Then we put all data in single framework & apply various statistical tools to find out the dynamic on the market.
During the analysis stage, feedback from the stakeholder groups would be compared to determine areas of agreement as well as areas of divergence