

Key Insights
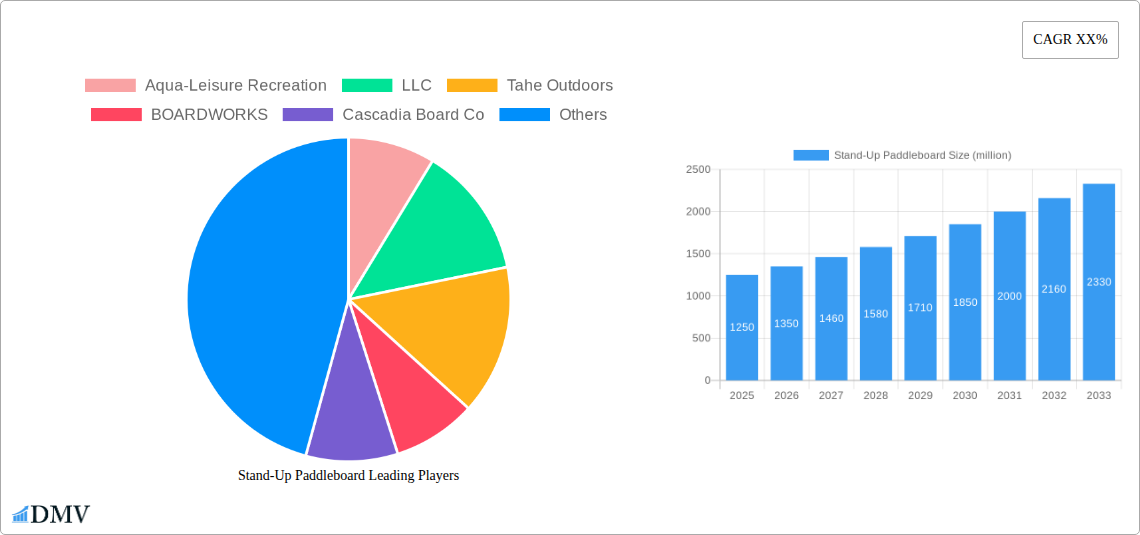
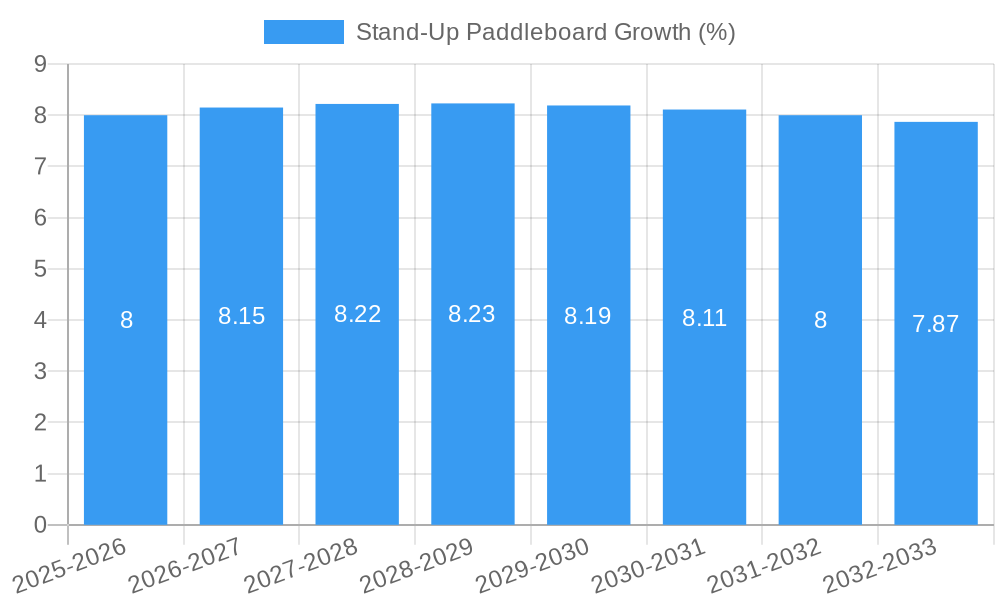
The global stand-up paddleboard (SUP) market is poised for substantial growth, currently valued at approximately $1.2 billion and projected to reach over $2.5 billion by 2033, exhibiting a Compound Annual Growth Rate (CAGR) of roughly 8%. This expansion is fueled by a growing recreational water sports trend, increased awareness of the health benefits associated with paddleboarding, and the sport's accessibility across various age groups, from adults seeking fitness to children enjoying outdoor activities. Key market drivers include the rising popularity of SUP yoga, touring, and racing, alongside innovation in board materials and designs, such as the increased adoption of lightweight and durable epoxy and fiberglass models. The market is segmented by application, with adult use dominating, and by type, where PVC boards offer affordability and portability, while epoxy and fiberglass boards cater to performance-oriented users.
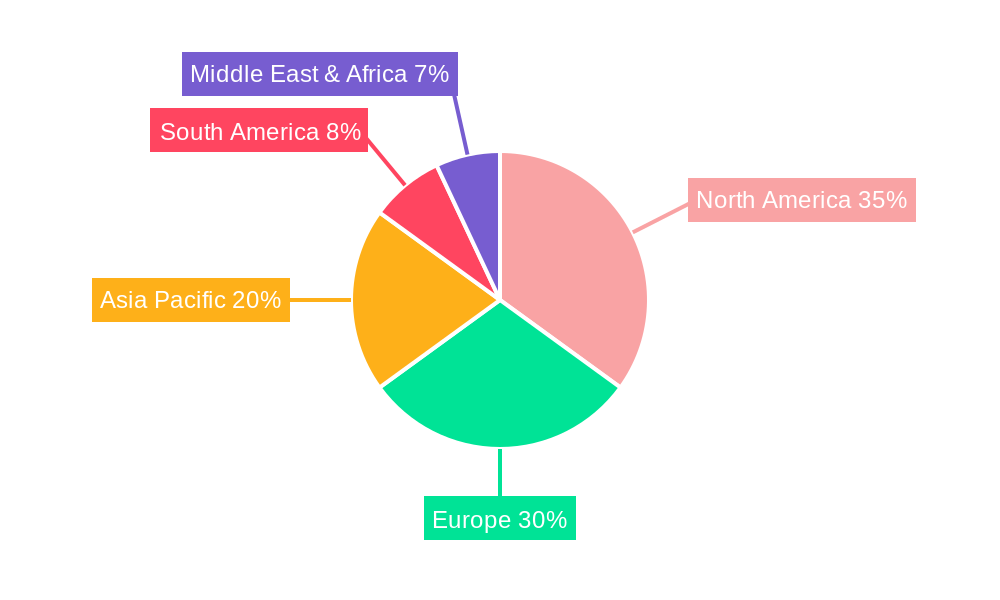
Geographically, North America currently holds a significant market share due to strong consumer interest in outdoor activities and a well-established water sports infrastructure, particularly in the United States and Canada. Europe also represents a substantial market, driven by its extensive coastlines, lakes, and rivers, and a growing eco-conscious population embracing low-impact water sports. The Asia Pacific region is expected to witness the fastest growth, propelled by increasing disposable incomes, a burgeoning middle class, and growing adoption of international leisure trends in countries like China and India. Restraints to market growth include the seasonal nature of the sport in certain regions and the initial cost of equipment for some consumers, although the increasing availability of inflatable SUPs is mitigating this factor. Emerging trends like electric SUPs and the integration of smart technology in paddleboards are also set to shape the future market landscape.
Stand-Up Paddleboard Market Composition & Trends
The global Stand-Up Paddleboard market, valued at an estimated xxx million in 2025, is characterized by a moderate level of concentration, with key players like Aqua-Leisure Recreation, LLC, Tahe Outdoors, BOARDWORKS, Cascadia Board Co, Starboard, SUP ATX LLC, SURFTECH, LLC, Sea Eagle Boats, Inc., Imagine Nation Sports, LLC, Naish International, Bluefin SUP, Goosehill, Atoll Board Company, C4 Waterman, NRS, YOLO Boards & Bikes, Mistral Watersport, Sun Dolphin Boats, Red Paddle Co, LAIRDSTANDUP, Tower Paddle Boards, THURSO SURF, and Decathlon carving out significant market share. Innovation remains a critical catalyst, driven by advancements in materials and design, particularly in PVC and Epoxy paddleboards. Regulatory landscapes are generally supportive, with a focus on safety and environmental protection, though regional variations exist. Substitute products, such as kayaks and traditional surfboards, offer some competitive pressure. End-user profiles are diverse, encompassing adults and children, with a growing segment of recreational users and athletes. Mergers and acquisitions (M&A) activity, with estimated deal values of xxx million historically, have played a role in market consolidation, shaping competitive dynamics.
- Market Share Distribution (2025): Top 5 players hold an estimated xx% of the market.
- M&A Deal Values (Historical, 2019-2024): Averaged xxx million annually.
- Innovation Focus: Lightweight materials, improved stability, and durable constructions.
- Regulatory Influence: Primarily focused on water safety and environmental impact guidelines.
Stand-Up Paddleboard Industry Evolution
The Stand-Up Paddleboard industry has witnessed remarkable growth and transformation over the historical period of 2019–2024, setting a strong foundation for future expansion. The market has evolved from a niche water sport to a mainstream recreational activity, driven by increased accessibility, a growing awareness of health and wellness benefits, and the inherent versatility of paddleboarding. Technological advancements have been instrumental in this evolution. The development of inflatable stand-up paddleboards (ISUPs) made from robust PVC materials has dramatically lowered the barrier to entry, offering portability and ease of storage, thereby democratizing the sport. Simultaneously, advancements in epoxy and fiberglass construction have continued to cater to performance-oriented users, including racers and surfers, offering superior rigidity and speed.
Consumer demand has shifted significantly, with a discernible trend towards eco-friendly and sustainable product options. This has spurred manufacturers to explore recycled materials and environmentally conscious production processes. The rise of social media has also played a pivotal role in popularizing paddleboarding, showcasing its appeal across various demographics and geographical locations. Consequently, the industry has observed consistent year-over-year growth rates, with the overall market projected to expand at a Compound Annual Growth Rate (CAGR) of xx% during the forecast period of 2025–2033. Adoption metrics have steadily increased, with participation rates soaring in coastal regions, lakes, and rivers worldwide. The introduction of specialized paddleboards for different applications, such as touring, yoga, fishing, and racing, has further broadened the market appeal and driven category-specific innovations. This dynamic evolution, fueled by technological ingenuity and changing consumer preferences, positions the stand-up paddleboard market for sustained and robust growth.
Leading Regions, Countries, or Segments in Stand-Up Paddleboard
The Adult application segment is demonstrably leading the global Stand-Up Paddleboard market, showcasing robust dominance across key regions and countries. This supremacy is propelled by a confluence of factors, including a higher disposable income for recreational activities, a growing emphasis on fitness and outdoor pursuits among adults, and the widespread appeal of paddleboarding as a low-impact yet engaging form of exercise. Geographically, North America and Europe currently represent the most significant markets, with countries like the United States, Canada, Germany, and the United Kingdom exhibiting high adoption rates. The PVC type of paddleboard, particularly the inflatable variants, is also a major driver of this leadership within the adult segment due to its affordability, portability, and ease of use, making it accessible to a broader demographic.
- Key Drivers for Adult Segment Dominance:
- Health & Wellness Trend: Increasing global focus on physical fitness and mental well-being.
- Disposable Income: Higher spending capacity of the adult demographic on recreational hobbies.
- Accessibility & Versatility: Paddleboarding's adaptability to various water bodies and fitness levels.
- Marketing & Popularity: Extensive media coverage, influencer endorsements, and community events.
In terms of product types, the PVC segment, primarily encompassing inflatable stand-up paddleboards (ISUPs), enjoys substantial traction. This is largely due to its cost-effectiveness, making it a preferred choice for beginners and casual users. The ease of transportation and storage offered by inflatable boards further amplifies their appeal, especially in urban or space-constrained environments. However, the Epoxy and Fiber Glass segments are crucial for performance-oriented users and are experiencing steady growth, driven by advancements in materials and construction techniques that offer enhanced durability, rigidity, and speed. The Child application segment, while smaller in market share, is a significant growth area, with manufacturers increasingly offering child-specific designs and safety features to cater to families.
- Dominance Factors in North America & Europe:
- Well-Established Outdoor Recreation Infrastructure: Abundance of lakes, rivers, and coastal areas suitable for paddleboarding.
- High Consumer Spending on Leisure Activities: Strong economies supporting discretionary spending.
- Supportive Government Policies: Initiatives promoting outdoor recreation and water sports.
- Developed Retail & Distribution Networks: Easy availability of paddleboard products.
Stand-Up Paddleboard Product Innovations
The Stand-Up Paddleboard market is abuzz with innovative product developments aimed at enhancing user experience and expanding applications. Manufacturers are introducing lighter and more durable constructions using advanced PVC and composite materials, significantly improving portability and performance. Innovations include improved fin systems for better tracking, integrated storage solutions for longer touring trips, and enhanced deck padding for increased comfort and stability, particularly for yoga and fishing. The emergence of specialized designs, such as rigid kayaks with paddleboard capabilities and highly maneuverable boards for whitewater, showcases the industry's drive to cater to niche markets and diverse user needs. These advancements are not only improving performance metrics like speed and stability but also broadening the appeal of paddleboarding across a wider range of activities and skill levels.
Propelling Factors for Stand-Up Paddleboard Growth
Several key factors are propelling the global Stand-Up Paddleboard market forward. The escalating global interest in health and wellness, coupled with a desire for outdoor recreational activities, forms a primary growth driver. Technological advancements, particularly in the development of lightweight, durable, and inflatable PVC paddleboards, have made the sport more accessible and affordable. Economic growth in emerging markets is also contributing, increasing disposable income available for leisure pursuits. Furthermore, supportive government initiatives promoting outdoor recreation and water sports infrastructure in various regions are indirectly fueling market expansion.
- Technological Advancements: Innovations in PVC and composite materials, leading to lighter, more durable, and portable designs.
- Health & Wellness Trends: Growing consumer focus on physical fitness and outdoor activities.
- Economic Factors: Rising disposable incomes in developing economies.
- Government Support: Investments in recreational infrastructure and promotion of water sports.
Obstacles in the Stand-Up Paddleboard Market
Despite its robust growth, the Stand-Up Paddleboard market faces certain obstacles that can impede its expansion. Supply chain disruptions, particularly those impacting the availability of raw materials like specialized PVC and composites, can lead to increased production costs and lead times, impacting product availability and pricing. Intense competition among a growing number of manufacturers, including established brands and new entrants, can lead to price wars and reduced profit margins, especially for smaller players. Furthermore, seasonal demand fluctuations in certain regions, where paddleboarding is primarily a summer activity, can create revenue volatility. Lastly, regulatory hurdles related to water access, safety standards, and environmental impact in specific locations can pose challenges for both consumers and manufacturers.
- Supply Chain Vulnerabilities: Fluctuations in raw material costs and availability.
- Competitive Pressures: Price sensitivity and market saturation in certain segments.
- Seasonality: Geographical variations in demand due to weather patterns.
- Regulatory Complexities: Navigating diverse water usage policies and safety mandates.
Future Opportunities in Stand-Up Paddleboard
The Stand-Up Paddleboard market is ripe with future opportunities, driven by evolving consumer trends and technological advancements. The increasing demand for sustainable and eco-friendly products presents a significant avenue for innovation, with opportunities in developing boards made from recycled materials and utilizing environmentally conscious manufacturing processes. The growth of adventure tourism and the desire for unique outdoor experiences are creating opportunities for specialized paddleboards for touring, expedition, and even overnight camping trips. Furthermore, the continued development of smart paddleboards with integrated GPS, fitness tracking, and safety features holds considerable potential. Expansion into emerging markets with growing middle classes and increasing interest in outdoor recreation also offers substantial untapped potential for market penetration.
- Sustainable Product Development: Focus on eco-friendly materials and manufacturing.
- Adventure & Expedition Paddleboarding: Catering to longer-distance and multi-day trips.
- Smart Technology Integration: Incorporating digital features for enhanced user experience.
- Emerging Market Penetration: Tapping into new geographical regions with growing consumer interest.
Major Players in the Stand-Up Paddleboard Ecosystem
- Aqua-Leisure Recreation, LLC
- Tahe Outdoors
- BOARDWORKS
- Cascadia Board Co
- Starboard
- SUP ATX LLC
- SURFTECH, LLC
- Sea Eagle Boats, inc
- Imagine Nation Sports, LLC
- Naish International
- Bluefin SUP
- Goosehill
- Atoll Board Company
- C4 Waterman
- NRS
- YOLO Boards & Bikes
- Mistral Watersport
- Sun Dolphin Boats
- Red Paddle Co
- LAIRDSTANDUP
- Tower Paddle Boards
- THURSO SURF
- Decathlon
Key Developments in Stand-Up Paddleboard Industry
- 2023: Launch of advanced lightweight composite materials for premium epoxy paddleboards, enhancing speed and maneuverability.
- 2023: Increased focus on sustainable manufacturing processes and the use of recycled materials in PVC inflatable paddleboards.
- 2022: Introduction of specialized paddleboards for fishing, featuring enhanced stability and rod holders.
- 2022: Growth in the popularity of guided paddleboard tours and adventure excursions in various tourist destinations.
- 2021: Significant advancements in inflatable technology, leading to more rigid and performance-oriented PVC paddleboards.
- 2020: Rise in paddleboard yoga and fitness classes, driving demand for stable and comfortable board designs.
- 2019: Expansion of the child segment with the introduction of smaller, lighter, and more user-friendly paddleboards for younger riders.
Strategic Stand-Up Paddleboard Market Forecast
The strategic outlook for the Stand-Up Paddleboard market remains exceptionally positive, driven by a combination of enduring growth catalysts and emerging opportunities. The persistent global trend towards health, wellness, and outdoor recreation will continue to fuel demand across all age groups. Innovations in materials science, particularly in PVC and composite construction, will lead to more affordable, durable, and high-performance paddleboards. The growing emphasis on sustainability will open new market segments for eco-friendly products. Furthermore, the expansion of adventure tourism and the potential for integration of smart technologies will create avenues for product differentiation and value-added services. The market is projected to experience sustained growth, with key regions and product types continuing to drive overall expansion.
Stand-Up Paddleboard Segmentation
-
1. Application
- 1.1. Aldult
- 1.2. Child
-
2. Types
- 2.1. PVC
- 2.2. EPOXY
- 2.3. Fiber Glass
- 2.4. Other
Stand-Up Paddleboard Segmentation By Geography
-
1. North America
- 1.1. United States
- 1.2. Canada
- 1.3. Mexico
-
2. South America
- 2.1. Brazil
- 2.2. Argentina
- 2.3. Rest of South America
-
3. Europe
- 3.1. United Kingdom
- 3.2. Germany
- 3.3. France
- 3.4. Italy
- 3.5. Spain
- 3.6. Russia
- 3.7. Benelux
- 3.8. Nordics
- 3.9. Rest of Europe
-
4. Middle East & Africa
- 4.1. Turkey
- 4.2. Israel
- 4.3. GCC
- 4.4. North Africa
- 4.5. South Africa
- 4.6. Rest of Middle East & Africa
-
5. Asia Pacific
- 5.1. China
- 5.2. India
- 5.3. Japan
- 5.4. South Korea
- 5.5. ASEAN
- 5.6. Oceania
- 5.7. Rest of Asia Pacific
Stand-Up Paddleboard REPORT HIGHLIGHTS
| Aspects | Details |
|---|---|
| Study Period | 2019-2033 |
| Base Year | 2024 |
| Estimated Year | 2025 |
| Forecast Period | 2025-2033 |
| Historical Period | 2019-2024 |
| Growth Rate | CAGR of XX% from 2019-2033 |
| Segmentation |
|
Table of Contents
- 1. Introduction
- 1.1. Research Scope
- 1.2. Market Segmentation
- 1.3. Research Methodology
- 1.4. Definitions and Assumptions
- 2. Executive Summary
- 2.1. Introduction
- 3. Market Dynamics
- 3.1. Introduction
- 3.2. Market Drivers
- 3.3. Market Restrains
- 3.4. Market Trends
- 4. Market Factor Analysis
- 4.1. Porters Five Forces
- 4.2. Supply/Value Chain
- 4.3. PESTEL analysis
- 4.4. Market Entropy
- 4.5. Patent/Trademark Analysis
- 5. Global Stand-Up Paddleboard Analysis, Insights and Forecast, 2019-2031
- 5.1. Market Analysis, Insights and Forecast - by Application
- 5.1.1. Aldult
- 5.1.2. Child
- 5.2. Market Analysis, Insights and Forecast - by Types
- 5.2.1. PVC
- 5.2.2. EPOXY
- 5.2.3. Fiber Glass
- 5.2.4. Other
- 5.3. Market Analysis, Insights and Forecast - by Region
- 5.3.1. North America
- 5.3.2. South America
- 5.3.3. Europe
- 5.3.4. Middle East & Africa
- 5.3.5. Asia Pacific
- 5.1. Market Analysis, Insights and Forecast - by Application
- 6. North America Stand-Up Paddleboard Analysis, Insights and Forecast, 2019-2031
- 6.1. Market Analysis, Insights and Forecast - by Application
- 6.1.1. Aldult
- 6.1.2. Child
- 6.2. Market Analysis, Insights and Forecast - by Types
- 6.2.1. PVC
- 6.2.2. EPOXY
- 6.2.3. Fiber Glass
- 6.2.4. Other
- 6.1. Market Analysis, Insights and Forecast - by Application
- 7. South America Stand-Up Paddleboard Analysis, Insights and Forecast, 2019-2031
- 7.1. Market Analysis, Insights and Forecast - by Application
- 7.1.1. Aldult
- 7.1.2. Child
- 7.2. Market Analysis, Insights and Forecast - by Types
- 7.2.1. PVC
- 7.2.2. EPOXY
- 7.2.3. Fiber Glass
- 7.2.4. Other
- 7.1. Market Analysis, Insights and Forecast - by Application
- 8. Europe Stand-Up Paddleboard Analysis, Insights and Forecast, 2019-2031
- 8.1. Market Analysis, Insights and Forecast - by Application
- 8.1.1. Aldult
- 8.1.2. Child
- 8.2. Market Analysis, Insights and Forecast - by Types
- 8.2.1. PVC
- 8.2.2. EPOXY
- 8.2.3. Fiber Glass
- 8.2.4. Other
- 8.1. Market Analysis, Insights and Forecast - by Application
- 9. Middle East & Africa Stand-Up Paddleboard Analysis, Insights and Forecast, 2019-2031
- 9.1. Market Analysis, Insights and Forecast - by Application
- 9.1.1. Aldult
- 9.1.2. Child
- 9.2. Market Analysis, Insights and Forecast - by Types
- 9.2.1. PVC
- 9.2.2. EPOXY
- 9.2.3. Fiber Glass
- 9.2.4. Other
- 9.1. Market Analysis, Insights and Forecast - by Application
- 10. Asia Pacific Stand-Up Paddleboard Analysis, Insights and Forecast, 2019-2031
- 10.1. Market Analysis, Insights and Forecast - by Application
- 10.1.1. Aldult
- 10.1.2. Child
- 10.2. Market Analysis, Insights and Forecast - by Types
- 10.2.1. PVC
- 10.2.2. EPOXY
- 10.2.3. Fiber Glass
- 10.2.4. Other
- 10.1. Market Analysis, Insights and Forecast - by Application
- 11. Competitive Analysis
- 11.1. Global Market Share Analysis 2024
- 11.2. Company Profiles
- 11.2.1 Aqua-Leisure Recreation
- 11.2.1.1. Overview
- 11.2.1.2. Products
- 11.2.1.3. SWOT Analysis
- 11.2.1.4. Recent Developments
- 11.2.1.5. Financials (Based on Availability)
- 11.2.2 LLC
- 11.2.2.1. Overview
- 11.2.2.2. Products
- 11.2.2.3. SWOT Analysis
- 11.2.2.4. Recent Developments
- 11.2.2.5. Financials (Based on Availability)
- 11.2.3 Tahe Outdoors
- 11.2.3.1. Overview
- 11.2.3.2. Products
- 11.2.3.3. SWOT Analysis
- 11.2.3.4. Recent Developments
- 11.2.3.5. Financials (Based on Availability)
- 11.2.4 BOARDWORKS
- 11.2.4.1. Overview
- 11.2.4.2. Products
- 11.2.4.3. SWOT Analysis
- 11.2.4.4. Recent Developments
- 11.2.4.5. Financials (Based on Availability)
- 11.2.5 Cascadia Board Co
- 11.2.5.1. Overview
- 11.2.5.2. Products
- 11.2.5.3. SWOT Analysis
- 11.2.5.4. Recent Developments
- 11.2.5.5. Financials (Based on Availability)
- 11.2.6 Starboard
- 11.2.6.1. Overview
- 11.2.6.2. Products
- 11.2.6.3. SWOT Analysis
- 11.2.6.4. Recent Developments
- 11.2.6.5. Financials (Based on Availability)
- 11.2.7 SUP ATX LLC
- 11.2.7.1. Overview
- 11.2.7.2. Products
- 11.2.7.3. SWOT Analysis
- 11.2.7.4. Recent Developments
- 11.2.7.5. Financials (Based on Availability)
- 11.2.8 SURFTECH
- 11.2.8.1. Overview
- 11.2.8.2. Products
- 11.2.8.3. SWOT Analysis
- 11.2.8.4. Recent Developments
- 11.2.8.5. Financials (Based on Availability)
- 11.2.9 LLC
- 11.2.9.1. Overview
- 11.2.9.2. Products
- 11.2.9.3. SWOT Analysis
- 11.2.9.4. Recent Developments
- 11.2.9.5. Financials (Based on Availability)
- 11.2.10 Sea Eagle Boats
- 11.2.10.1. Overview
- 11.2.10.2. Products
- 11.2.10.3. SWOT Analysis
- 11.2.10.4. Recent Developments
- 11.2.10.5. Financials (Based on Availability)
- 11.2.11 inc
- 11.2.11.1. Overview
- 11.2.11.2. Products
- 11.2.11.3. SWOT Analysis
- 11.2.11.4. Recent Developments
- 11.2.11.5. Financials (Based on Availability)
- 11.2.12 Imagine Nation Sports
- 11.2.12.1. Overview
- 11.2.12.2. Products
- 11.2.12.3. SWOT Analysis
- 11.2.12.4. Recent Developments
- 11.2.12.5. Financials (Based on Availability)
- 11.2.13 LLC
- 11.2.13.1. Overview
- 11.2.13.2. Products
- 11.2.13.3. SWOT Analysis
- 11.2.13.4. Recent Developments
- 11.2.13.5. Financials (Based on Availability)
- 11.2.14 Naish International
- 11.2.14.1. Overview
- 11.2.14.2. Products
- 11.2.14.3. SWOT Analysis
- 11.2.14.4. Recent Developments
- 11.2.14.5. Financials (Based on Availability)
- 11.2.15 Bluefin SUP
- 11.2.15.1. Overview
- 11.2.15.2. Products
- 11.2.15.3. SWOT Analysis
- 11.2.15.4. Recent Developments
- 11.2.15.5. Financials (Based on Availability)
- 11.2.16 Goosehill
- 11.2.16.1. Overview
- 11.2.16.2. Products
- 11.2.16.3. SWOT Analysis
- 11.2.16.4. Recent Developments
- 11.2.16.5. Financials (Based on Availability)
- 11.2.17 Atoll Board Company
- 11.2.17.1. Overview
- 11.2.17.2. Products
- 11.2.17.3. SWOT Analysis
- 11.2.17.4. Recent Developments
- 11.2.17.5. Financials (Based on Availability)
- 11.2.18 C4 Waterman
- 11.2.18.1. Overview
- 11.2.18.2. Products
- 11.2.18.3. SWOT Analysis
- 11.2.18.4. Recent Developments
- 11.2.18.5. Financials (Based on Availability)
- 11.2.19 NRS
- 11.2.19.1. Overview
- 11.2.19.2. Products
- 11.2.19.3. SWOT Analysis
- 11.2.19.4. Recent Developments
- 11.2.19.5. Financials (Based on Availability)
- 11.2.20 YOLO Boards & Bikes
- 11.2.20.1. Overview
- 11.2.20.2. Products
- 11.2.20.3. SWOT Analysis
- 11.2.20.4. Recent Developments
- 11.2.20.5. Financials (Based on Availability)
- 11.2.21 Mistral Watersport
- 11.2.21.1. Overview
- 11.2.21.2. Products
- 11.2.21.3. SWOT Analysis
- 11.2.21.4. Recent Developments
- 11.2.21.5. Financials (Based on Availability)
- 11.2.22 Sun Dolphin Boats
- 11.2.22.1. Overview
- 11.2.22.2. Products
- 11.2.22.3. SWOT Analysis
- 11.2.22.4. Recent Developments
- 11.2.22.5. Financials (Based on Availability)
- 11.2.23 Red Paddle Co
- 11.2.23.1. Overview
- 11.2.23.2. Products
- 11.2.23.3. SWOT Analysis
- 11.2.23.4. Recent Developments
- 11.2.23.5. Financials (Based on Availability)
- 11.2.24 LAIRDSTANDUP
- 11.2.24.1. Overview
- 11.2.24.2. Products
- 11.2.24.3. SWOT Analysis
- 11.2.24.4. Recent Developments
- 11.2.24.5. Financials (Based on Availability)
- 11.2.25 Tower Paddle Boards
- 11.2.25.1. Overview
- 11.2.25.2. Products
- 11.2.25.3. SWOT Analysis
- 11.2.25.4. Recent Developments
- 11.2.25.5. Financials (Based on Availability)
- 11.2.26 THURSO SURF
- 11.2.26.1. Overview
- 11.2.26.2. Products
- 11.2.26.3. SWOT Analysis
- 11.2.26.4. Recent Developments
- 11.2.26.5. Financials (Based on Availability)
- 11.2.27 Decathlon
- 11.2.27.1. Overview
- 11.2.27.2. Products
- 11.2.27.3. SWOT Analysis
- 11.2.27.4. Recent Developments
- 11.2.27.5. Financials (Based on Availability)
- 11.2.1 Aqua-Leisure Recreation
List of Figures
- Figure 1: Global Stand-Up Paddleboard Revenue Breakdown (million, %) by Region 2024 & 2032
- Figure 2: Global Stand-Up Paddleboard Volume Breakdown (K, %) by Region 2024 & 2032
- Figure 3: North America Stand-Up Paddleboard Revenue (million), by Application 2024 & 2032
- Figure 4: North America Stand-Up Paddleboard Volume (K), by Application 2024 & 2032
- Figure 5: North America Stand-Up Paddleboard Revenue Share (%), by Application 2024 & 2032
- Figure 6: North America Stand-Up Paddleboard Volume Share (%), by Application 2024 & 2032
- Figure 7: North America Stand-Up Paddleboard Revenue (million), by Types 2024 & 2032
- Figure 8: North America Stand-Up Paddleboard Volume (K), by Types 2024 & 2032
- Figure 9: North America Stand-Up Paddleboard Revenue Share (%), by Types 2024 & 2032
- Figure 10: North America Stand-Up Paddleboard Volume Share (%), by Types 2024 & 2032
- Figure 11: North America Stand-Up Paddleboard Revenue (million), by Country 2024 & 2032
- Figure 12: North America Stand-Up Paddleboard Volume (K), by Country 2024 & 2032
- Figure 13: North America Stand-Up Paddleboard Revenue Share (%), by Country 2024 & 2032
- Figure 14: North America Stand-Up Paddleboard Volume Share (%), by Country 2024 & 2032
- Figure 15: South America Stand-Up Paddleboard Revenue (million), by Application 2024 & 2032
- Figure 16: South America Stand-Up Paddleboard Volume (K), by Application 2024 & 2032
- Figure 17: South America Stand-Up Paddleboard Revenue Share (%), by Application 2024 & 2032
- Figure 18: South America Stand-Up Paddleboard Volume Share (%), by Application 2024 & 2032
- Figure 19: South America Stand-Up Paddleboard Revenue (million), by Types 2024 & 2032
- Figure 20: South America Stand-Up Paddleboard Volume (K), by Types 2024 & 2032
- Figure 21: South America Stand-Up Paddleboard Revenue Share (%), by Types 2024 & 2032
- Figure 22: South America Stand-Up Paddleboard Volume Share (%), by Types 2024 & 2032
- Figure 23: South America Stand-Up Paddleboard Revenue (million), by Country 2024 & 2032
- Figure 24: South America Stand-Up Paddleboard Volume (K), by Country 2024 & 2032
- Figure 25: South America Stand-Up Paddleboard Revenue Share (%), by Country 2024 & 2032
- Figure 26: South America Stand-Up Paddleboard Volume Share (%), by Country 2024 & 2032
- Figure 27: Europe Stand-Up Paddleboard Revenue (million), by Application 2024 & 2032
- Figure 28: Europe Stand-Up Paddleboard Volume (K), by Application 2024 & 2032
- Figure 29: Europe Stand-Up Paddleboard Revenue Share (%), by Application 2024 & 2032
- Figure 30: Europe Stand-Up Paddleboard Volume Share (%), by Application 2024 & 2032
- Figure 31: Europe Stand-Up Paddleboard Revenue (million), by Types 2024 & 2032
- Figure 32: Europe Stand-Up Paddleboard Volume (K), by Types 2024 & 2032
- Figure 33: Europe Stand-Up Paddleboard Revenue Share (%), by Types 2024 & 2032
- Figure 34: Europe Stand-Up Paddleboard Volume Share (%), by Types 2024 & 2032
- Figure 35: Europe Stand-Up Paddleboard Revenue (million), by Country 2024 & 2032
- Figure 36: Europe Stand-Up Paddleboard Volume (K), by Country 2024 & 2032
- Figure 37: Europe Stand-Up Paddleboard Revenue Share (%), by Country 2024 & 2032
- Figure 38: Europe Stand-Up Paddleboard Volume Share (%), by Country 2024 & 2032
- Figure 39: Middle East & Africa Stand-Up Paddleboard Revenue (million), by Application 2024 & 2032
- Figure 40: Middle East & Africa Stand-Up Paddleboard Volume (K), by Application 2024 & 2032
- Figure 41: Middle East & Africa Stand-Up Paddleboard Revenue Share (%), by Application 2024 & 2032
- Figure 42: Middle East & Africa Stand-Up Paddleboard Volume Share (%), by Application 2024 & 2032
- Figure 43: Middle East & Africa Stand-Up Paddleboard Revenue (million), by Types 2024 & 2032
- Figure 44: Middle East & Africa Stand-Up Paddleboard Volume (K), by Types 2024 & 2032
- Figure 45: Middle East & Africa Stand-Up Paddleboard Revenue Share (%), by Types 2024 & 2032
- Figure 46: Middle East & Africa Stand-Up Paddleboard Volume Share (%), by Types 2024 & 2032
- Figure 47: Middle East & Africa Stand-Up Paddleboard Revenue (million), by Country 2024 & 2032
- Figure 48: Middle East & Africa Stand-Up Paddleboard Volume (K), by Country 2024 & 2032
- Figure 49: Middle East & Africa Stand-Up Paddleboard Revenue Share (%), by Country 2024 & 2032
- Figure 50: Middle East & Africa Stand-Up Paddleboard Volume Share (%), by Country 2024 & 2032
- Figure 51: Asia Pacific Stand-Up Paddleboard Revenue (million), by Application 2024 & 2032
- Figure 52: Asia Pacific Stand-Up Paddleboard Volume (K), by Application 2024 & 2032
- Figure 53: Asia Pacific Stand-Up Paddleboard Revenue Share (%), by Application 2024 & 2032
- Figure 54: Asia Pacific Stand-Up Paddleboard Volume Share (%), by Application 2024 & 2032
- Figure 55: Asia Pacific Stand-Up Paddleboard Revenue (million), by Types 2024 & 2032
- Figure 56: Asia Pacific Stand-Up Paddleboard Volume (K), by Types 2024 & 2032
- Figure 57: Asia Pacific Stand-Up Paddleboard Revenue Share (%), by Types 2024 & 2032
- Figure 58: Asia Pacific Stand-Up Paddleboard Volume Share (%), by Types 2024 & 2032
- Figure 59: Asia Pacific Stand-Up Paddleboard Revenue (million), by Country 2024 & 2032
- Figure 60: Asia Pacific Stand-Up Paddleboard Volume (K), by Country 2024 & 2032
- Figure 61: Asia Pacific Stand-Up Paddleboard Revenue Share (%), by Country 2024 & 2032
- Figure 62: Asia Pacific Stand-Up Paddleboard Volume Share (%), by Country 2024 & 2032
List of Tables
- Table 1: Global Stand-Up Paddleboard Revenue million Forecast, by Region 2019 & 2032
- Table 2: Global Stand-Up Paddleboard Volume K Forecast, by Region 2019 & 2032
- Table 3: Global Stand-Up Paddleboard Revenue million Forecast, by Application 2019 & 2032
- Table 4: Global Stand-Up Paddleboard Volume K Forecast, by Application 2019 & 2032
- Table 5: Global Stand-Up Paddleboard Revenue million Forecast, by Types 2019 & 2032
- Table 6: Global Stand-Up Paddleboard Volume K Forecast, by Types 2019 & 2032
- Table 7: Global Stand-Up Paddleboard Revenue million Forecast, by Region 2019 & 2032
- Table 8: Global Stand-Up Paddleboard Volume K Forecast, by Region 2019 & 2032
- Table 9: Global Stand-Up Paddleboard Revenue million Forecast, by Application 2019 & 2032
- Table 10: Global Stand-Up Paddleboard Volume K Forecast, by Application 2019 & 2032
- Table 11: Global Stand-Up Paddleboard Revenue million Forecast, by Types 2019 & 2032
- Table 12: Global Stand-Up Paddleboard Volume K Forecast, by Types 2019 & 2032
- Table 13: Global Stand-Up Paddleboard Revenue million Forecast, by Country 2019 & 2032
- Table 14: Global Stand-Up Paddleboard Volume K Forecast, by Country 2019 & 2032
- Table 15: United States Stand-Up Paddleboard Revenue (million) Forecast, by Application 2019 & 2032
- Table 16: United States Stand-Up Paddleboard Volume (K) Forecast, by Application 2019 & 2032
- Table 17: Canada Stand-Up Paddleboard Revenue (million) Forecast, by Application 2019 & 2032
- Table 18: Canada Stand-Up Paddleboard Volume (K) Forecast, by Application 2019 & 2032
- Table 19: Mexico Stand-Up Paddleboard Revenue (million) Forecast, by Application 2019 & 2032
- Table 20: Mexico Stand-Up Paddleboard Volume (K) Forecast, by Application 2019 & 2032
- Table 21: Global Stand-Up Paddleboard Revenue million Forecast, by Application 2019 & 2032
- Table 22: Global Stand-Up Paddleboard Volume K Forecast, by Application 2019 & 2032
- Table 23: Global Stand-Up Paddleboard Revenue million Forecast, by Types 2019 & 2032
- Table 24: Global Stand-Up Paddleboard Volume K Forecast, by Types 2019 & 2032
- Table 25: Global Stand-Up Paddleboard Revenue million Forecast, by Country 2019 & 2032
- Table 26: Global Stand-Up Paddleboard Volume K Forecast, by Country 2019 & 2032
- Table 27: Brazil Stand-Up Paddleboard Revenue (million) Forecast, by Application 2019 & 2032
- Table 28: Brazil Stand-Up Paddleboard Volume (K) Forecast, by Application 2019 & 2032
- Table 29: Argentina Stand-Up Paddleboard Revenue (million) Forecast, by Application 2019 & 2032
- Table 30: Argentina Stand-Up Paddleboard Volume (K) Forecast, by Application 2019 & 2032
- Table 31: Rest of South America Stand-Up Paddleboard Revenue (million) Forecast, by Application 2019 & 2032
- Table 32: Rest of South America Stand-Up Paddleboard Volume (K) Forecast, by Application 2019 & 2032
- Table 33: Global Stand-Up Paddleboard Revenue million Forecast, by Application 2019 & 2032
- Table 34: Global Stand-Up Paddleboard Volume K Forecast, by Application 2019 & 2032
- Table 35: Global Stand-Up Paddleboard Revenue million Forecast, by Types 2019 & 2032
- Table 36: Global Stand-Up Paddleboard Volume K Forecast, by Types 2019 & 2032
- Table 37: Global Stand-Up Paddleboard Revenue million Forecast, by Country 2019 & 2032
- Table 38: Global Stand-Up Paddleboard Volume K Forecast, by Country 2019 & 2032
- Table 39: United Kingdom Stand-Up Paddleboard Revenue (million) Forecast, by Application 2019 & 2032
- Table 40: United Kingdom Stand-Up Paddleboard Volume (K) Forecast, by Application 2019 & 2032
- Table 41: Germany Stand-Up Paddleboard Revenue (million) Forecast, by Application 2019 & 2032
- Table 42: Germany Stand-Up Paddleboard Volume (K) Forecast, by Application 2019 & 2032
- Table 43: France Stand-Up Paddleboard Revenue (million) Forecast, by Application 2019 & 2032
- Table 44: France Stand-Up Paddleboard Volume (K) Forecast, by Application 2019 & 2032
- Table 45: Italy Stand-Up Paddleboard Revenue (million) Forecast, by Application 2019 & 2032
- Table 46: Italy Stand-Up Paddleboard Volume (K) Forecast, by Application 2019 & 2032
- Table 47: Spain Stand-Up Paddleboard Revenue (million) Forecast, by Application 2019 & 2032
- Table 48: Spain Stand-Up Paddleboard Volume (K) Forecast, by Application 2019 & 2032
- Table 49: Russia Stand-Up Paddleboard Revenue (million) Forecast, by Application 2019 & 2032
- Table 50: Russia Stand-Up Paddleboard Volume (K) Forecast, by Application 2019 & 2032
- Table 51: Benelux Stand-Up Paddleboard Revenue (million) Forecast, by Application 2019 & 2032
- Table 52: Benelux Stand-Up Paddleboard Volume (K) Forecast, by Application 2019 & 2032
- Table 53: Nordics Stand-Up Paddleboard Revenue (million) Forecast, by Application 2019 & 2032
- Table 54: Nordics Stand-Up Paddleboard Volume (K) Forecast, by Application 2019 & 2032
- Table 55: Rest of Europe Stand-Up Paddleboard Revenue (million) Forecast, by Application 2019 & 2032
- Table 56: Rest of Europe Stand-Up Paddleboard Volume (K) Forecast, by Application 2019 & 2032
- Table 57: Global Stand-Up Paddleboard Revenue million Forecast, by Application 2019 & 2032
- Table 58: Global Stand-Up Paddleboard Volume K Forecast, by Application 2019 & 2032
- Table 59: Global Stand-Up Paddleboard Revenue million Forecast, by Types 2019 & 2032
- Table 60: Global Stand-Up Paddleboard Volume K Forecast, by Types 2019 & 2032
- Table 61: Global Stand-Up Paddleboard Revenue million Forecast, by Country 2019 & 2032
- Table 62: Global Stand-Up Paddleboard Volume K Forecast, by Country 2019 & 2032
- Table 63: Turkey Stand-Up Paddleboard Revenue (million) Forecast, by Application 2019 & 2032
- Table 64: Turkey Stand-Up Paddleboard Volume (K) Forecast, by Application 2019 & 2032
- Table 65: Israel Stand-Up Paddleboard Revenue (million) Forecast, by Application 2019 & 2032
- Table 66: Israel Stand-Up Paddleboard Volume (K) Forecast, by Application 2019 & 2032
- Table 67: GCC Stand-Up Paddleboard Revenue (million) Forecast, by Application 2019 & 2032
- Table 68: GCC Stand-Up Paddleboard Volume (K) Forecast, by Application 2019 & 2032
- Table 69: North Africa Stand-Up Paddleboard Revenue (million) Forecast, by Application 2019 & 2032
- Table 70: North Africa Stand-Up Paddleboard Volume (K) Forecast, by Application 2019 & 2032
- Table 71: South Africa Stand-Up Paddleboard Revenue (million) Forecast, by Application 2019 & 2032
- Table 72: South Africa Stand-Up Paddleboard Volume (K) Forecast, by Application 2019 & 2032
- Table 73: Rest of Middle East & Africa Stand-Up Paddleboard Revenue (million) Forecast, by Application 2019 & 2032
- Table 74: Rest of Middle East & Africa Stand-Up Paddleboard Volume (K) Forecast, by Application 2019 & 2032
- Table 75: Global Stand-Up Paddleboard Revenue million Forecast, by Application 2019 & 2032
- Table 76: Global Stand-Up Paddleboard Volume K Forecast, by Application 2019 & 2032
- Table 77: Global Stand-Up Paddleboard Revenue million Forecast, by Types 2019 & 2032
- Table 78: Global Stand-Up Paddleboard Volume K Forecast, by Types 2019 & 2032
- Table 79: Global Stand-Up Paddleboard Revenue million Forecast, by Country 2019 & 2032
- Table 80: Global Stand-Up Paddleboard Volume K Forecast, by Country 2019 & 2032
- Table 81: China Stand-Up Paddleboard Revenue (million) Forecast, by Application 2019 & 2032
- Table 82: China Stand-Up Paddleboard Volume (K) Forecast, by Application 2019 & 2032
- Table 83: India Stand-Up Paddleboard Revenue (million) Forecast, by Application 2019 & 2032
- Table 84: India Stand-Up Paddleboard Volume (K) Forecast, by Application 2019 & 2032
- Table 85: Japan Stand-Up Paddleboard Revenue (million) Forecast, by Application 2019 & 2032
- Table 86: Japan Stand-Up Paddleboard Volume (K) Forecast, by Application 2019 & 2032
- Table 87: South Korea Stand-Up Paddleboard Revenue (million) Forecast, by Application 2019 & 2032
- Table 88: South Korea Stand-Up Paddleboard Volume (K) Forecast, by Application 2019 & 2032
- Table 89: ASEAN Stand-Up Paddleboard Revenue (million) Forecast, by Application 2019 & 2032
- Table 90: ASEAN Stand-Up Paddleboard Volume (K) Forecast, by Application 2019 & 2032
- Table 91: Oceania Stand-Up Paddleboard Revenue (million) Forecast, by Application 2019 & 2032
- Table 92: Oceania Stand-Up Paddleboard Volume (K) Forecast, by Application 2019 & 2032
- Table 93: Rest of Asia Pacific Stand-Up Paddleboard Revenue (million) Forecast, by Application 2019 & 2032
- Table 94: Rest of Asia Pacific Stand-Up Paddleboard Volume (K) Forecast, by Application 2019 & 2032
Frequently Asked Questions
1. What is the projected Compound Annual Growth Rate (CAGR) of the Stand-Up Paddleboard?
The projected CAGR is approximately XX%.
2. Which companies are prominent players in the Stand-Up Paddleboard?
Key companies in the market include Aqua-Leisure Recreation, LLC, Tahe Outdoors, BOARDWORKS, Cascadia Board Co, Starboard, SUP ATX LLC, SURFTECH, LLC, Sea Eagle Boats, inc, Imagine Nation Sports, LLC, Naish International, Bluefin SUP, Goosehill, Atoll Board Company, C4 Waterman, NRS, YOLO Boards & Bikes, Mistral Watersport, Sun Dolphin Boats, Red Paddle Co, LAIRDSTANDUP, Tower Paddle Boards, THURSO SURF, Decathlon.
3. What are the main segments of the Stand-Up Paddleboard?
The market segments include Application, Types.
4. Can you provide details about the market size?
The market size is estimated to be USD XXX million as of 2022.
5. What are some drivers contributing to market growth?
N/A
6. What are the notable trends driving market growth?
N/A
7. Are there any restraints impacting market growth?
N/A
8. Can you provide examples of recent developments in the market?
N/A
9. What pricing options are available for accessing the report?
Pricing options include single-user, multi-user, and enterprise licenses priced at USD 3350.00, USD 5025.00, and USD 6700.00 respectively.
10. Is the market size provided in terms of value or volume?
The market size is provided in terms of value, measured in million and volume, measured in K.
11. Are there any specific market keywords associated with the report?
Yes, the market keyword associated with the report is "Stand-Up Paddleboard," which aids in identifying and referencing the specific market segment covered.
12. How do I determine which pricing option suits my needs best?
The pricing options vary based on user requirements and access needs. Individual users may opt for single-user licenses, while businesses requiring broader access may choose multi-user or enterprise licenses for cost-effective access to the report.
13. Are there any additional resources or data provided in the Stand-Up Paddleboard report?
While the report offers comprehensive insights, it's advisable to review the specific contents or supplementary materials provided to ascertain if additional resources or data are available.
14. How can I stay updated on further developments or reports in the Stand-Up Paddleboard?
To stay informed about further developments, trends, and reports in the Stand-Up Paddleboard, consider subscribing to industry newsletters, following relevant companies and organizations, or regularly checking reputable industry news sources and publications.
Methodology
Step 1 - Identification of Relevant Samples Size from Population Database


Step 2 - Approaches for Defining Global Market Size (Value, Volume* & Price*)

Note*: In applicable scenarios
Step 3 - Data Sources
Primary Research
- Web Analytics
- Survey Reports
- Research Institute
- Latest Research Reports
- Opinion Leaders
Secondary Research
- Annual Reports
- White Paper
- Latest Press Release
- Industry Association
- Paid Database
- Investor Presentations

Step 4 - Data Triangulation
Involves using different sources of information in order to increase the validity of a study
These sources are likely to be stakeholders in a program - participants, other researchers, program staff, other community members, and so on.
Then we put all data in single framework & apply various statistical tools to find out the dynamic on the market.
During the analysis stage, feedback from the stakeholder groups would be compared to determine areas of agreement as well as areas of divergence
