

Key Insights
The global Online Lottery Market is poised for significant expansion, with a market valuation estimated at $19.43 billion in 2025. This robust growth trajectory is expected to continue, driven by a compelling Compound Annual Growth Rate (CAGR) of 9.5% throughout the forecast period from 2025 to 2033. Several factors are fueling this digital transformation in the lottery sector. The widespread proliferation of smartphones and increasing internet penetration globally have made online lottery platforms incredibly accessible, allowing players to participate from anywhere at any time. This convenience, coupled with rising disposable incomes in many regions, significantly boosts engagement. Furthermore, continuous innovation in game offerings, including engaging instant-win games, diverse sports-themed lotteries, and interactive quizzes, attracts a broader demographic of players, moving beyond traditional draw-based formats. The ongoing digitalization of the entertainment and gambling industries also contributes substantially, making online lottery a natural evolution for enthusiasts.
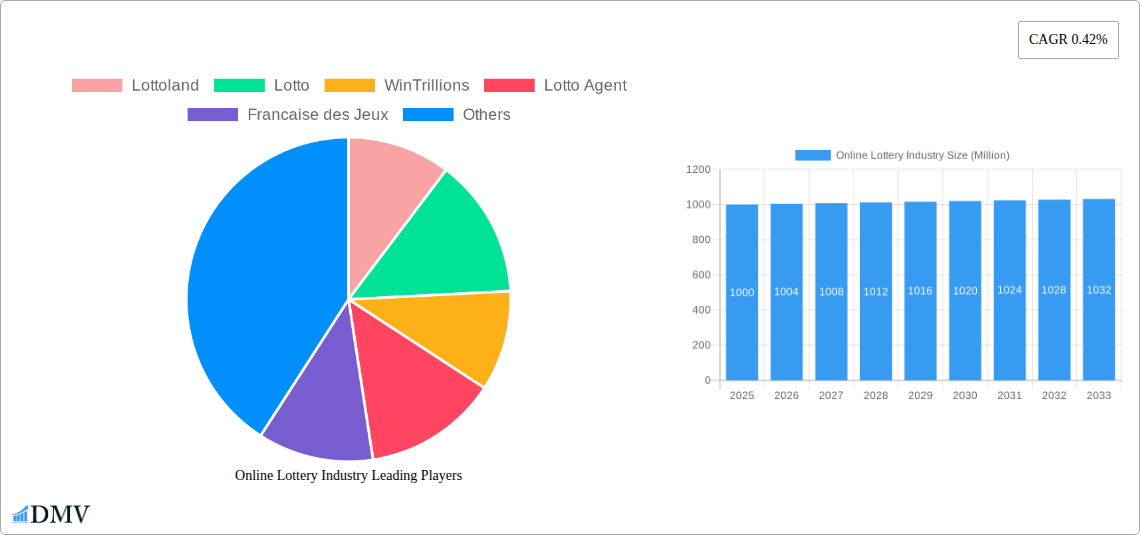
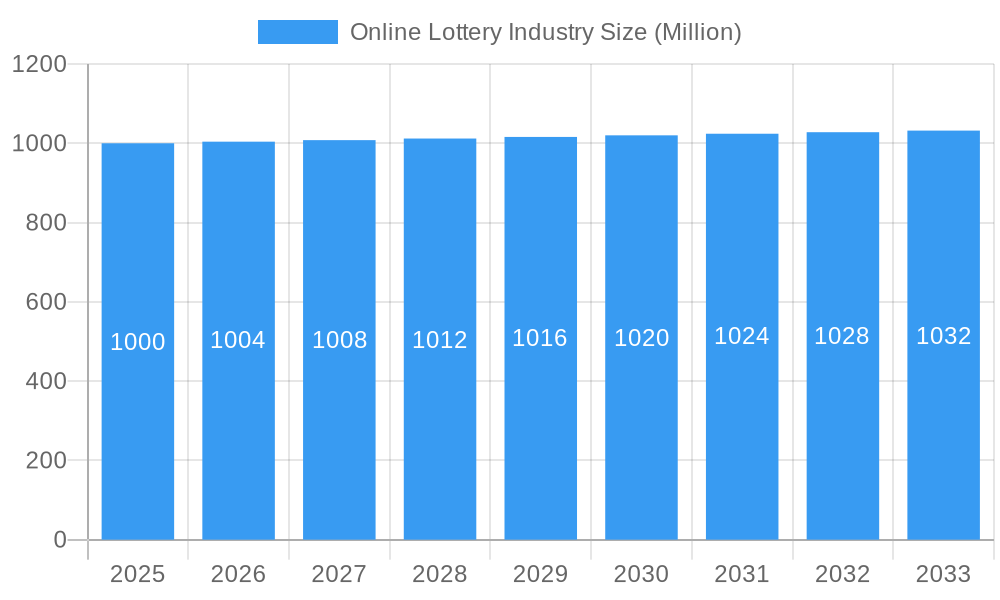
Online Lottery Industry Market Size (In Billion)
Key trends shaping the market include the adoption of mobile-first strategies by leading companies, optimizing user experience for on-the-go play. The integration of advanced payment solutions, particularly e-wallets and cryptocurrencies, is enhancing transaction security and convenience, appealing to a tech-savvy user base. Moreover, the focus on responsible gaming practices and the development of robust regulatory frameworks in various jurisdictions are fostering a more secure and trustworthy environment, encouraging greater participation. However, the market also faces restraints such as varying legal complexities across countries, which can hinder market entry and expansion. Cybersecurity threats and concerns regarding problem gambling necessitate continuous investment in secure platforms and responsible gambling initiatives. The competitive landscape features prominent players like Lotto Direct Limited, Camelot Group, and ZEAL Network SE, constantly innovating across segments like game type (Draw-Based Games, Instant Win Games), platform (Desktop, Mobile), and payment modes (Credit/Debit Cards, E-Wallets, Cryptocurrency), all vying for a share in this dynamic and expanding market. North America and Europe currently hold substantial regional market shares, while the Asia Pacific region is expected to demonstrate rapid growth due to increasing internet adoption and evolving regulatory environments.
Online Lottery Industry Company Market Share
Global Online Lottery Market: Comprehensive Analysis & Strategic Outlook 2025-2033
Unlock unparalleled insights into the dynamic Global Online Lottery Industry with our exhaustive market research report. This definitive analysis provides stakeholders, investors, and industry players with a strategic compass, navigating the complexities and immense opportunities within the digital lottery landscape. From market share distribution to emerging technologies and regulatory shifts, our report offers a granular view of an industry projected to reach trillions of dollars in value. Dive deep into growth drivers, market trends, and competitive strategies shaping the future of iLottery and online gambling.
Leveraging a robust methodology, our study covers the Historical Period: 2019–2024, sets the Base Year: 2025 and Estimated Year: 2025, and provides a detailed Forecast Period: 2025–2033, offering a comprehensive Study Period: 2019–2033. Explore how advancements in mobile platforms, cryptocurrency payment modes, and innovative game types like Instant Win Games are propelling the market forward. Gain a competitive edge by understanding the strategic moves of key players such as Lotto Direct Limited, Camelot Group, Lottoland, ZEAL Network SE, and Française des Jeux. This report is meticulously crafted to be your indispensable guide in the rapidly evolving Online Lottery Industry.
Online Lottery Industry Market Composition & Trends
The Online Lottery Industry exhibits a dynamic market composition characterized by increasing concentration alongside persistent innovation. Major players like Lotto Direct Limited, Camelot Group, Lottoland, ZEAL Network SE, and Française des Jeux command significant portions of the global online lottery market, with their combined market share estimated to be in the tens of billions of dollars. However, the market remains vibrant with emerging disruptors and niche operators like Lotto Agent, LottoKings, WinTrillions, and Annexio Limited, contributing to a diverse competitive landscape. Innovation catalysts, particularly in mobile platforms and payment modes such as E-Wallets and Cryptocurrency, are continuously reshaping the industry, fostering new player engagement models and expanding accessibility. The regulatory landscape, though fragmented across jurisdictions, is gradually evolving, with more countries legalizing and regulating online lottery services, opening up new revenue streams and consumer bases.
Substitute products, including traditional physical lotteries and other forms of online gambling like sports betting and casino games, pose a constant competitive pressure. However, the convenience and enhanced gaming experience offered by online platforms often outweigh these alternatives, driving a steady migration of Individual Players and Lottery Syndicates to digital channels. End-user profiles are increasingly diverse, spanning various age groups and demographics, with a growing preference for Instant Win Games and personalized gaming experiences. M&A activities are a prominent feature of the market, reflecting strategic consolidation and expansion efforts. Over the historical period 2019-2024, M&A deal values collectively surpassed xx billion dollars, with major players acquiring smaller, innovative firms to expand their geographical reach, technological capabilities, and game portfolios. This strategic inorganic growth further intensifies competition and shapes market structure. The focus on integrating advanced analytics to understand player behavior and tailor offerings is also a significant trend, allowing companies to optimize marketing spend and enhance player lifetime value, driving market growth and ensuring a robust future for the Online Lottery Industry. The shift towards diversified Game Types beyond traditional Draw-Based Games demonstrates the industry's adaptability and commitment to meeting evolving consumer demands, with Sports Games and Quizzes Games gaining traction.
Online Lottery Industry Industry Evolution
The Online Lottery Industry has undergone a profound evolution, transforming from a nascent digital extension of traditional lotteries into a multi-billion dollar global phenomenon. This trajectory is marked by significant market growth, propelled by rapid technological advancements and profound shifts in consumer demands. In the Historical Period (2019–2024), the market witnessed consistent expansion, with a global revenue growth rate averaging around xx% annually, reaching an estimated market value of xx billion by the Estimated Year 2025. This growth is primarily attributed to the widespread proliferation of internet connectivity and the ubiquitous adoption of mobile platforms. Mobile adoption, in particular, has been a game-changer, with an estimated xx billion mobile users engaging with online lottery platforms by 2025, underscoring the shift from Desktop to on-the-go gaming experiences. The convenience of purchasing tickets, checking results, and participating in diverse Game Types via smartphones has dramatically expanded the industry's reach and fostered unprecedented player engagement.
Technological advancements have been at the core of this evolution. The integration of advanced analytics and artificial intelligence (AI) has enabled personalized gaming experiences, dynamic pricing strategies, and sophisticated fraud detection systems, enhancing both security and user satisfaction. Blockchain technology is also beginning to emerge as a disruptor, promising increased transparency and fairness in lottery draws, with early adoption metrics suggesting a potential for xx billion in blockchain-backed lottery transactions by 2033. Virtual reality (VR) and augmented reality (AR) are on the horizon, poised to offer immersive gaming environments that could further revolutionize Draw-Based Games and Instant Win Games. Moreover, the expansion of Payment Mode options, including E-Wallets and the growing acceptance of Cryptocurrency, has facilitated seamless transactions for a global player base, overcoming traditional banking hurdles and catering to tech-savvy Individual Players. These innovations are not merely incremental but represent fundamental shifts that broaden the appeal and accessibility of online lotteries. Shifting consumer demands, characterized by a preference for instant gratification, diverse entertainment options, and social interaction, have also steered the industry's evolution. Operators are responding by introducing a wider array of Game Types, including engaging Quizzes Games and interactive Sports Games, moving beyond conventional lottery formats. The rise of Lottery Syndicates operating digitally further exemplifies the demand for collaborative and community-driven gaming experiences, marking a comprehensive transformation in how lotteries are conceived, delivered, and consumed globally. The market is projected to continue its robust growth, with a forecast CAGR of xx% during 2025–2033, driven by continuous innovation and expanding digital ecosystems, potentially reaching a market valuation of hundreds of billions of dollars by the end of the forecast period.
Leading Regions, Countries, or Segments in Online Lottery Industry
Analyzing the Online Lottery Industry reveals several dominant segments and geographical powerhouses shaping its global trajectory. Among Game Types, Draw-Based Games continue to hold the largest market share, contributing an estimated xx billion to the global market by 2025. This enduring popularity is driven by the allure of massive jackpots and familiar formats, which resonate with a broad base of Individual Players. However, Instant Win Games are rapidly gaining momentum, propelled by their immediate gratification and diverse themes, projected to capture a significant xx billion market share by 2033. Sports Games and Quizzes Games, while smaller, represent exciting growth niches, appealing to specific player demographics seeking interactive entertainment beyond traditional draws.
- Key Drivers for Draw-Based Games Dominance:
- Historical Legacy and Brand Recognition: Many national lotteries have successfully transitioned their popular draw-based games online, leveraging existing brand loyalty.
- Large Jackpots: The potential for life-changing sums remains a primary draw for millions globally, generating immense revenue in the tens of billions of dollars.
- Regulatory Familiarity: Regulators are often more comfortable with established draw-based formats, facilitating easier online licensing.
- Syndicate Play: Lottery Syndicates frequently focus on draw-based games to increase their chances of winning.
In terms of Platform, Mobile undeniably leads the market, forecasted to generate xx billion in revenue by 2025 and continue its exponential growth. The ubiquitous nature of smartphones and the convenience of playing anytime, anywhere, have made mobile the preferred access point for the vast majority of online lottery players. While Desktop platforms still cater to a segment of players, especially those seeking more immersive or complex gaming interfaces, the future of accessibility and engagement firmly rests with mobile.
- Key Drivers for Mobile Platform Dominance:
- Accessibility and Convenience: Smartphones are always accessible, enabling impulse play and immediate access to results.
- Technological Advancements: Enhanced app functionality, push notifications, and seamless user interfaces optimize the mobile experience.
- Demographic Shift: Younger demographics, digital natives, predominantly use mobile devices for entertainment.
- Payment Integration: Mobile payment solutions, including E-Wallets and easy Credit/Debit Cards integration, streamline transactions.
Regarding Payment Mode, Credit/Debit Cards still represent the largest transaction volume, estimated at xx billion, owing to their widespread acceptance and user familiarity. However, E-Wallets are experiencing the fastest growth, projected to process xx billion in transactions by 2033, driven by their security, speed, and ease of use, particularly on mobile platforms. The emergence of Cryptocurrency as a viable payment option, though still nascent, indicates a future trend towards decentralized and secure transactions, with early adoption figures nearing xx billion in specific markets.
Geographically, Europe currently dominates the Online Lottery Industry, with countries like the UK, France, and Germany demonstrating robust market maturity and high player engagement. The European market, collectively generating hundreds of billions of dollars, benefits from well-established regulatory frameworks, a high penetration of internet and mobile usage, and the presence of major operators such as Camelot Group, Française des Jeux, and ZEAL Network SE. North America is another significant region, with the US market rapidly expanding as more states legalize online lottery sales, poised to become a multi-billion dollar market. The Asia-Pacific region, particularly India and other emerging economies, presents immense future potential, driven by vast populations, increasing internet penetration, and a growing appetite for digital entertainment, with the region projected to contribute xx billion to global revenue by 2033. The blend of established markets and rapidly expanding regions underscores the diverse growth engines propelling the global Online Lottery Industry forward.
Online Lottery Industry Product Innovations
The Online Lottery Industry is experiencing a surge in product innovations, fundamentally transforming player engagement and market dynamics. Key advancements include the integration of gamification elements into traditional Draw-Based Games, turning them into more interactive experiences. Many platforms are now offering Instant Win Games with sophisticated graphics, immersive storylines, and engaging bonus features, moving beyond simple scratch cards to provide mini-game experiences. Unique selling propositions often revolve around exclusive jackpot sizes, personalized subscription models, and loyalty programs that reward consistent play. Technological advancements are evident in the adoption of AI for personalized game recommendations and predictive analytics for player behavior, enhancing user retention and engagement, leading to an estimated xx billion increase in player lifetime value. Furthermore, the exploration of blockchain technology for verifiable fairness and transparency in lottery draws, and the early stages of virtual reality (VR) integration for immersive lottery experiences, signify the industry's commitment to pushing technological boundaries and captivating players with novel and exciting offerings.
Propelling Factors for Online Lottery Industry Growth
Several critical factors are propelling the remarkable growth of the Online Lottery Industry. The pervasive digital transformation and increasing internet penetration globally, particularly in emerging economies, are expanding the addressable market, driving an estimated xx billion increase in online player registrations. The widespread adoption of mobile devices and enhanced mobile app functionalities offer unparalleled convenience, allowing players to participate in Draw-Based Games and Instant Win Games anytime, anywhere, contributing hundreds of billions to overall market revenue. Furthermore, the evolving regulatory landscape in various countries is becoming more favorable, with an increasing number of governments legalizing and regulating online lottery operations, attracting an additional xx billion in investments. Economic influences such as rising disposable incomes and changing consumer preferences towards digital entertainment are also significant, boosting overall spending on online lottery products. The introduction of diverse Game Types, including Sports Games and Quizzes Games, along with innovative Payment Mode options like E-Wallets and Cryptocurrency, broadens appeal and attracts new demographics, adding billions in new revenue streams annually.
Obstacles in the Online Lottery Industry Market
Despite its robust growth, the Online Lottery Industry faces several significant obstacles. Stringent and often fragmented regulatory challenges across different jurisdictions remain a primary barrier, hindering market expansion and requiring substantial compliance investments exceeding xx billion annually. This regulatory complexity can impede the entry of new players and restrict the global reach of existing operators. Intense competitive pressures from both traditional lotteries and other forms of online gambling, such as sports betting and casino games, force operators to continuously innovate and invest heavily in marketing, impacting profit margins by hundreds of millions of dollars. Concerns regarding responsible gaming and the prevention of problem gambling are also critical, necessitating significant investment in robust self-exclusion tools and public awareness campaigns, amounting to xx million annually. Furthermore, the ever-present threat of cybersecurity risks, including data breaches and fraud, demands continuous investment in advanced security infrastructure, protecting billions of dollars in player funds and sensitive data. Supply chain disruptions, although less pronounced than in physical goods, can affect payment processing partners or software providers, potentially impacting service continuity and player trust, leading to revenue losses of xx million in severe cases.
Future Opportunities in Online Lottery Industry
The Online Lottery Industry is ripe with future opportunities for substantial growth and innovation. Emerging markets in Asia-Pacific and Latin America, with their rapidly expanding internet penetration and burgeoning middle classes, represent untapped potential for billions of dollars in new revenue. Technological advancements like the integration of Artificial Intelligence (AI) for hyper-personalized player experiences and predictive analytics for game development will drive engagement and retention, leading to an estimated xx billion increase in player lifetime value. The adoption of blockchain technology promises enhanced transparency, security, and provably fair outcomes, which could attract a new segment of players valuing trust and decentralization, generating hundreds of millions in new market value. Furthermore, the increasing acceptance of Cryptocurrency as a Payment Mode offers new avenues for secure, fast, and borderless transactions, appealing to a tech-savvy global audience and contributing billions to market transactions. The growing trend of gamification, incorporating social features and immersive experiences akin to video games, is set to attract younger demographics, expanding the industry's reach beyond traditional lottery players. Exploring the metaverse and Web3 concepts could unlock entirely new interactive lottery formats and virtual prize pools, representing a multi-billion dollar long-term opportunity. Strategic partnerships with entertainment companies and media outlets also present significant opportunities for co-branded games and broader market exposure.
Major Players in the Online Lottery Industry Ecosystem
- Lotto Direct Limited
- Camelot Group
- Lottoland
- Lotto Agent
- LottoKings
- WinTrillions
- Lotto
- ZEAL Network SE
- Française des Jeux
- Annexio Limited
- Others
Key Developments in Online Lottery Industry Industry
- October 2022: ZEAL Network SE expanded its games business internationally. The German market leader for online lotteries collaborated with American online lottery provider Park Avenue Gaming to integrate the online instant games of Zeal into its video lottery terminal business in Argentina and its online platforms in Peru. This development signifies a strategic move by a major player to penetrate new international markets, particularly in Latin America, and diversify its platform offerings beyond traditional online channels, impacting market dynamics by expanding geographical reach and product accessibility, potentially adding hundreds of millions to its revenue streams.
- February 2022: ZEAL Network SE launched a partnership with Lotto Hessian for instant win games. In this partnership, Zeal provided Hessian with 15 online games of the state lottery, such as crosswords, bingo, or the world cup. This collaboration highlights the growing importance of Instant Win Games as a key segment within the Online Lottery Industry and demonstrates how established operators are leveraging partnerships to enhance their game portfolios and cater to evolving consumer preferences for immediate gratification and diverse Game Types. This partnership is expected to boost revenue for both entities by tens of millions of dollars through increased player engagement.
- December 2021: Crypto Millions Lotto announced the launch of four new lottery games on its official website. Two of the above four games are India-based, namely, India Fantasy 5 and India Million Lotto, while the others are US-based, viz, Powerball+ and Mega Millions+. This development underscores the increasing relevance of Cryptocurrency as a Payment Mode in the Online Lottery Industry and the strategic focus on specific regional markets like India and the US. The launch of region-specific games caters to local player preferences and expands the market for crypto-backed lotteries, indicating a potential shift towards more specialized and decentralized lottery offerings that could collectively generate billions of dollars in new market value.
Strategic Online Lottery Industry Market Forecast
The strategic outlook for the Online Lottery Industry through 2033 remains exceptionally positive, driven by a powerful confluence of innovation, market expansion, and evolving consumer habits. The continued advancement of mobile platforms and the integration of sophisticated AI-driven personalization will solidify the market's trajectory, enhancing player engagement and lifetime value, potentially contributing an additional xx billion to global revenues. Future opportunities in emerging markets, particularly in Asia and Africa, represent vast untapped potential, as internet penetration and digital literacy continue to soar, poised to add hundreds of billions to the market. The increasing acceptance of diverse Payment Mode options, including Cryptocurrency, will streamline transactions and broaden accessibility for a global audience, facilitating hundreds of billions in transaction volume. Furthermore, the strategic adoption of gamification and the potential for immersive experiences within the metaverse are set to attract younger demographics, ensuring sustained growth and innovation. Investments in robust responsible gaming measures and navigating the complex regulatory landscape will be critical for sustainable expansion, positioning the Online Lottery Industry as a resilient and high-growth sector projected to exceed hundreds of billions of dollars in market valuation by the end of the Forecast Period (2025–2033).
Online Lottery Industry Segmentation
-
1. Game Type
- 1.1. Draw-Based Games
- 1.2. Instant Win Games
- 1.3. Sports Games
- 1.4. Quizzes Games
- 1.5. Others
-
2. Platform
- 2.1. Desktop
- 2.2. Mobile
-
3. Payment Mode
- 3.1. Credit/Debit Cards
- 3.2. E-Wallets
- 3.3. Bank Transfers
- 3.4. Cryptocurrency
- 3.5. Others
-
4. End User
- 4.1. Individual Players
- 4.2. Lottery Syndicates
Online Lottery Industry Segmentation By Geography
-
1. North America
- 1.1. United States
- 1.2. Canada
- 1.3. Mexico
- 1.4. Rest of North America
-
2. Europe
- 2.1. Spain
- 2.2. United Kingdom
- 2.3. Germany
- 2.4. France
- 2.5. Italy
- 2.6. Sweden
- 2.7. Rest of Europe
-
3. Asia Pacific
- 3.1. China
- 3.2. India
- 3.3. Japan
- 3.4. Australia
- 3.5. Rest of Asia Pacific
-
4. South America
- 4.1. Brazil
- 4.2. Argentina
- 4.3. Rest of South America
-
5. Middle East and Africa
- 5.1. South Africa
- 5.2. United Arab Emirates
- 5.3. Rest of Middle East and Africa
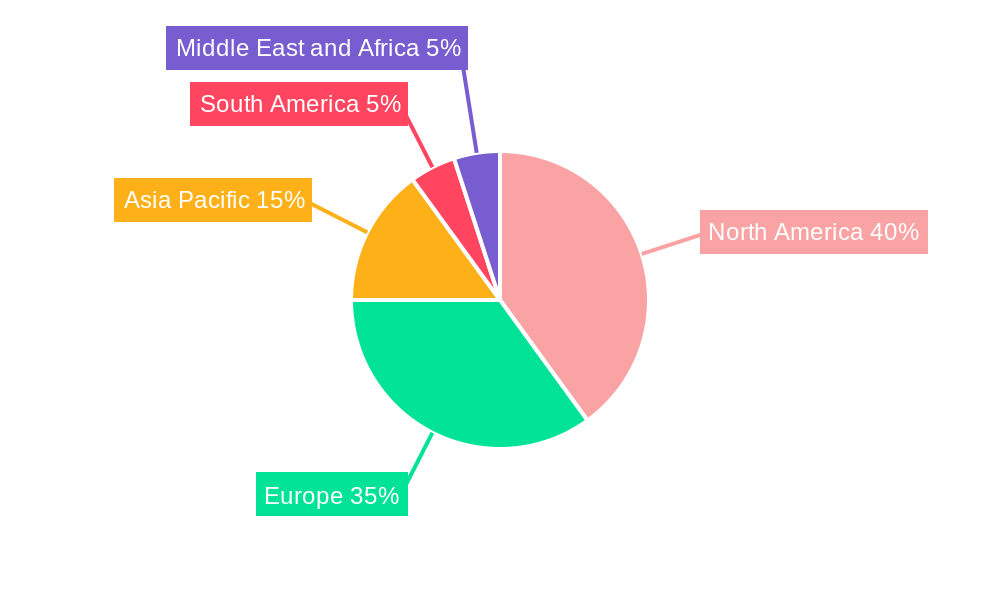
Online Lottery Industry Regional Market Share
Geographic Coverage of Online Lottery Industry
Online Lottery Industry REPORT HIGHLIGHTS
| Aspects | Details |
|---|---|
| Study Period | 2020-2034 |
| Base Year | 2025 |
| Estimated Year | 2026 |
| Forecast Period | 2026-2034 |
| Historical Period | 2020-2025 |
| Growth Rate | CAGR of 9.5% from 2020-2034 |
| Segmentation |
|
Table of Contents
- 1. Introduction
- 1.1. Research Scope
- 1.2. Market Segmentation
- 1.3. Research Objective
- 1.4. Definitions and Assumptions
- 2. Executive Summary
- 2.1. Market Snapshot
- 3. Market Dynamics
- 3.1. Market Drivers
- 3.2. Market Restrains
- 3.3. Market Trends
- 3.4. Market Opportunities
- 4. Market Factor Analysis
- 4.1. Porters Five Forces
- 4.1.1. Bargaining Power of Suppliers
- 4.1.2. Bargaining Power of Buyers
- 4.1.3. Threat of New Entrants
- 4.1.4. Threat of Substitutes
- 4.1.5. Competitive Rivalry
- 4.2. PESTEL analysis
- 4.3. BCG Analysis
- 4.3.1. Stars (High Growth, High Market Share)
- 4.3.2. Cash Cows (Low Growth, High Market Share)
- 4.3.3. Question Mark (High Growth, Low Market Share)
- 4.3.4. Dogs (Low Growth, Low Market Share)
- 4.4. Ansoff Matrix Analysis
- 4.5. Supply Chain Analysis
- 4.6. Regulatory Landscape
- 4.7. Current Market Potential and Opportunity Assessment (TAM–SAM–SOM Framework)
- 4.8. DMV Analyst Note
- 4.1. Porters Five Forces
- 5. Market Analysis, Insights and Forecast 2021-2033
- 5.1. Market Analysis, Insights and Forecast - by Game Type
- 5.1.1. Draw-Based Games
- 5.1.2. Instant Win Games
- 5.1.3. Sports Games
- 5.1.4. Quizzes Games
- 5.1.5. Others
- 5.2. Market Analysis, Insights and Forecast - by Platform
- 5.2.1. Desktop
- 5.2.2. Mobile
- 5.3. Market Analysis, Insights and Forecast - by Payment Mode
- 5.3.1. Credit/Debit Cards
- 5.3.2. E-Wallets
- 5.3.3. Bank Transfers
- 5.3.4. Cryptocurrency
- 5.3.5. Others
- 5.4. Market Analysis, Insights and Forecast - by End User
- 5.4.1. Individual Players
- 5.4.2. Lottery Syndicates
- 5.5. Market Analysis, Insights and Forecast - by Region
- 5.5.1. North America
- 5.5.2. Europe
- 5.5.3. Asia Pacific
- 5.5.4. South America
- 5.5.5. Middle East and Africa
- 5.1. Market Analysis, Insights and Forecast - by Game Type
- 6. Global Online Lottery Industry Analysis, Insights and Forecast, 2021-2033
- 6.1. Market Analysis, Insights and Forecast - by Game Type
- 6.1.1. Draw-Based Games
- 6.1.2. Instant Win Games
- 6.1.3. Sports Games
- 6.1.4. Quizzes Games
- 6.1.5. Others
- 6.2. Market Analysis, Insights and Forecast - by Platform
- 6.2.1. Desktop
- 6.2.2. Mobile
- 6.3. Market Analysis, Insights and Forecast - by Payment Mode
- 6.3.1. Credit/Debit Cards
- 6.3.2. E-Wallets
- 6.3.3. Bank Transfers
- 6.3.4. Cryptocurrency
- 6.3.5. Others
- 6.4. Market Analysis, Insights and Forecast - by End User
- 6.4.1. Individual Players
- 6.4.2. Lottery Syndicates
- 6.1. Market Analysis, Insights and Forecast - by Game Type
- 7. North America Online Lottery Industry Analysis, Insights and Forecast, 2020-2032
- 7.1. Market Analysis, Insights and Forecast - by Game Type
- 7.1.1. Draw-Based Games
- 7.1.2. Instant Win Games
- 7.1.3. Sports Games
- 7.1.4. Quizzes Games
- 7.1.5. Others
- 7.2. Market Analysis, Insights and Forecast - by Platform
- 7.2.1. Desktop
- 7.2.2. Mobile
- 7.3. Market Analysis, Insights and Forecast - by Payment Mode
- 7.3.1. Credit/Debit Cards
- 7.3.2. E-Wallets
- 7.3.3. Bank Transfers
- 7.3.4. Cryptocurrency
- 7.3.5. Others
- 7.4. Market Analysis, Insights and Forecast - by End User
- 7.4.1. Individual Players
- 7.4.2. Lottery Syndicates
- 7.1. Market Analysis, Insights and Forecast - by Game Type
- 8. Europe Online Lottery Industry Analysis, Insights and Forecast, 2020-2032
- 8.1. Market Analysis, Insights and Forecast - by Game Type
- 8.1.1. Draw-Based Games
- 8.1.2. Instant Win Games
- 8.1.3. Sports Games
- 8.1.4. Quizzes Games
- 8.1.5. Others
- 8.2. Market Analysis, Insights and Forecast - by Platform
- 8.2.1. Desktop
- 8.2.2. Mobile
- 8.3. Market Analysis, Insights and Forecast - by Payment Mode
- 8.3.1. Credit/Debit Cards
- 8.3.2. E-Wallets
- 8.3.3. Bank Transfers
- 8.3.4. Cryptocurrency
- 8.3.5. Others
- 8.4. Market Analysis, Insights and Forecast - by End User
- 8.4.1. Individual Players
- 8.4.2. Lottery Syndicates
- 8.1. Market Analysis, Insights and Forecast - by Game Type
- 9. Asia Pacific Online Lottery Industry Analysis, Insights and Forecast, 2020-2032
- 9.1. Market Analysis, Insights and Forecast - by Game Type
- 9.1.1. Draw-Based Games
- 9.1.2. Instant Win Games
- 9.1.3. Sports Games
- 9.1.4. Quizzes Games
- 9.1.5. Others
- 9.2. Market Analysis, Insights and Forecast - by Platform
- 9.2.1. Desktop
- 9.2.2. Mobile
- 9.3. Market Analysis, Insights and Forecast - by Payment Mode
- 9.3.1. Credit/Debit Cards
- 9.3.2. E-Wallets
- 9.3.3. Bank Transfers
- 9.3.4. Cryptocurrency
- 9.3.5. Others
- 9.4. Market Analysis, Insights and Forecast - by End User
- 9.4.1. Individual Players
- 9.4.2. Lottery Syndicates
- 9.1. Market Analysis, Insights and Forecast - by Game Type
- 10. South America Online Lottery Industry Analysis, Insights and Forecast, 2020-2032
- 10.1. Market Analysis, Insights and Forecast - by Game Type
- 10.1.1. Draw-Based Games
- 10.1.2. Instant Win Games
- 10.1.3. Sports Games
- 10.1.4. Quizzes Games
- 10.1.5. Others
- 10.2. Market Analysis, Insights and Forecast - by Platform
- 10.2.1. Desktop
- 10.2.2. Mobile
- 10.3. Market Analysis, Insights and Forecast - by Payment Mode
- 10.3.1. Credit/Debit Cards
- 10.3.2. E-Wallets
- 10.3.3. Bank Transfers
- 10.3.4. Cryptocurrency
- 10.3.5. Others
- 10.4. Market Analysis, Insights and Forecast - by End User
- 10.4.1. Individual Players
- 10.4.2. Lottery Syndicates
- 10.1. Market Analysis, Insights and Forecast - by Game Type
- 11. Middle East and Africa Online Lottery Industry Analysis, Insights and Forecast, 2020-2032
- 11.1. Market Analysis, Insights and Forecast - by Game Type
- 11.1.1. Draw-Based Games
- 11.1.2. Instant Win Games
- 11.1.3. Sports Games
- 11.1.4. Quizzes Games
- 11.1.5. Others
- 11.2. Market Analysis, Insights and Forecast - by Platform
- 11.2.1. Desktop
- 11.2.2. Mobile
- 11.3. Market Analysis, Insights and Forecast - by Payment Mode
- 11.3.1. Credit/Debit Cards
- 11.3.2. E-Wallets
- 11.3.3. Bank Transfers
- 11.3.4. Cryptocurrency
- 11.3.5. Others
- 11.4. Market Analysis, Insights and Forecast - by End User
- 11.4.1. Individual Players
- 11.4.2. Lottery Syndicates
- 11.1. Market Analysis, Insights and Forecast - by Game Type
- 12. Competitive Analysis
- 12.1. Company Profiles
- 12.1.1 Lotto Direct Limited
- 12.1.1.1. Company Overview
- 12.1.1.2. Products
- 12.1.1.3. Company Financials
- 12.1.1.4. SWOT Analysis
- 12.1.2 Camelot Group
- 12.1.2.1. Company Overview
- 12.1.2.2. Products
- 12.1.2.3. Company Financials
- 12.1.2.4. SWOT Analysis
- 12.1.3 Lottoland
- 12.1.3.1. Company Overview
- 12.1.3.2. Products
- 12.1.3.3. Company Financials
- 12.1.3.4. SWOT Analysis
- 12.1.4 Lotto Agent
- 12.1.4.1. Company Overview
- 12.1.4.2. Products
- 12.1.4.3. Company Financials
- 12.1.4.4. SWOT Analysis
- 12.1.5 LottoKings
- 12.1.5.1. Company Overview
- 12.1.5.2. Products
- 12.1.5.3. Company Financials
- 12.1.5.4. SWOT Analysis
- 12.1.6 WinTrillions
- 12.1.6.1. Company Overview
- 12.1.6.2. Products
- 12.1.6.3. Company Financials
- 12.1.6.4. SWOT Analysis
- 12.1.7 Lotto
- 12.1.7.1. Company Overview
- 12.1.7.2. Products
- 12.1.7.3. Company Financials
- 12.1.7.4. SWOT Analysis
- 12.1.8 ZEAL Network SE
- 12.1.8.1. Company Overview
- 12.1.8.2. Products
- 12.1.8.3. Company Financials
- 12.1.8.4. SWOT Analysis
- 12.1.9 Française des Jeux
- 12.1.9.1. Company Overview
- 12.1.9.2. Products
- 12.1.9.3. Company Financials
- 12.1.9.4. SWOT Analysis
- 12.1.10 Annexio Limited
- 12.1.10.1. Company Overview
- 12.1.10.2. Products
- 12.1.10.3. Company Financials
- 12.1.10.4. SWOT Analysis
- 12.1.11 Others
- 12.1.11.1. Company Overview
- 12.1.11.2. Products
- 12.1.11.3. Company Financials
- 12.1.11.4. SWOT Analysis
- 12.1.1 Lotto Direct Limited
- 12.2. Market Entropy
- 12.2.1 Company's Key Areas Served
- 12.2.2 Recent Developments
- 12.3. Company Market Share Analysis 2025
- 12.3.1 Top 5 Companies Market Share Analysis
- 12.3.2 Top 3 Companies Market Share Analysis
- 12.4. List of Potential Customers
- 13. Research Methodology
List of Figures
- Figure 1: Global Online Lottery Industry Revenue Breakdown (billion, %) by Region 2025 & 2033
- Figure 2: North America Online Lottery Industry Revenue (billion), by Game Type 2025 & 2033
- Figure 3: North America Online Lottery Industry Revenue Share (%), by Game Type 2025 & 2033
- Figure 4: North America Online Lottery Industry Revenue (billion), by Platform 2025 & 2033
- Figure 5: North America Online Lottery Industry Revenue Share (%), by Platform 2025 & 2033
- Figure 6: North America Online Lottery Industry Revenue (billion), by Payment Mode 2025 & 2033
- Figure 7: North America Online Lottery Industry Revenue Share (%), by Payment Mode 2025 & 2033
- Figure 8: North America Online Lottery Industry Revenue (billion), by End User 2025 & 2033
- Figure 9: North America Online Lottery Industry Revenue Share (%), by End User 2025 & 2033
- Figure 10: North America Online Lottery Industry Revenue (billion), by Country 2025 & 2033
- Figure 11: North America Online Lottery Industry Revenue Share (%), by Country 2025 & 2033
- Figure 12: Europe Online Lottery Industry Revenue (billion), by Game Type 2025 & 2033
- Figure 13: Europe Online Lottery Industry Revenue Share (%), by Game Type 2025 & 2033
- Figure 14: Europe Online Lottery Industry Revenue (billion), by Platform 2025 & 2033
- Figure 15: Europe Online Lottery Industry Revenue Share (%), by Platform 2025 & 2033
- Figure 16: Europe Online Lottery Industry Revenue (billion), by Payment Mode 2025 & 2033
- Figure 17: Europe Online Lottery Industry Revenue Share (%), by Payment Mode 2025 & 2033
- Figure 18: Europe Online Lottery Industry Revenue (billion), by End User 2025 & 2033
- Figure 19: Europe Online Lottery Industry Revenue Share (%), by End User 2025 & 2033
- Figure 20: Europe Online Lottery Industry Revenue (billion), by Country 2025 & 2033
- Figure 21: Europe Online Lottery Industry Revenue Share (%), by Country 2025 & 2033
- Figure 22: Asia Pacific Online Lottery Industry Revenue (billion), by Game Type 2025 & 2033
- Figure 23: Asia Pacific Online Lottery Industry Revenue Share (%), by Game Type 2025 & 2033
- Figure 24: Asia Pacific Online Lottery Industry Revenue (billion), by Platform 2025 & 2033
- Figure 25: Asia Pacific Online Lottery Industry Revenue Share (%), by Platform 2025 & 2033
- Figure 26: Asia Pacific Online Lottery Industry Revenue (billion), by Payment Mode 2025 & 2033
- Figure 27: Asia Pacific Online Lottery Industry Revenue Share (%), by Payment Mode 2025 & 2033
- Figure 28: Asia Pacific Online Lottery Industry Revenue (billion), by End User 2025 & 2033
- Figure 29: Asia Pacific Online Lottery Industry Revenue Share (%), by End User 2025 & 2033
- Figure 30: Asia Pacific Online Lottery Industry Revenue (billion), by Country 2025 & 2033
- Figure 31: Asia Pacific Online Lottery Industry Revenue Share (%), by Country 2025 & 2033
- Figure 32: South America Online Lottery Industry Revenue (billion), by Game Type 2025 & 2033
- Figure 33: South America Online Lottery Industry Revenue Share (%), by Game Type 2025 & 2033
- Figure 34: South America Online Lottery Industry Revenue (billion), by Platform 2025 & 2033
- Figure 35: South America Online Lottery Industry Revenue Share (%), by Platform 2025 & 2033
- Figure 36: South America Online Lottery Industry Revenue (billion), by Payment Mode 2025 & 2033
- Figure 37: South America Online Lottery Industry Revenue Share (%), by Payment Mode 2025 & 2033
- Figure 38: South America Online Lottery Industry Revenue (billion), by End User 2025 & 2033
- Figure 39: South America Online Lottery Industry Revenue Share (%), by End User 2025 & 2033
- Figure 40: South America Online Lottery Industry Revenue (billion), by Country 2025 & 2033
- Figure 41: South America Online Lottery Industry Revenue Share (%), by Country 2025 & 2033
- Figure 42: Middle East and Africa Online Lottery Industry Revenue (billion), by Game Type 2025 & 2033
- Figure 43: Middle East and Africa Online Lottery Industry Revenue Share (%), by Game Type 2025 & 2033
- Figure 44: Middle East and Africa Online Lottery Industry Revenue (billion), by Platform 2025 & 2033
- Figure 45: Middle East and Africa Online Lottery Industry Revenue Share (%), by Platform 2025 & 2033
- Figure 46: Middle East and Africa Online Lottery Industry Revenue (billion), by Payment Mode 2025 & 2033
- Figure 47: Middle East and Africa Online Lottery Industry Revenue Share (%), by Payment Mode 2025 & 2033
- Figure 48: Middle East and Africa Online Lottery Industry Revenue (billion), by End User 2025 & 2033
- Figure 49: Middle East and Africa Online Lottery Industry Revenue Share (%), by End User 2025 & 2033
- Figure 50: Middle East and Africa Online Lottery Industry Revenue (billion), by Country 2025 & 2033
- Figure 51: Middle East and Africa Online Lottery Industry Revenue Share (%), by Country 2025 & 2033
List of Tables
- Table 1: Global Online Lottery Industry Revenue billion Forecast, by Game Type 2020 & 2033
- Table 2: Global Online Lottery Industry Revenue billion Forecast, by Platform 2020 & 2033
- Table 3: Global Online Lottery Industry Revenue billion Forecast, by Payment Mode 2020 & 2033
- Table 4: Global Online Lottery Industry Revenue billion Forecast, by End User 2020 & 2033
- Table 5: Global Online Lottery Industry Revenue billion Forecast, by Region 2020 & 2033
- Table 6: Global Online Lottery Industry Revenue billion Forecast, by Game Type 2020 & 2033
- Table 7: Global Online Lottery Industry Revenue billion Forecast, by Platform 2020 & 2033
- Table 8: Global Online Lottery Industry Revenue billion Forecast, by Payment Mode 2020 & 2033
- Table 9: Global Online Lottery Industry Revenue billion Forecast, by End User 2020 & 2033
- Table 10: Global Online Lottery Industry Revenue billion Forecast, by Country 2020 & 2033
- Table 11: United States Online Lottery Industry Revenue (billion) Forecast, by Application 2020 & 2033
- Table 12: Canada Online Lottery Industry Revenue (billion) Forecast, by Application 2020 & 2033
- Table 13: Mexico Online Lottery Industry Revenue (billion) Forecast, by Application 2020 & 2033
- Table 14: Rest of North America Online Lottery Industry Revenue (billion) Forecast, by Application 2020 & 2033
- Table 15: Global Online Lottery Industry Revenue billion Forecast, by Game Type 2020 & 2033
- Table 16: Global Online Lottery Industry Revenue billion Forecast, by Platform 2020 & 2033
- Table 17: Global Online Lottery Industry Revenue billion Forecast, by Payment Mode 2020 & 2033
- Table 18: Global Online Lottery Industry Revenue billion Forecast, by End User 2020 & 2033
- Table 19: Global Online Lottery Industry Revenue billion Forecast, by Country 2020 & 2033
- Table 20: Spain Online Lottery Industry Revenue (billion) Forecast, by Application 2020 & 2033
- Table 21: United Kingdom Online Lottery Industry Revenue (billion) Forecast, by Application 2020 & 2033
- Table 22: Germany Online Lottery Industry Revenue (billion) Forecast, by Application 2020 & 2033
- Table 23: France Online Lottery Industry Revenue (billion) Forecast, by Application 2020 & 2033
- Table 24: Italy Online Lottery Industry Revenue (billion) Forecast, by Application 2020 & 2033
- Table 25: Sweden Online Lottery Industry Revenue (billion) Forecast, by Application 2020 & 2033
- Table 26: Rest of Europe Online Lottery Industry Revenue (billion) Forecast, by Application 2020 & 2033
- Table 27: Global Online Lottery Industry Revenue billion Forecast, by Game Type 2020 & 2033
- Table 28: Global Online Lottery Industry Revenue billion Forecast, by Platform 2020 & 2033
- Table 29: Global Online Lottery Industry Revenue billion Forecast, by Payment Mode 2020 & 2033
- Table 30: Global Online Lottery Industry Revenue billion Forecast, by End User 2020 & 2033
- Table 31: Global Online Lottery Industry Revenue billion Forecast, by Country 2020 & 2033
- Table 32: China Online Lottery Industry Revenue (billion) Forecast, by Application 2020 & 2033
- Table 33: India Online Lottery Industry Revenue (billion) Forecast, by Application 2020 & 2033
- Table 34: Japan Online Lottery Industry Revenue (billion) Forecast, by Application 2020 & 2033
- Table 35: Australia Online Lottery Industry Revenue (billion) Forecast, by Application 2020 & 2033
- Table 36: Rest of Asia Pacific Online Lottery Industry Revenue (billion) Forecast, by Application 2020 & 2033
- Table 37: Global Online Lottery Industry Revenue billion Forecast, by Game Type 2020 & 2033
- Table 38: Global Online Lottery Industry Revenue billion Forecast, by Platform 2020 & 2033
- Table 39: Global Online Lottery Industry Revenue billion Forecast, by Payment Mode 2020 & 2033
- Table 40: Global Online Lottery Industry Revenue billion Forecast, by End User 2020 & 2033
- Table 41: Global Online Lottery Industry Revenue billion Forecast, by Country 2020 & 2033
- Table 42: Brazil Online Lottery Industry Revenue (billion) Forecast, by Application 2020 & 2033
- Table 43: Argentina Online Lottery Industry Revenue (billion) Forecast, by Application 2020 & 2033
- Table 44: Rest of South America Online Lottery Industry Revenue (billion) Forecast, by Application 2020 & 2033
- Table 45: Global Online Lottery Industry Revenue billion Forecast, by Game Type 2020 & 2033
- Table 46: Global Online Lottery Industry Revenue billion Forecast, by Platform 2020 & 2033
- Table 47: Global Online Lottery Industry Revenue billion Forecast, by Payment Mode 2020 & 2033
- Table 48: Global Online Lottery Industry Revenue billion Forecast, by End User 2020 & 2033
- Table 49: Global Online Lottery Industry Revenue billion Forecast, by Country 2020 & 2033
- Table 50: South Africa Online Lottery Industry Revenue (billion) Forecast, by Application 2020 & 2033
- Table 51: United Arab Emirates Online Lottery Industry Revenue (billion) Forecast, by Application 2020 & 2033
- Table 52: Rest of Middle East and Africa Online Lottery Industry Revenue (billion) Forecast, by Application 2020 & 2033
Frequently Asked Questions
1. What is the projected Compound Annual Growth Rate (CAGR) of the Online Lottery Industry?
The projected CAGR is approximately 9.5%.
2. Which companies are prominent players in the Online Lottery Industry?
Key companies in the market include Lotto Direct Limited, Camelot Group, Lottoland, Lotto Agent, LottoKings, WinTrillions, Lotto, ZEAL Network SE, Française des Jeux, Annexio Limited, Others.
3. What are the main segments of the Online Lottery Industry?
The market segments include Game Type, Platform, Payment Mode, End User.
4. Can you provide details about the market size?
The market size is estimated to be USD 19.43 billion as of 2022.
5. What are some drivers contributing to market growth?
Growing Appeal for Multi-functional and Damage Control Hair Care Products; Prevalence of Different Hair Concerns Remains the Major Driving Force.
6. What are the notable trends driving market growth?
Improved Internet Connections. Advances in Security. and Increased Number of Internet Users.
7. Are there any restraints impacting market growth?
Growing Availability of Counterfeit Products.
8. Can you provide examples of recent developments in the market?
October 2022: Zeal Network SE expanded its games business internationally. The German market leader for online lotteries collaborated with American online lottery provider Park Avenue Gaming to integrate the online instant games of Zeal into its video lottery terminal business in Argentina and its online platforms in Peru.
9. What pricing options are available for accessing the report?
Pricing options include single-user, multi-user, and enterprise licenses priced at USD 4750, USD 5250, and USD 8750 respectively.
10. Is the market size provided in terms of value or volume?
The market size is provided in terms of value, measured in billion.
11. Are there any specific market keywords associated with the report?
Yes, the market keyword associated with the report is "Online Lottery Industry," which aids in identifying and referencing the specific market segment covered.
12. How do I determine which pricing option suits my needs best?
The pricing options vary based on user requirements and access needs. Individual users may opt for single-user licenses, while businesses requiring broader access may choose multi-user or enterprise licenses for cost-effective access to the report.
13. Are there any additional resources or data provided in the Online Lottery Industry report?
While the report offers comprehensive insights, it's advisable to review the specific contents or supplementary materials provided to ascertain if additional resources or data are available.
14. How can I stay updated on further developments or reports in the Online Lottery Industry?
To stay informed about further developments, trends, and reports in the Online Lottery Industry, consider subscribing to industry newsletters, following relevant companies and organizations, or regularly checking reputable industry news sources and publications.
Methodology
Step 1 - Identification of Relevant Samples Size from Population Database


Step 2 - Approaches for Defining Global Market Size (Value, Volume* & Price*)

Note*: In applicable scenarios
Step 3 - Data Sources
Primary Research
- Web Analytics
- Survey Reports
- Research Institute
- Latest Research Reports
- Opinion Leaders
Secondary Research
- Annual Reports
- White Paper
- Latest Press Release
- Industry Association
- Paid Database
- Investor Presentations

Step 4 - Data Triangulation
Involves using different sources of information in order to increase the validity of a study
These sources are likely to be stakeholders in a program - participants, other researchers, program staff, other community members, and so on.
Then we put all data in single framework & apply various statistical tools to find out the dynamic on the market.
During the analysis stage, feedback from the stakeholder groups would be compared to determine areas of agreement as well as areas of divergence