

Key Insights
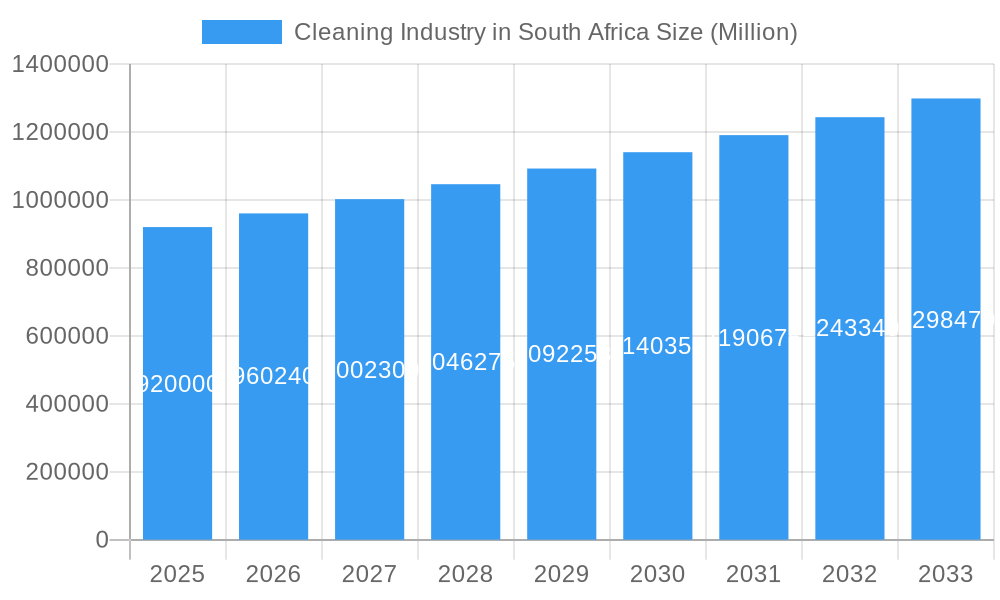
The South African cleaning industry is poised for robust expansion, projecting a market size of approximately USD 0.92 million with a Compound Annual Growth Rate (CAGR) of 4.38% between 2025 and 2033. This growth is primarily fueled by increasing urbanization, a rising awareness of hygiene and sanitation standards across both residential and commercial sectors, and the demand for more efficient and eco-friendly cleaning solutions. The commercial and industrial segment, encompassing hospitality, healthcare, and corporate offices, will likely dominate the market due to larger scale cleaning needs and investments in advanced equipment. However, the residential segment is also expected to witness significant growth, driven by a burgeoning middle class and greater disposable income leading to increased adoption of sophisticated cleaning appliances and specialized cleaning products.
Cleaning Industry in South Africa Market Size (In Billion)
Key drivers for this market expansion include technological advancements in cleaning equipment, leading to more powerful, user-friendly, and sustainable options. The growing concern for environmental impact is also pushing demand for green cleaning chemicals and consumables. Emerging trends such as the adoption of smart cleaning technologies, automation in industrial cleaning, and a greater focus on specialized cleaning services for niche markets will further shape the industry landscape. While the market presents significant opportunities, potential restraints may include the initial high cost of advanced cleaning equipment for smaller businesses and the availability of cheaper, less sophisticated alternatives. Furthermore, economic fluctuations and the need for skilled labor to operate complex machinery could pose challenges. The distribution channels are expected to see a balanced growth between traditional offline retail and the rapidly expanding online e-commerce platforms, offering consumers greater accessibility and choice.
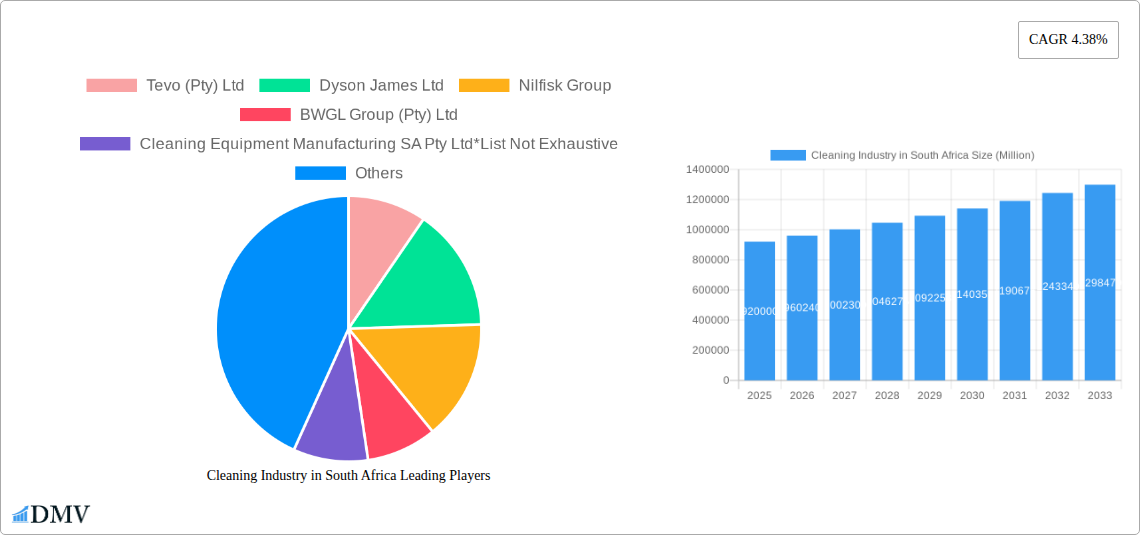
Cleaning Industry in South Africa Company Market Share
Cleaning Industry in South Africa Market Composition & Trends
The South African cleaning industry presents a dynamic landscape with moderate to high market concentration, driven by the growing demand for specialized cleaning solutions across residential and commercial sectors. Innovation is a key catalyst, with companies like Tevo (Pty) Ltd and Nilfisk Group investing in advanced cleaning equipment and eco-friendly consumables. Regulatory frameworks, while evolving, are increasingly focusing on sustainability and product safety, influencing the adoption of greener chemicals and powders. Substitute products, such as DIY cleaning solutions, pose a minor threat due to the convenience and efficacy of professional-grade offerings. End-user profiles are diverse, ranging from budget-conscious households seeking effective cleaning chemicals to large industrial clients requiring high-performance cleaning equipment. Mergers and acquisitions (M&A) activities are sporadic but significant, with deal values often in the tens of millions of Rand, aimed at consolidating market share and expanding product portfolios. For instance, the acquisition of smaller chemical suppliers by larger entities like BWGL Group (Pty) Ltd or Chemstrat signifies a strategic move to enhance distribution and product breadth. The market share distribution is skewed, with leading players capturing a substantial portion, while a multitude of smaller businesses compete in niche segments. The overall market value is projected to reach xx Million by 2025, with a compound annual growth rate (CAGR) of xx% over the forecast period.
Cleaning Industry in South Africa Industry Evolution
The South African cleaning industry has undergone a significant transformation, evolving from basic cleaning agents to sophisticated, technology-driven solutions. Over the study period of 2019–2033, the market has witnessed a consistent upward trajectory, particularly from the base year of 2025. This growth is largely attributed to increasing urbanization, a rising middle class with greater disposable income, and a heightened awareness of hygiene and sanitation standards. Technological advancements have been instrumental, with the introduction of smart cleaning equipment, such as robotic vacuum cleaners and advanced steam cleaners, by manufacturers like Robert Bosch GmbH and Miele & Cie KG. These innovations have not only improved cleaning efficiency but also enhanced user experience, particularly in the residential segment.
Furthermore, the commercial and industrial sectors have seen a surge in demand for specialized cleaning machinery and chemicals, driven by stringent health and safety regulations in industries like healthcare, food processing, and hospitality. The forecast period of 2025–2033 is expected to see an accelerated growth rate, projected at xx% annually, fueled by continued investment in R&D and the adoption of sustainable cleaning practices. Consumer demand is shifting towards eco-friendly products, leading to a greater market share for natural cleaning chemicals and biodegradable consumables. The shift from traditional cleaning methods to automated and efficient solutions is a defining characteristic of the industry's evolution. Adoption metrics for advanced cleaning equipment, such as cordless vacuum cleaners, have seen a significant uptick, with an estimated xx% increase in sales during the historical period of 2019–2024. The industry's resilience, as demonstrated during global health crises, has further solidified its importance and market potential.
Leading Regions, Countries, or Segments in Cleaning Industry in South Africa
The South African cleaning industry exhibits distinct dominance across several key segments, driven by evolving consumer needs and economic factors.
Product Type Dominance:
- Cleaning Equipment: This segment, particularly Vacuum Cleaners and High-Pressure Cleaners, commands a significant market share.
- Vacuum Cleaners: Driven by brands like Dyson James Ltd and Samsung, their popularity stems from increasing residential use and the demand for advanced, hygienic solutions. The introduction of cordless stick vacuums has particularly boosted this sub-segment.
- High-Pressure Cleaners: Essential for commercial and industrial applications, including car washes, building maintenance, and outdoor cleaning, this category sees strong demand from professional users. Alfred Karcher SE & Co KG is a prominent player here.
- Chemicals, Powders and Gels: This segment is equally crucial, encompassing a wide range of cleaning agents for diverse applications.
- Eco-friendly Chemicals: A rising trend, driven by consumer and regulatory pressure, is leading to substantial growth in this area. BWGL Group (Pty) Ltd's focus on natural products exemplifies this shift.
- Industrial Chemicals: For large-scale cleaning operations in manufacturing and other heavy industries, these remain a consistent demand driver.
End User Dominance:
- Commercial/Industrial: This segment represents the largest consumer base due to the extensive cleaning requirements in corporate offices, healthcare facilities, manufacturing plants, hotels, and retail spaces. The need for professional-grade equipment and bulk consumables drives consistent demand.
- Residential: While smaller than the commercial segment, the residential market is experiencing robust growth, fueled by rising disposable incomes and a greater emphasis on home hygiene. The adoption of advanced domestic cleaning equipment, like steam cleaners and high-performance vacuum cleaners, is a key indicator.
Distribution Channel Dominance:
- Offline Channel: Traditional retail stores, specialized equipment suppliers, and wholesale distributors continue to be the primary channels for reaching commercial and industrial clients, as well as a significant portion of the residential market. Their established networks and ability to provide demonstrations and after-sales service are critical.
- Online Channel: While still developing, the online channel is rapidly gaining traction, especially for consumables and smaller cleaning equipment. E-commerce platforms and direct-to-consumer sales are becoming increasingly important for reaching a broader consumer base and offering competitive pricing.
Key Drivers for Dominance:
- Investment Trends: Manufacturers like Nilfisk Group and Cleaning Equipment Manufacturing SA Pty Ltd are investing heavily in developing and marketing products tailored to the specific needs of the dominant segments.
- Regulatory Support: Government initiatives promoting hygiene standards and environmental sustainability indirectly support the growth of the cleaning industry, particularly in the commercial and industrial sectors.
- Technological Advancements: Innovations in product design, energy efficiency, and user-friendliness are crucial for maintaining dominance in segments like vacuum cleaners and steam cleaners.
Cleaning Industry in South Africa Product Innovations
The South African cleaning industry is characterized by a constant stream of innovative products designed to enhance efficiency, sustainability, and user convenience. Companies are increasingly focusing on advanced functionalities, such as smart connectivity in cleaning equipment, allowing for remote control and performance monitoring. For instance, Samsung's introduction of the industry-first all-new clean station for its Jet cordless stick vacuum cleaners exemplifies a leap in user-friendly, hygienic solutions. Product innovations also extend to eco-friendly formulations in cleaning chemicals and consumables, featuring biodegradable ingredients and reduced chemical footprints. Performance metrics like cleaning efficacy, energy consumption, and durability are paramount, with manufacturers like Miele & Cie KG setting high benchmarks. Unique selling propositions often revolve around a combination of powerful cleaning performance and environmental responsibility, catering to a growing segment of conscious consumers and businesses.
Propelling Factors for Cleaning Industry in South Africa Growth
Several key factors are driving the growth of the South African cleaning industry.
- Rising Hygiene Awareness: Post-pandemic, there's a heightened emphasis on cleanliness and sanitation across all sectors, leading to increased demand for cleaning products and services.
- Urbanization and Population Growth: Denser urban populations necessitate more efficient cleaning solutions for both residential and commercial spaces.
- Technological Advancements: Innovations in cleaning equipment, such as smart appliances and sustainable technologies, are creating new market opportunities and driving adoption.
- Economic Development: A growing economy leads to increased disposable income, allowing more households to invest in advanced cleaning solutions and professional cleaning services.
- Environmental Consciousness: The increasing demand for eco-friendly and sustainable cleaning chemicals and products is shaping product development and market preferences.
Obstacles in the Cleaning Industry in South Africa Market
Despite robust growth, the cleaning industry in South Africa faces several obstacles.
- Economic Volatility and Affordability: Fluctuations in the South African economy can impact consumer and business spending on non-essential cleaning products and equipment, with an estimated xx% reduction in discretionary spending during economic downturns.
- Supply Chain Disruptions: Reliance on imported raw materials and finished goods makes the industry vulnerable to global supply chain issues, potentially leading to price increases and stockouts.
- Intense Competition: The market is characterized by a mix of global players and local manufacturers, leading to price wars and pressure on profit margins, especially in commodity cleaning chemicals.
- Regulatory Compliance: Navigating complex environmental and safety regulations can be costly and time-consuming for smaller businesses.
- Informal Sector Competition: The presence of a large informal cleaning sector can pose challenges in terms of standardization and pricing.
Future Opportunities in Cleaning Industry in South Africa
The South African cleaning industry is poised for significant future opportunities, driven by evolving consumer trends and technological advancements.
- Growth in Sustainable Cleaning: The demand for eco-friendly and biodegradable cleaning products presents a substantial opportunity for companies specializing in green chemistry and sustainable formulations.
- Smart Cleaning Technology: The adoption of IoT-enabled cleaning equipment, such as robotic cleaners and smart disinfection systems, is expected to surge, particularly in commercial and industrial settings.
- Expansion in Healthcare and Hospitality: With a continued focus on hygiene in these sectors, there's an ongoing demand for specialized cleaning solutions and high-performance equipment.
- Emerging Markets: Exploring untapped potential in smaller towns and peri-urban areas can open up new customer bases for both product manufacturers and service providers.
- Subscription-Based Models: Offering cleaning product subscription services can provide recurring revenue streams and enhance customer loyalty.
Major Players in the Cleaning Industry in South Africa Ecosystem
- Tevo (Pty) Ltd
- Dyson James Ltd
- Nilfisk Group
- BWGL Group (Pty) Ltd
- Cleaning Equipment Manufacturing SA Pty Ltd
- Chemstrat
- Robert Bosch GmbH
- Alfred Karcher SE & Co KG
- Miele & Cie KG
- Nu-World Holdings Ltd
Key Developments in Cleaning Industry in South Africa Industry
- November 2021: South Africa's BWGL Group (Pty) Ltd, Lioness, launched a new range of natural and environmentally friendly cleaning products, responding to the growing demand for sustainable solutions.
- October 2021: Unilever SA launched Sunlight, the world's first dishwashing liquid to use captured carbon emissions, marking a significant advancement in eco-conscious product development within the Fast-Moving Consumer Goods (FMCG) cleaning segment.
- July 2021: Samsung introduced an industry-first all-new clean station named Samsung Jet cordless stick vacuum cleaners. The product delivers a high-performance, hygienic, user-friendly solution, making cleaning easier and contributing to the premiumization of the domestic appliance market.
Strategic Cleaning Industry in South Africa Market Forecast
The strategic outlook for the South African cleaning industry is highly positive, with sustained growth anticipated over the forecast period. Key growth catalysts include the increasing adoption of advanced cleaning technologies, a persistent demand for hygienic solutions across all sectors, and the burgeoning market for eco-friendly products. The commercial and industrial segments will continue to be major drivers, supported by robust economic activity and evolving regulatory standards. Furthermore, the expansion of online distribution channels and the rise of smart cleaning solutions present significant market potential. The industry is well-positioned to capitalize on these trends, with innovations in product development and strategic market penetration expected to drive value and efficiency.
Cleaning Industry in South Africa Segmentation
-
1. Product Type
-
1.1. Cleaning Equipment
- 1.1.1. Vaccum Cleaners
- 1.1.2. Steam Cleaners
- 1.1.3. High-Pressure Cleaners
- 1.1.4. Scrubbers/Polishers
- 1.1.5. Other Cleaning Equipement
- 1.2. Consumables
- 1.3. Chemicals, Powders and Gels
-
1.1. Cleaning Equipment
-
2. End User
- 2.1. Residential
- 2.2. Commercial/Industrial
-
3. Distribution Channel
- 3.1. Offline Channel
- 3.2. Online Channel
Cleaning Industry in South Africa Segmentation By Geography
-
1. North America
- 1.1. United States
- 1.2. Canada
- 1.3. Mexico
-
2. South America
- 2.1. Brazil
- 2.2. Argentina
- 2.3. Rest of South America
-
3. Europe
- 3.1. United Kingdom
- 3.2. Germany
- 3.3. France
- 3.4. Italy
- 3.5. Spain
- 3.6. Russia
- 3.7. Benelux
- 3.8. Nordics
- 3.9. Rest of Europe
-
4. Middle East & Africa
- 4.1. Turkey
- 4.2. Israel
- 4.3. GCC
- 4.4. North Africa
- 4.5. South Africa
- 4.6. Rest of Middle East & Africa
-
5. Asia Pacific
- 5.1. China
- 5.2. India
- 5.3. Japan
- 5.4. South Korea
- 5.5. ASEAN
- 5.6. Oceania
- 5.7. Rest of Asia Pacific
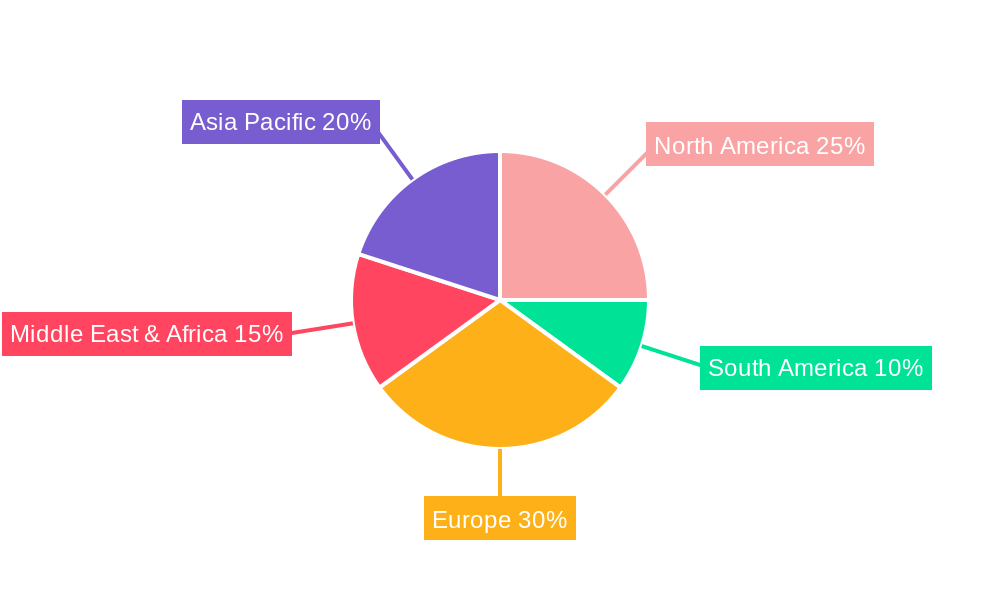
Cleaning Industry in South Africa Regional Market Share
Geographic Coverage of Cleaning Industry in South Africa
Cleaning Industry in South Africa REPORT HIGHLIGHTS
| Aspects | Details |
|---|---|
| Study Period | 2020-2034 |
| Base Year | 2025 |
| Estimated Year | 2026 |
| Forecast Period | 2026-2034 |
| Historical Period | 2020-2025 |
| Growth Rate | CAGR of 4.38% from 2020-2034 |
| Segmentation |
|
Table of Contents
- 1. Introduction
- 1.1. Research Scope
- 1.2. Market Segmentation
- 1.3. Research Objective
- 1.4. Definitions and Assumptions
- 2. Executive Summary
- 2.1. Market Snapshot
- 3. Market Dynamics
- 3.1. Market Drivers
- 3.2. Market Restrains
- 3.3. Market Trends
- 3.4. Market Opportunities
- 4. Market Factor Analysis
- 4.1. Porters Five Forces
- 4.1.1. Bargaining Power of Suppliers
- 4.1.2. Bargaining Power of Buyers
- 4.1.3. Threat of New Entrants
- 4.1.4. Threat of Substitutes
- 4.1.5. Competitive Rivalry
- 4.2. PESTEL analysis
- 4.3. BCG Analysis
- 4.3.1. Stars (High Growth, High Market Share)
- 4.3.2. Cash Cows (Low Growth, High Market Share)
- 4.3.3. Question Mark (High Growth, Low Market Share)
- 4.3.4. Dogs (Low Growth, Low Market Share)
- 4.4. Ansoff Matrix Analysis
- 4.5. Supply Chain Analysis
- 4.6. Regulatory Landscape
- 4.7. Current Market Potential and Opportunity Assessment (TAM–SAM–SOM Framework)
- 4.8. DMV Analyst Note
- 4.1. Porters Five Forces
- 5. Market Analysis, Insights and Forecast 2021-2033
- 5.1. Market Analysis, Insights and Forecast - by Product Type
- 5.1.1. Cleaning Equipment
- 5.1.1.1. Vaccum Cleaners
- 5.1.1.2. Steam Cleaners
- 5.1.1.3. High-Pressure Cleaners
- 5.1.1.4. Scrubbers/Polishers
- 5.1.1.5. Other Cleaning Equipement
- 5.1.2. Consumables
- 5.1.3. Chemicals, Powders and Gels
- 5.1.1. Cleaning Equipment
- 5.2. Market Analysis, Insights and Forecast - by End User
- 5.2.1. Residential
- 5.2.2. Commercial/Industrial
- 5.3. Market Analysis, Insights and Forecast - by Distribution Channel
- 5.3.1. Offline Channel
- 5.3.2. Online Channel
- 5.4. Market Analysis, Insights and Forecast - by Region
- 5.4.1. North America
- 5.4.2. South America
- 5.4.3. Europe
- 5.4.4. Middle East & Africa
- 5.4.5. Asia Pacific
- 5.1. Market Analysis, Insights and Forecast - by Product Type
- 6. Global Cleaning Industry in South Africa Analysis, Insights and Forecast, 2021-2033
- 6.1. Market Analysis, Insights and Forecast - by Product Type
- 6.1.1. Cleaning Equipment
- 6.1.1.1. Vaccum Cleaners
- 6.1.1.2. Steam Cleaners
- 6.1.1.3. High-Pressure Cleaners
- 6.1.1.4. Scrubbers/Polishers
- 6.1.1.5. Other Cleaning Equipement
- 6.1.2. Consumables
- 6.1.3. Chemicals, Powders and Gels
- 6.1.1. Cleaning Equipment
- 6.2. Market Analysis, Insights and Forecast - by End User
- 6.2.1. Residential
- 6.2.2. Commercial/Industrial
- 6.3. Market Analysis, Insights and Forecast - by Distribution Channel
- 6.3.1. Offline Channel
- 6.3.2. Online Channel
- 6.1. Market Analysis, Insights and Forecast - by Product Type
- 7. North America Cleaning Industry in South Africa Analysis, Insights and Forecast, 2020-2032
- 7.1. Market Analysis, Insights and Forecast - by Product Type
- 7.1.1. Cleaning Equipment
- 7.1.1.1. Vaccum Cleaners
- 7.1.1.2. Steam Cleaners
- 7.1.1.3. High-Pressure Cleaners
- 7.1.1.4. Scrubbers/Polishers
- 7.1.1.5. Other Cleaning Equipement
- 7.1.2. Consumables
- 7.1.3. Chemicals, Powders and Gels
- 7.1.1. Cleaning Equipment
- 7.2. Market Analysis, Insights and Forecast - by End User
- 7.2.1. Residential
- 7.2.2. Commercial/Industrial
- 7.3. Market Analysis, Insights and Forecast - by Distribution Channel
- 7.3.1. Offline Channel
- 7.3.2. Online Channel
- 7.1. Market Analysis, Insights and Forecast - by Product Type
- 8. South America Cleaning Industry in South Africa Analysis, Insights and Forecast, 2020-2032
- 8.1. Market Analysis, Insights and Forecast - by Product Type
- 8.1.1. Cleaning Equipment
- 8.1.1.1. Vaccum Cleaners
- 8.1.1.2. Steam Cleaners
- 8.1.1.3. High-Pressure Cleaners
- 8.1.1.4. Scrubbers/Polishers
- 8.1.1.5. Other Cleaning Equipement
- 8.1.2. Consumables
- 8.1.3. Chemicals, Powders and Gels
- 8.1.1. Cleaning Equipment
- 8.2. Market Analysis, Insights and Forecast - by End User
- 8.2.1. Residential
- 8.2.2. Commercial/Industrial
- 8.3. Market Analysis, Insights and Forecast - by Distribution Channel
- 8.3.1. Offline Channel
- 8.3.2. Online Channel
- 8.1. Market Analysis, Insights and Forecast - by Product Type
- 9. Europe Cleaning Industry in South Africa Analysis, Insights and Forecast, 2020-2032
- 9.1. Market Analysis, Insights and Forecast - by Product Type
- 9.1.1. Cleaning Equipment
- 9.1.1.1. Vaccum Cleaners
- 9.1.1.2. Steam Cleaners
- 9.1.1.3. High-Pressure Cleaners
- 9.1.1.4. Scrubbers/Polishers
- 9.1.1.5. Other Cleaning Equipement
- 9.1.2. Consumables
- 9.1.3. Chemicals, Powders and Gels
- 9.1.1. Cleaning Equipment
- 9.2. Market Analysis, Insights and Forecast - by End User
- 9.2.1. Residential
- 9.2.2. Commercial/Industrial
- 9.3. Market Analysis, Insights and Forecast - by Distribution Channel
- 9.3.1. Offline Channel
- 9.3.2. Online Channel
- 9.1. Market Analysis, Insights and Forecast - by Product Type
- 10. Middle East & Africa Cleaning Industry in South Africa Analysis, Insights and Forecast, 2020-2032
- 10.1. Market Analysis, Insights and Forecast - by Product Type
- 10.1.1. Cleaning Equipment
- 10.1.1.1. Vaccum Cleaners
- 10.1.1.2. Steam Cleaners
- 10.1.1.3. High-Pressure Cleaners
- 10.1.1.4. Scrubbers/Polishers
- 10.1.1.5. Other Cleaning Equipement
- 10.1.2. Consumables
- 10.1.3. Chemicals, Powders and Gels
- 10.1.1. Cleaning Equipment
- 10.2. Market Analysis, Insights and Forecast - by End User
- 10.2.1. Residential
- 10.2.2. Commercial/Industrial
- 10.3. Market Analysis, Insights and Forecast - by Distribution Channel
- 10.3.1. Offline Channel
- 10.3.2. Online Channel
- 10.1. Market Analysis, Insights and Forecast - by Product Type
- 11. Asia Pacific Cleaning Industry in South Africa Analysis, Insights and Forecast, 2020-2032
- 11.1. Market Analysis, Insights and Forecast - by Product Type
- 11.1.1. Cleaning Equipment
- 11.1.1.1. Vaccum Cleaners
- 11.1.1.2. Steam Cleaners
- 11.1.1.3. High-Pressure Cleaners
- 11.1.1.4. Scrubbers/Polishers
- 11.1.1.5. Other Cleaning Equipement
- 11.1.2. Consumables
- 11.1.3. Chemicals, Powders and Gels
- 11.1.1. Cleaning Equipment
- 11.2. Market Analysis, Insights and Forecast - by End User
- 11.2.1. Residential
- 11.2.2. Commercial/Industrial
- 11.3. Market Analysis, Insights and Forecast - by Distribution Channel
- 11.3.1. Offline Channel
- 11.3.2. Online Channel
- 11.1. Market Analysis, Insights and Forecast - by Product Type
- 12. Competitive Analysis
- 12.1. Company Profiles
- 12.1.1 Tevo (Pty) Ltd
- 12.1.1.1. Company Overview
- 12.1.1.2. Products
- 12.1.1.3. Company Financials
- 12.1.1.4. SWOT Analysis
- 12.1.2 Dyson James Ltd
- 12.1.2.1. Company Overview
- 12.1.2.2. Products
- 12.1.2.3. Company Financials
- 12.1.2.4. SWOT Analysis
- 12.1.3 Nilfisk Group
- 12.1.3.1. Company Overview
- 12.1.3.2. Products
- 12.1.3.3. Company Financials
- 12.1.3.4. SWOT Analysis
- 12.1.4 BWGL Group (Pty) Ltd
- 12.1.4.1. Company Overview
- 12.1.4.2. Products
- 12.1.4.3. Company Financials
- 12.1.4.4. SWOT Analysis
- 12.1.5 Cleaning Equipment Manufacturing SA Pty Ltd*List Not Exhaustive
- 12.1.5.1. Company Overview
- 12.1.5.2. Products
- 12.1.5.3. Company Financials
- 12.1.5.4. SWOT Analysis
- 12.1.6 Chemstrat
- 12.1.6.1. Company Overview
- 12.1.6.2. Products
- 12.1.6.3. Company Financials
- 12.1.6.4. SWOT Analysis
- 12.1.7 Robert Bosch GmbH
- 12.1.7.1. Company Overview
- 12.1.7.2. Products
- 12.1.7.3. Company Financials
- 12.1.7.4. SWOT Analysis
- 12.1.8 Alfred Karcher SE & Co KG
- 12.1.8.1. Company Overview
- 12.1.8.2. Products
- 12.1.8.3. Company Financials
- 12.1.8.4. SWOT Analysis
- 12.1.9 Miele & Cie KG
- 12.1.9.1. Company Overview
- 12.1.9.2. Products
- 12.1.9.3. Company Financials
- 12.1.9.4. SWOT Analysis
- 12.1.10 Nu-World Holdings Ltd
- 12.1.10.1. Company Overview
- 12.1.10.2. Products
- 12.1.10.3. Company Financials
- 12.1.10.4. SWOT Analysis
- 12.1.1 Tevo (Pty) Ltd
- 12.2. Market Entropy
- 12.2.1 Company's Key Areas Served
- 12.2.2 Recent Developments
- 12.3. Company Market Share Analysis 2025
- 12.3.1 Top 5 Companies Market Share Analysis
- 12.3.2 Top 3 Companies Market Share Analysis
- 12.4. List of Potential Customers
- 13. Research Methodology
List of Figures
- Figure 1: Global Cleaning Industry in South Africa Revenue Breakdown (Million, %) by Region 2025 & 2033
- Figure 2: North America Cleaning Industry in South Africa Revenue (Million), by Product Type 2025 & 2033
- Figure 3: North America Cleaning Industry in South Africa Revenue Share (%), by Product Type 2025 & 2033
- Figure 4: North America Cleaning Industry in South Africa Revenue (Million), by End User 2025 & 2033
- Figure 5: North America Cleaning Industry in South Africa Revenue Share (%), by End User 2025 & 2033
- Figure 6: North America Cleaning Industry in South Africa Revenue (Million), by Distribution Channel 2025 & 2033
- Figure 7: North America Cleaning Industry in South Africa Revenue Share (%), by Distribution Channel 2025 & 2033
- Figure 8: North America Cleaning Industry in South Africa Revenue (Million), by Country 2025 & 2033
- Figure 9: North America Cleaning Industry in South Africa Revenue Share (%), by Country 2025 & 2033
- Figure 10: South America Cleaning Industry in South Africa Revenue (Million), by Product Type 2025 & 2033
- Figure 11: South America Cleaning Industry in South Africa Revenue Share (%), by Product Type 2025 & 2033
- Figure 12: South America Cleaning Industry in South Africa Revenue (Million), by End User 2025 & 2033
- Figure 13: South America Cleaning Industry in South Africa Revenue Share (%), by End User 2025 & 2033
- Figure 14: South America Cleaning Industry in South Africa Revenue (Million), by Distribution Channel 2025 & 2033
- Figure 15: South America Cleaning Industry in South Africa Revenue Share (%), by Distribution Channel 2025 & 2033
- Figure 16: South America Cleaning Industry in South Africa Revenue (Million), by Country 2025 & 2033
- Figure 17: South America Cleaning Industry in South Africa Revenue Share (%), by Country 2025 & 2033
- Figure 18: Europe Cleaning Industry in South Africa Revenue (Million), by Product Type 2025 & 2033
- Figure 19: Europe Cleaning Industry in South Africa Revenue Share (%), by Product Type 2025 & 2033
- Figure 20: Europe Cleaning Industry in South Africa Revenue (Million), by End User 2025 & 2033
- Figure 21: Europe Cleaning Industry in South Africa Revenue Share (%), by End User 2025 & 2033
- Figure 22: Europe Cleaning Industry in South Africa Revenue (Million), by Distribution Channel 2025 & 2033
- Figure 23: Europe Cleaning Industry in South Africa Revenue Share (%), by Distribution Channel 2025 & 2033
- Figure 24: Europe Cleaning Industry in South Africa Revenue (Million), by Country 2025 & 2033
- Figure 25: Europe Cleaning Industry in South Africa Revenue Share (%), by Country 2025 & 2033
- Figure 26: Middle East & Africa Cleaning Industry in South Africa Revenue (Million), by Product Type 2025 & 2033
- Figure 27: Middle East & Africa Cleaning Industry in South Africa Revenue Share (%), by Product Type 2025 & 2033
- Figure 28: Middle East & Africa Cleaning Industry in South Africa Revenue (Million), by End User 2025 & 2033
- Figure 29: Middle East & Africa Cleaning Industry in South Africa Revenue Share (%), by End User 2025 & 2033
- Figure 30: Middle East & Africa Cleaning Industry in South Africa Revenue (Million), by Distribution Channel 2025 & 2033
- Figure 31: Middle East & Africa Cleaning Industry in South Africa Revenue Share (%), by Distribution Channel 2025 & 2033
- Figure 32: Middle East & Africa Cleaning Industry in South Africa Revenue (Million), by Country 2025 & 2033
- Figure 33: Middle East & Africa Cleaning Industry in South Africa Revenue Share (%), by Country 2025 & 2033
- Figure 34: Asia Pacific Cleaning Industry in South Africa Revenue (Million), by Product Type 2025 & 2033
- Figure 35: Asia Pacific Cleaning Industry in South Africa Revenue Share (%), by Product Type 2025 & 2033
- Figure 36: Asia Pacific Cleaning Industry in South Africa Revenue (Million), by End User 2025 & 2033
- Figure 37: Asia Pacific Cleaning Industry in South Africa Revenue Share (%), by End User 2025 & 2033
- Figure 38: Asia Pacific Cleaning Industry in South Africa Revenue (Million), by Distribution Channel 2025 & 2033
- Figure 39: Asia Pacific Cleaning Industry in South Africa Revenue Share (%), by Distribution Channel 2025 & 2033
- Figure 40: Asia Pacific Cleaning Industry in South Africa Revenue (Million), by Country 2025 & 2033
- Figure 41: Asia Pacific Cleaning Industry in South Africa Revenue Share (%), by Country 2025 & 2033
List of Tables
- Table 1: Global Cleaning Industry in South Africa Revenue Million Forecast, by Product Type 2020 & 2033
- Table 2: Global Cleaning Industry in South Africa Revenue Million Forecast, by End User 2020 & 2033
- Table 3: Global Cleaning Industry in South Africa Revenue Million Forecast, by Distribution Channel 2020 & 2033
- Table 4: Global Cleaning Industry in South Africa Revenue Million Forecast, by Region 2020 & 2033
- Table 5: Global Cleaning Industry in South Africa Revenue Million Forecast, by Product Type 2020 & 2033
- Table 6: Global Cleaning Industry in South Africa Revenue Million Forecast, by End User 2020 & 2033
- Table 7: Global Cleaning Industry in South Africa Revenue Million Forecast, by Distribution Channel 2020 & 2033
- Table 8: Global Cleaning Industry in South Africa Revenue Million Forecast, by Country 2020 & 2033
- Table 9: United States Cleaning Industry in South Africa Revenue (Million) Forecast, by Application 2020 & 2033
- Table 10: Canada Cleaning Industry in South Africa Revenue (Million) Forecast, by Application 2020 & 2033
- Table 11: Mexico Cleaning Industry in South Africa Revenue (Million) Forecast, by Application 2020 & 2033
- Table 12: Global Cleaning Industry in South Africa Revenue Million Forecast, by Product Type 2020 & 2033
- Table 13: Global Cleaning Industry in South Africa Revenue Million Forecast, by End User 2020 & 2033
- Table 14: Global Cleaning Industry in South Africa Revenue Million Forecast, by Distribution Channel 2020 & 2033
- Table 15: Global Cleaning Industry in South Africa Revenue Million Forecast, by Country 2020 & 2033
- Table 16: Brazil Cleaning Industry in South Africa Revenue (Million) Forecast, by Application 2020 & 2033
- Table 17: Argentina Cleaning Industry in South Africa Revenue (Million) Forecast, by Application 2020 & 2033
- Table 18: Rest of South America Cleaning Industry in South Africa Revenue (Million) Forecast, by Application 2020 & 2033
- Table 19: Global Cleaning Industry in South Africa Revenue Million Forecast, by Product Type 2020 & 2033
- Table 20: Global Cleaning Industry in South Africa Revenue Million Forecast, by End User 2020 & 2033
- Table 21: Global Cleaning Industry in South Africa Revenue Million Forecast, by Distribution Channel 2020 & 2033
- Table 22: Global Cleaning Industry in South Africa Revenue Million Forecast, by Country 2020 & 2033
- Table 23: United Kingdom Cleaning Industry in South Africa Revenue (Million) Forecast, by Application 2020 & 2033
- Table 24: Germany Cleaning Industry in South Africa Revenue (Million) Forecast, by Application 2020 & 2033
- Table 25: France Cleaning Industry in South Africa Revenue (Million) Forecast, by Application 2020 & 2033
- Table 26: Italy Cleaning Industry in South Africa Revenue (Million) Forecast, by Application 2020 & 2033
- Table 27: Spain Cleaning Industry in South Africa Revenue (Million) Forecast, by Application 2020 & 2033
- Table 28: Russia Cleaning Industry in South Africa Revenue (Million) Forecast, by Application 2020 & 2033
- Table 29: Benelux Cleaning Industry in South Africa Revenue (Million) Forecast, by Application 2020 & 2033
- Table 30: Nordics Cleaning Industry in South Africa Revenue (Million) Forecast, by Application 2020 & 2033
- Table 31: Rest of Europe Cleaning Industry in South Africa Revenue (Million) Forecast, by Application 2020 & 2033
- Table 32: Global Cleaning Industry in South Africa Revenue Million Forecast, by Product Type 2020 & 2033
- Table 33: Global Cleaning Industry in South Africa Revenue Million Forecast, by End User 2020 & 2033
- Table 34: Global Cleaning Industry in South Africa Revenue Million Forecast, by Distribution Channel 2020 & 2033
- Table 35: Global Cleaning Industry in South Africa Revenue Million Forecast, by Country 2020 & 2033
- Table 36: Turkey Cleaning Industry in South Africa Revenue (Million) Forecast, by Application 2020 & 2033
- Table 37: Israel Cleaning Industry in South Africa Revenue (Million) Forecast, by Application 2020 & 2033
- Table 38: GCC Cleaning Industry in South Africa Revenue (Million) Forecast, by Application 2020 & 2033
- Table 39: North Africa Cleaning Industry in South Africa Revenue (Million) Forecast, by Application 2020 & 2033
- Table 40: South Africa Cleaning Industry in South Africa Revenue (Million) Forecast, by Application 2020 & 2033
- Table 41: Rest of Middle East & Africa Cleaning Industry in South Africa Revenue (Million) Forecast, by Application 2020 & 2033
- Table 42: Global Cleaning Industry in South Africa Revenue Million Forecast, by Product Type 2020 & 2033
- Table 43: Global Cleaning Industry in South Africa Revenue Million Forecast, by End User 2020 & 2033
- Table 44: Global Cleaning Industry in South Africa Revenue Million Forecast, by Distribution Channel 2020 & 2033
- Table 45: Global Cleaning Industry in South Africa Revenue Million Forecast, by Country 2020 & 2033
- Table 46: China Cleaning Industry in South Africa Revenue (Million) Forecast, by Application 2020 & 2033
- Table 47: India Cleaning Industry in South Africa Revenue (Million) Forecast, by Application 2020 & 2033
- Table 48: Japan Cleaning Industry in South Africa Revenue (Million) Forecast, by Application 2020 & 2033
- Table 49: South Korea Cleaning Industry in South Africa Revenue (Million) Forecast, by Application 2020 & 2033
- Table 50: ASEAN Cleaning Industry in South Africa Revenue (Million) Forecast, by Application 2020 & 2033
- Table 51: Oceania Cleaning Industry in South Africa Revenue (Million) Forecast, by Application 2020 & 2033
- Table 52: Rest of Asia Pacific Cleaning Industry in South Africa Revenue (Million) Forecast, by Application 2020 & 2033
Frequently Asked Questions
1. What is the projected Compound Annual Growth Rate (CAGR) of the Cleaning Industry in South Africa?
The projected CAGR is approximately 4.38%.
2. Which companies are prominent players in the Cleaning Industry in South Africa?
Key companies in the market include Tevo (Pty) Ltd, Dyson James Ltd, Nilfisk Group, BWGL Group (Pty) Ltd, Cleaning Equipment Manufacturing SA Pty Ltd*List Not Exhaustive, Chemstrat, Robert Bosch GmbH, Alfred Karcher SE & Co KG, Miele & Cie KG, Nu-World Holdings Ltd.
3. What are the main segments of the Cleaning Industry in South Africa?
The market segments include Product Type, End User, Distribution Channel.
4. Can you provide details about the market size?
The market size is estimated to be USD 0.92 Million as of 2022.
5. What are some drivers contributing to market growth?
Rising Diabetic Population Across the Globe; Innovative and Fashionable Footwear.
6. What are the notable trends driving market growth?
Growing Penetration of Cleaning Products in Households.
7. Are there any restraints impacting market growth?
Enhanced Presence of Counterfeit and Poor-Quality Products.
8. Can you provide examples of recent developments in the market?
November 2021: South Africa's BWGL Group (Pty) Ltd, Lioness, launched a new range of natural and environmentally friendly cleaning products.
9. What pricing options are available for accessing the report?
Pricing options include single-user, multi-user, and enterprise licenses priced at USD 3800, USD 4500, and USD 5800 respectively.
10. Is the market size provided in terms of value or volume?
The market size is provided in terms of value, measured in Million.
11. Are there any specific market keywords associated with the report?
Yes, the market keyword associated with the report is "Cleaning Industry in South Africa," which aids in identifying and referencing the specific market segment covered.
12. How do I determine which pricing option suits my needs best?
The pricing options vary based on user requirements and access needs. Individual users may opt for single-user licenses, while businesses requiring broader access may choose multi-user or enterprise licenses for cost-effective access to the report.
13. Are there any additional resources or data provided in the Cleaning Industry in South Africa report?
While the report offers comprehensive insights, it's advisable to review the specific contents or supplementary materials provided to ascertain if additional resources or data are available.
14. How can I stay updated on further developments or reports in the Cleaning Industry in South Africa?
To stay informed about further developments, trends, and reports in the Cleaning Industry in South Africa, consider subscribing to industry newsletters, following relevant companies and organizations, or regularly checking reputable industry news sources and publications.
Methodology
Step 1 - Identification of Relevant Samples Size from Population Database


Step 2 - Approaches for Defining Global Market Size (Value, Volume* & Price*)

Note*: In applicable scenarios
Step 3 - Data Sources
Primary Research
- Web Analytics
- Survey Reports
- Research Institute
- Latest Research Reports
- Opinion Leaders
Secondary Research
- Annual Reports
- White Paper
- Latest Press Release
- Industry Association
- Paid Database
- Investor Presentations

Step 4 - Data Triangulation
Involves using different sources of information in order to increase the validity of a study
These sources are likely to be stakeholders in a program - participants, other researchers, program staff, other community members, and so on.
Then we put all data in single framework & apply various statistical tools to find out the dynamic on the market.
During the analysis stage, feedback from the stakeholder groups would be compared to determine areas of agreement as well as areas of divergence