

Key Insights
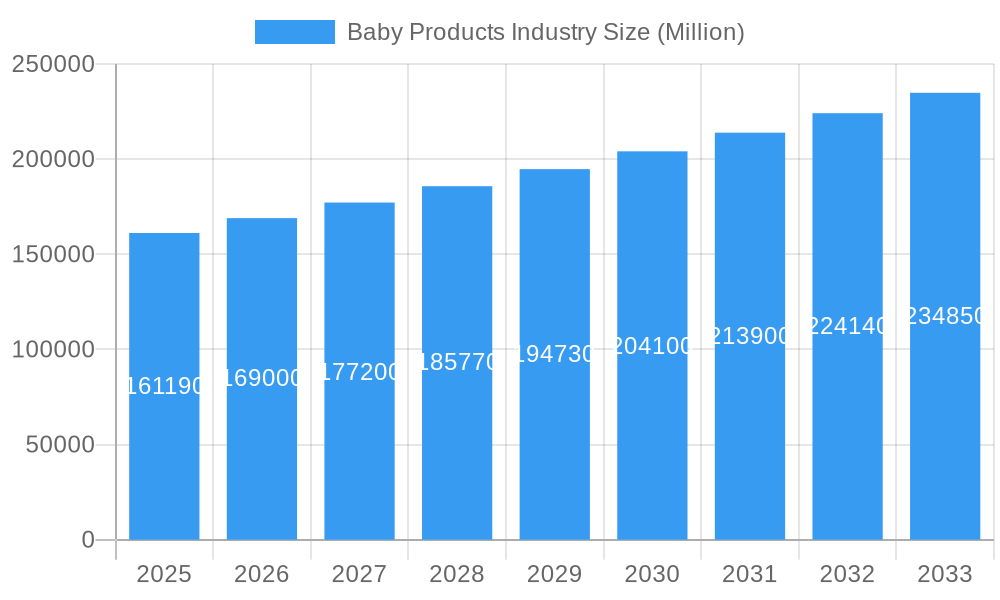
The global baby products market, valued at $161.19 billion in 2025, is projected to experience robust growth, driven by several key factors. Rising disposable incomes in developing economies, coupled with increasing awareness of hygiene and child health, are significantly boosting demand for baby products. The burgeoning middle class in Asia-Pacific, particularly in India and China, presents a considerable market opportunity. Furthermore, the growing trend of premiumization, with parents increasingly opting for organic, hypoallergenic, and sustainably sourced products, is shaping market dynamics. The online retail channel is experiencing exponential growth, offering convenience and a wider product selection, thus contributing significantly to overall market expansion. While fluctuating raw material prices and stringent regulatory requirements pose challenges, the long-term outlook for the baby products market remains positive, fueled by consistent population growth and shifting consumer preferences.
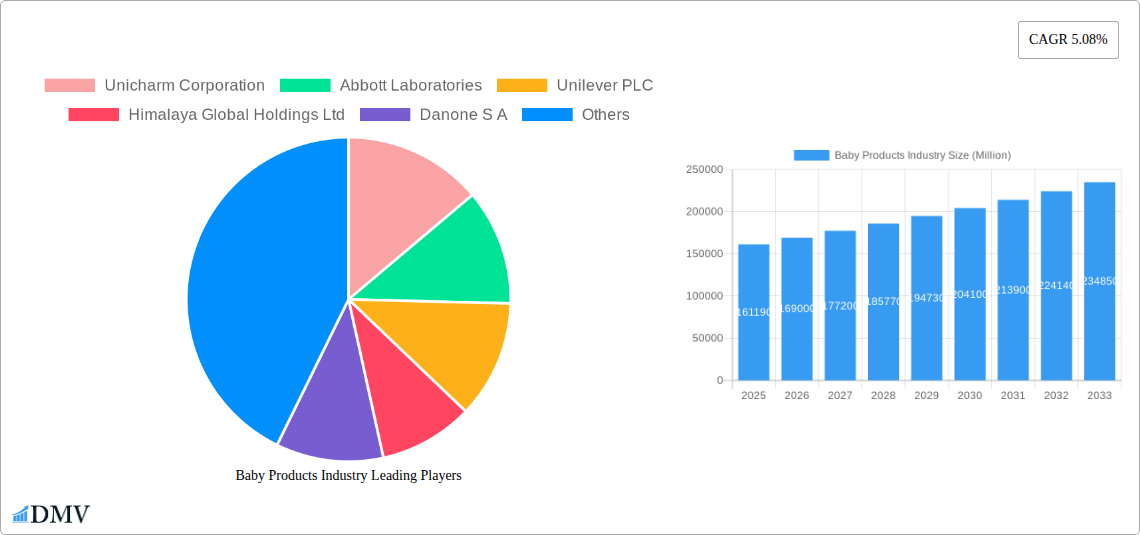
Baby Products Industry Market Size (In Billion)
Segment-wise, baby diapers and wipes currently dominate the market, followed by baby food and beverages. However, the baby skin and hair care segment is witnessing strong growth, driven by increasing consumer awareness of the importance of gentle and effective products for sensitive baby skin. The distribution channel analysis indicates that supermarkets/hypermarkets maintain a significant market share, although online retail is rapidly gaining ground. Key players like Unicharm, Abbott, Unilever, and Johnson & Johnson are leveraging innovation, brand reputation, and strategic acquisitions to maintain their competitive edge in this dynamic market. Regional growth varies, with Asia-Pacific expected to be a key driver of future expansion, surpassing North America and Europe in the coming years. The market is also likely to witness increased consolidation through mergers and acquisitions, as companies seek to optimize their portfolios and expand their market reach.
Baby Products Industry Company Market Share
Baby Products Industry Market Report: 2019-2033
This comprehensive report provides an in-depth analysis of the global baby products market, offering invaluable insights for stakeholders seeking to navigate this dynamic sector. With a study period spanning 2019-2033, a base year of 2025, and a forecast period of 2025-2033, this report delivers a robust understanding of past performance, current trends, and future projections, encompassing a market valued at $xx Million.
Baby Products Industry Market Composition & Trends
This section dissects the competitive landscape of the baby products market, examining market concentration, innovation drivers, regulatory influences, substitute products, end-user demographics, and merger and acquisition (M&A) activities. The report analyzes the market share distribution among key players like Unicharm Corporation, Abbott Laboratories, Unilever PLC, and Johnson & Johnson, revealing a moderately concentrated market with significant potential for further consolidation. M&A activity is assessed, with estimated deal values reaching $xx Million in the historical period (2019-2024). The impact of regulatory changes on product safety and labeling is also thoroughly explored, alongside an evaluation of substitute products and their market penetration. Detailed end-user profiles provide a granular understanding of consumer preferences and purchasing behaviors.
- Market Concentration: Moderately concentrated, with top 5 players holding approximately xx% market share.
- M&A Deal Value (2019-2024): Estimated at $xx Million.
- Key Regulatory Factors: Safety standards, labeling requirements, and environmental regulations.
- Substitute Product Analysis: Examines the impact of alternatives, including homemade baby food and reusable diapers.
Baby Products Industry Industry Evolution
This section details the evolution of the baby products industry, tracing its growth trajectory from 2019 to 2024 and projecting its future course until 2033. We analyze technological advancements, such as the introduction of smart baby monitors and personalized nutrition plans, and how these innovations have reshaped consumer preferences. The report further examines the impact of shifting consumer demands, including a growing preference for organic and sustainable products, and the implications of these trends for market growth. The Compound Annual Growth Rate (CAGR) for the historical period (2019-2024) is estimated at xx%, with a projected CAGR of xx% during the forecast period (2025-2033). Adoption rates for various innovative products are also quantified.
Leading Regions, Countries, or Segments in Baby Products Industry
This section pinpoints the dominant regions, countries, and segments within the baby products market. We identify leading distribution channels (Supermarkets/Hypermarkets, Convenience Stores, Pharmacies/Drug Stores, Online Retail Stores, Other Distribution Channels) and product types (Baby Skin Care, Baby Hair Care, Baby Toiletries, Baby Diapers and Wipes, Baby Food and Beverages) driving market growth. A detailed analysis explains the reasons behind their dominance.
- Dominant Regions: North America, Europe, and Asia-Pacific (specific country-level data provided).
- Leading Distribution Channel: Supermarkets/Hypermarkets (due to extensive reach and established supply chains).
- Fastest-Growing Product Segment: Baby Diapers and Wipes (driven by consistent demand and product innovation).
Key Drivers (Examples):
- High disposable incomes: Fueling demand for premium and specialized baby products in developed markets.
- Government initiatives: Supporting breastfeeding and promoting safe baby product use.
- E-commerce growth: Facilitating access to a wider range of products and brands.
Baby Products Industry Product Innovations
Recent years have witnessed significant innovations in baby products, focusing on enhanced safety, convenience, and sustainability. Key advancements include the development of hypoallergenic and organic formulations in skincare, eco-friendly diapers, and smart feeding technologies. These innovations are analyzed based on their unique selling propositions (USPs), performance metrics, and impact on market penetration. For example, the launch of Pampers Premium Care Diaper with its 360-degree coverage and built-in anti-rash features signifies a significant stride in diaper technology.
Propelling Factors for Baby Products Industry Growth
The baby products market is propelled by several key factors. Technological advancements, such as improved material science for diapers and personalized nutrition solutions, are key drivers. Economic factors, such as rising disposable incomes in emerging markets and increased spending on childcare, also contribute significantly to growth. Supportive regulatory frameworks, promoting product safety and standardization, further bolster market expansion.
Obstacles in the Baby Products Industry Market
Despite strong growth prospects, the baby products market faces several challenges. Stringent regulatory hurdles for new product approvals and variations in international standards pose significant barriers. Supply chain disruptions, particularly in raw material sourcing, can impact production and pricing. Intense competition among established players and the emergence of new entrants also create pressure on margins and market share.
Future Opportunities in Baby Products Industry
The future of the baby products industry is bright, with several promising opportunities. Expanding into emerging markets with rising birth rates offers significant potential for growth. Developing innovative products incorporating sustainable materials and digital technologies will capture growing consumer preferences. Personalized nutrition and customized skincare solutions will also cater to rising demand for tailored solutions.
Major Players in the Baby Products Industry Ecosystem
- Unicharm Corporation
- Abbott Laboratories
- Unilever PLC
- Himalaya Global Holdings Ltd
- Danone S A
- Kimberly-Clark Corporation
- Johnson & Johnson
- Procter & Gamble Company
- Royal Frieslandcampina N V
- Nestlé S A
Key Developments in Baby Products Industry Industry
- January 2024: Pampers launched a new Pampers Premium Care Diaper – a 360-degree coverage all-in-one diaper for babies. This launch signifies a move towards enhanced comfort and rash prevention.
- January 2024: Procter & Gamble Korea launched Pampers Baby-Dry Pants, focusing on improved absorbency. This strengthens P&G's position in the diaper market.
- February 2024: MamyPoko Pants launched Extra Absorb Pants with 30+ patented technologies, claiming up to 60% increased absorbency. This highlights ongoing innovation in diaper technology.
Strategic Baby Products Industry Market Forecast
The baby products market is poised for continued growth, driven by factors like rising birth rates in certain regions, increasing disposable incomes, and the ongoing innovation in product design and functionality. The market's potential is substantial, particularly in emerging markets and through the adoption of sustainable and technologically advanced products. The forecast period (2025-2033) anticipates significant expansion, with a projected market value reaching $xx Million by 2033.
Baby Products Industry Segmentation
-
1. Product Type
- 1.1. Baby Skin Care
- 1.2. Baby Hair Care
-
1.3. Baby Toiletries
- 1.3.1. Baby Bath Products and Fragrances
- 1.3.2. Baby Diapers and Wipes
- 1.4. Baby Food and Beverages
-
2. Distribution Channel
- 2.1. Supermarkets/Hypermarkets
- 2.2. Convenience Stores
- 2.3. Pharmacies/Drug Stores
- 2.4. Online Retail Stores
- 2.5. Other Distribution Channels
Baby Products Industry Segmentation By Geography
-
1. North America
- 1.1. United States
- 1.2. Canada
- 1.3. Mexico
- 1.4. Rest of North America
-
2. Europe
- 2.1. United Kingdom
- 2.2. Germany
- 2.3. Spain
- 2.4. France
- 2.5. Italy
- 2.6. Russia
- 2.7. Rest of Europe
-
3. Asia Pacific
- 3.1. China
- 3.2. Japan
- 3.3. India
- 3.4. Australia
- 3.5. Rest of Asia Pacific
-
4. South America
- 4.1. Brazil
- 4.2. Argentina
- 4.3. Rest of South America
-
5. Middle East and Africa
- 5.1. South Africa
- 5.2. Saudi Arabia
- 5.3. Rest of Middle East and Africa
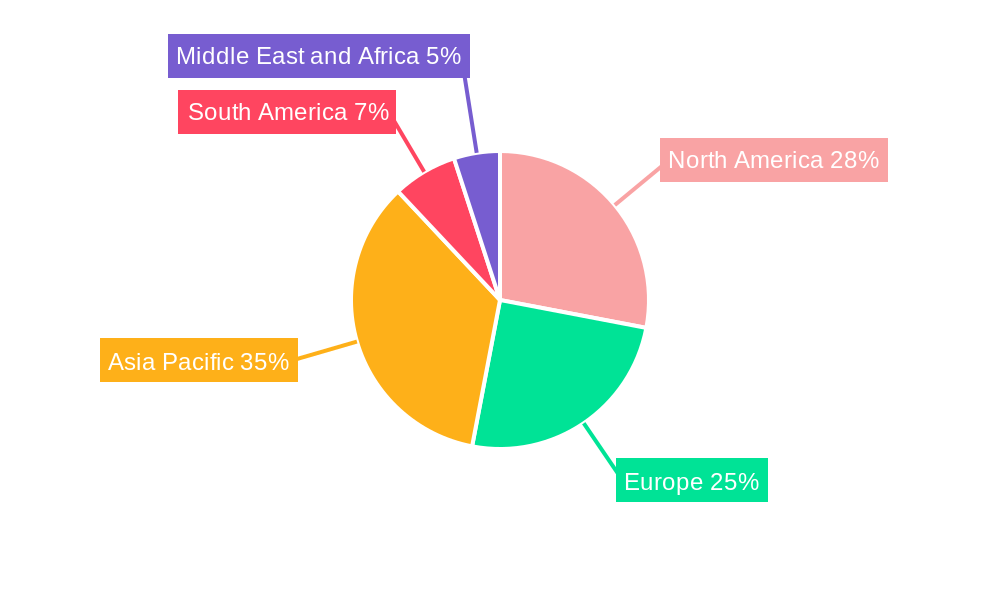
Baby Products Industry Regional Market Share
Geographic Coverage of Baby Products Industry
Baby Products Industry REPORT HIGHLIGHTS
| Aspects | Details |
|---|---|
| Study Period | 2020-2034 |
| Base Year | 2025 |
| Estimated Year | 2026 |
| Forecast Period | 2026-2034 |
| Historical Period | 2020-2025 |
| Growth Rate | CAGR of 5.08% from 2020-2034 |
| Segmentation |
|
Table of Contents
- 1. Introduction
- 1.1. Research Scope
- 1.2. Market Segmentation
- 1.3. Research Objective
- 1.4. Definitions and Assumptions
- 2. Executive Summary
- 2.1. Market Snapshot
- 3. Market Dynamics
- 3.1. Market Drivers
- 3.2. Market Restrains
- 3.3. Market Trends
- 3.4. Market Opportunities
- 4. Market Factor Analysis
- 4.1. Porters Five Forces
- 4.1.1. Bargaining Power of Suppliers
- 4.1.2. Bargaining Power of Buyers
- 4.1.3. Threat of New Entrants
- 4.1.4. Threat of Substitutes
- 4.1.5. Competitive Rivalry
- 4.2. PESTEL analysis
- 4.3. BCG Analysis
- 4.3.1. Stars (High Growth, High Market Share)
- 4.3.2. Cash Cows (Low Growth, High Market Share)
- 4.3.3. Question Mark (High Growth, Low Market Share)
- 4.3.4. Dogs (Low Growth, Low Market Share)
- 4.4. Ansoff Matrix Analysis
- 4.5. Supply Chain Analysis
- 4.6. Regulatory Landscape
- 4.7. Current Market Potential and Opportunity Assessment (TAM–SAM–SOM Framework)
- 4.8. DMV Analyst Note
- 4.1. Porters Five Forces
- 5. Market Analysis, Insights and Forecast 2021-2033
- 5.1. Market Analysis, Insights and Forecast - by Product Type
- 5.1.1. Baby Skin Care
- 5.1.2. Baby Hair Care
- 5.1.3. Baby Toiletries
- 5.1.3.1. Baby Bath Products and Fragrances
- 5.1.3.2. Baby Diapers and Wipes
- 5.1.4. Baby Food and Beverages
- 5.2. Market Analysis, Insights and Forecast - by Distribution Channel
- 5.2.1. Supermarkets/Hypermarkets
- 5.2.2. Convenience Stores
- 5.2.3. Pharmacies/Drug Stores
- 5.2.4. Online Retail Stores
- 5.2.5. Other Distribution Channels
- 5.3. Market Analysis, Insights and Forecast - by Region
- 5.3.1. North America
- 5.3.2. Europe
- 5.3.3. Asia Pacific
- 5.3.4. South America
- 5.3.5. Middle East and Africa
- 5.1. Market Analysis, Insights and Forecast - by Product Type
- 6. Global Baby Products Industry Analysis, Insights and Forecast, 2021-2033
- 6.1. Market Analysis, Insights and Forecast - by Product Type
- 6.1.1. Baby Skin Care
- 6.1.2. Baby Hair Care
- 6.1.3. Baby Toiletries
- 6.1.3.1. Baby Bath Products and Fragrances
- 6.1.3.2. Baby Diapers and Wipes
- 6.1.4. Baby Food and Beverages
- 6.2. Market Analysis, Insights and Forecast - by Distribution Channel
- 6.2.1. Supermarkets/Hypermarkets
- 6.2.2. Convenience Stores
- 6.2.3. Pharmacies/Drug Stores
- 6.2.4. Online Retail Stores
- 6.2.5. Other Distribution Channels
- 6.1. Market Analysis, Insights and Forecast - by Product Type
- 7. North America Baby Products Industry Analysis, Insights and Forecast, 2020-2032
- 7.1. Market Analysis, Insights and Forecast - by Product Type
- 7.1.1. Baby Skin Care
- 7.1.2. Baby Hair Care
- 7.1.3. Baby Toiletries
- 7.1.3.1. Baby Bath Products and Fragrances
- 7.1.3.2. Baby Diapers and Wipes
- 7.1.4. Baby Food and Beverages
- 7.2. Market Analysis, Insights and Forecast - by Distribution Channel
- 7.2.1. Supermarkets/Hypermarkets
- 7.2.2. Convenience Stores
- 7.2.3. Pharmacies/Drug Stores
- 7.2.4. Online Retail Stores
- 7.2.5. Other Distribution Channels
- 7.1. Market Analysis, Insights and Forecast - by Product Type
- 8. Europe Baby Products Industry Analysis, Insights and Forecast, 2020-2032
- 8.1. Market Analysis, Insights and Forecast - by Product Type
- 8.1.1. Baby Skin Care
- 8.1.2. Baby Hair Care
- 8.1.3. Baby Toiletries
- 8.1.3.1. Baby Bath Products and Fragrances
- 8.1.3.2. Baby Diapers and Wipes
- 8.1.4. Baby Food and Beverages
- 8.2. Market Analysis, Insights and Forecast - by Distribution Channel
- 8.2.1. Supermarkets/Hypermarkets
- 8.2.2. Convenience Stores
- 8.2.3. Pharmacies/Drug Stores
- 8.2.4. Online Retail Stores
- 8.2.5. Other Distribution Channels
- 8.1. Market Analysis, Insights and Forecast - by Product Type
- 9. Asia Pacific Baby Products Industry Analysis, Insights and Forecast, 2020-2032
- 9.1. Market Analysis, Insights and Forecast - by Product Type
- 9.1.1. Baby Skin Care
- 9.1.2. Baby Hair Care
- 9.1.3. Baby Toiletries
- 9.1.3.1. Baby Bath Products and Fragrances
- 9.1.3.2. Baby Diapers and Wipes
- 9.1.4. Baby Food and Beverages
- 9.2. Market Analysis, Insights and Forecast - by Distribution Channel
- 9.2.1. Supermarkets/Hypermarkets
- 9.2.2. Convenience Stores
- 9.2.3. Pharmacies/Drug Stores
- 9.2.4. Online Retail Stores
- 9.2.5. Other Distribution Channels
- 9.1. Market Analysis, Insights and Forecast - by Product Type
- 10. South America Baby Products Industry Analysis, Insights and Forecast, 2020-2032
- 10.1. Market Analysis, Insights and Forecast - by Product Type
- 10.1.1. Baby Skin Care
- 10.1.2. Baby Hair Care
- 10.1.3. Baby Toiletries
- 10.1.3.1. Baby Bath Products and Fragrances
- 10.1.3.2. Baby Diapers and Wipes
- 10.1.4. Baby Food and Beverages
- 10.2. Market Analysis, Insights and Forecast - by Distribution Channel
- 10.2.1. Supermarkets/Hypermarkets
- 10.2.2. Convenience Stores
- 10.2.3. Pharmacies/Drug Stores
- 10.2.4. Online Retail Stores
- 10.2.5. Other Distribution Channels
- 10.1. Market Analysis, Insights and Forecast - by Product Type
- 11. Middle East and Africa Baby Products Industry Analysis, Insights and Forecast, 2020-2032
- 11.1. Market Analysis, Insights and Forecast - by Product Type
- 11.1.1. Baby Skin Care
- 11.1.2. Baby Hair Care
- 11.1.3. Baby Toiletries
- 11.1.3.1. Baby Bath Products and Fragrances
- 11.1.3.2. Baby Diapers and Wipes
- 11.1.4. Baby Food and Beverages
- 11.2. Market Analysis, Insights and Forecast - by Distribution Channel
- 11.2.1. Supermarkets/Hypermarkets
- 11.2.2. Convenience Stores
- 11.2.3. Pharmacies/Drug Stores
- 11.2.4. Online Retail Stores
- 11.2.5. Other Distribution Channels
- 11.1. Market Analysis, Insights and Forecast - by Product Type
- 12. Competitive Analysis
- 12.1. Company Profiles
- 12.1.1 Unicharm Corporation
- 12.1.1.1. Company Overview
- 12.1.1.2. Products
- 12.1.1.3. Company Financials
- 12.1.1.4. SWOT Analysis
- 12.1.2 Abbott Laboratories
- 12.1.2.1. Company Overview
- 12.1.2.2. Products
- 12.1.2.3. Company Financials
- 12.1.2.4. SWOT Analysis
- 12.1.3 Unilever PLC
- 12.1.3.1. Company Overview
- 12.1.3.2. Products
- 12.1.3.3. Company Financials
- 12.1.3.4. SWOT Analysis
- 12.1.4 Himalaya Global Holdings Ltd
- 12.1.4.1. Company Overview
- 12.1.4.2. Products
- 12.1.4.3. Company Financials
- 12.1.4.4. SWOT Analysis
- 12.1.5 Danone S A
- 12.1.5.1. Company Overview
- 12.1.5.2. Products
- 12.1.5.3. Company Financials
- 12.1.5.4. SWOT Analysis
- 12.1.6 Kimberly-Clark Corporation
- 12.1.6.1. Company Overview
- 12.1.6.2. Products
- 12.1.6.3. Company Financials
- 12.1.6.4. SWOT Analysis
- 12.1.7 Johnson & Johnson
- 12.1.7.1. Company Overview
- 12.1.7.2. Products
- 12.1.7.3. Company Financials
- 12.1.7.4. SWOT Analysis
- 12.1.8 Procter & Gamble Company
- 12.1.8.1. Company Overview
- 12.1.8.2. Products
- 12.1.8.3. Company Financials
- 12.1.8.4. SWOT Analysis
- 12.1.9 Royal Frieslandcampina N V *List Not Exhaustive
- 12.1.9.1. Company Overview
- 12.1.9.2. Products
- 12.1.9.3. Company Financials
- 12.1.9.4. SWOT Analysis
- 12.1.10 Nestlé S A
- 12.1.10.1. Company Overview
- 12.1.10.2. Products
- 12.1.10.3. Company Financials
- 12.1.10.4. SWOT Analysis
- 12.1.1 Unicharm Corporation
- 12.2. Market Entropy
- 12.2.1 Company's Key Areas Served
- 12.2.2 Recent Developments
- 12.3. Company Market Share Analysis 2025
- 12.3.1 Top 5 Companies Market Share Analysis
- 12.3.2 Top 3 Companies Market Share Analysis
- 12.4. List of Potential Customers
- 13. Research Methodology
List of Figures
- Figure 1: Global Baby Products Industry Revenue Breakdown (Million, %) by Region 2025 & 2033
- Figure 2: Global Baby Products Industry Volume Breakdown (K Units, %) by Region 2025 & 2033
- Figure 3: North America Baby Products Industry Revenue (Million), by Product Type 2025 & 2033
- Figure 4: North America Baby Products Industry Volume (K Units), by Product Type 2025 & 2033
- Figure 5: North America Baby Products Industry Revenue Share (%), by Product Type 2025 & 2033
- Figure 6: North America Baby Products Industry Volume Share (%), by Product Type 2025 & 2033
- Figure 7: North America Baby Products Industry Revenue (Million), by Distribution Channel 2025 & 2033
- Figure 8: North America Baby Products Industry Volume (K Units), by Distribution Channel 2025 & 2033
- Figure 9: North America Baby Products Industry Revenue Share (%), by Distribution Channel 2025 & 2033
- Figure 10: North America Baby Products Industry Volume Share (%), by Distribution Channel 2025 & 2033
- Figure 11: North America Baby Products Industry Revenue (Million), by Country 2025 & 2033
- Figure 12: North America Baby Products Industry Volume (K Units), by Country 2025 & 2033
- Figure 13: North America Baby Products Industry Revenue Share (%), by Country 2025 & 2033
- Figure 14: North America Baby Products Industry Volume Share (%), by Country 2025 & 2033
- Figure 15: Europe Baby Products Industry Revenue (Million), by Product Type 2025 & 2033
- Figure 16: Europe Baby Products Industry Volume (K Units), by Product Type 2025 & 2033
- Figure 17: Europe Baby Products Industry Revenue Share (%), by Product Type 2025 & 2033
- Figure 18: Europe Baby Products Industry Volume Share (%), by Product Type 2025 & 2033
- Figure 19: Europe Baby Products Industry Revenue (Million), by Distribution Channel 2025 & 2033
- Figure 20: Europe Baby Products Industry Volume (K Units), by Distribution Channel 2025 & 2033
- Figure 21: Europe Baby Products Industry Revenue Share (%), by Distribution Channel 2025 & 2033
- Figure 22: Europe Baby Products Industry Volume Share (%), by Distribution Channel 2025 & 2033
- Figure 23: Europe Baby Products Industry Revenue (Million), by Country 2025 & 2033
- Figure 24: Europe Baby Products Industry Volume (K Units), by Country 2025 & 2033
- Figure 25: Europe Baby Products Industry Revenue Share (%), by Country 2025 & 2033
- Figure 26: Europe Baby Products Industry Volume Share (%), by Country 2025 & 2033
- Figure 27: Asia Pacific Baby Products Industry Revenue (Million), by Product Type 2025 & 2033
- Figure 28: Asia Pacific Baby Products Industry Volume (K Units), by Product Type 2025 & 2033
- Figure 29: Asia Pacific Baby Products Industry Revenue Share (%), by Product Type 2025 & 2033
- Figure 30: Asia Pacific Baby Products Industry Volume Share (%), by Product Type 2025 & 2033
- Figure 31: Asia Pacific Baby Products Industry Revenue (Million), by Distribution Channel 2025 & 2033
- Figure 32: Asia Pacific Baby Products Industry Volume (K Units), by Distribution Channel 2025 & 2033
- Figure 33: Asia Pacific Baby Products Industry Revenue Share (%), by Distribution Channel 2025 & 2033
- Figure 34: Asia Pacific Baby Products Industry Volume Share (%), by Distribution Channel 2025 & 2033
- Figure 35: Asia Pacific Baby Products Industry Revenue (Million), by Country 2025 & 2033
- Figure 36: Asia Pacific Baby Products Industry Volume (K Units), by Country 2025 & 2033
- Figure 37: Asia Pacific Baby Products Industry Revenue Share (%), by Country 2025 & 2033
- Figure 38: Asia Pacific Baby Products Industry Volume Share (%), by Country 2025 & 2033
- Figure 39: South America Baby Products Industry Revenue (Million), by Product Type 2025 & 2033
- Figure 40: South America Baby Products Industry Volume (K Units), by Product Type 2025 & 2033
- Figure 41: South America Baby Products Industry Revenue Share (%), by Product Type 2025 & 2033
- Figure 42: South America Baby Products Industry Volume Share (%), by Product Type 2025 & 2033
- Figure 43: South America Baby Products Industry Revenue (Million), by Distribution Channel 2025 & 2033
- Figure 44: South America Baby Products Industry Volume (K Units), by Distribution Channel 2025 & 2033
- Figure 45: South America Baby Products Industry Revenue Share (%), by Distribution Channel 2025 & 2033
- Figure 46: South America Baby Products Industry Volume Share (%), by Distribution Channel 2025 & 2033
- Figure 47: South America Baby Products Industry Revenue (Million), by Country 2025 & 2033
- Figure 48: South America Baby Products Industry Volume (K Units), by Country 2025 & 2033
- Figure 49: South America Baby Products Industry Revenue Share (%), by Country 2025 & 2033
- Figure 50: South America Baby Products Industry Volume Share (%), by Country 2025 & 2033
- Figure 51: Middle East and Africa Baby Products Industry Revenue (Million), by Product Type 2025 & 2033
- Figure 52: Middle East and Africa Baby Products Industry Volume (K Units), by Product Type 2025 & 2033
- Figure 53: Middle East and Africa Baby Products Industry Revenue Share (%), by Product Type 2025 & 2033
- Figure 54: Middle East and Africa Baby Products Industry Volume Share (%), by Product Type 2025 & 2033
- Figure 55: Middle East and Africa Baby Products Industry Revenue (Million), by Distribution Channel 2025 & 2033
- Figure 56: Middle East and Africa Baby Products Industry Volume (K Units), by Distribution Channel 2025 & 2033
- Figure 57: Middle East and Africa Baby Products Industry Revenue Share (%), by Distribution Channel 2025 & 2033
- Figure 58: Middle East and Africa Baby Products Industry Volume Share (%), by Distribution Channel 2025 & 2033
- Figure 59: Middle East and Africa Baby Products Industry Revenue (Million), by Country 2025 & 2033
- Figure 60: Middle East and Africa Baby Products Industry Volume (K Units), by Country 2025 & 2033
- Figure 61: Middle East and Africa Baby Products Industry Revenue Share (%), by Country 2025 & 2033
- Figure 62: Middle East and Africa Baby Products Industry Volume Share (%), by Country 2025 & 2033
List of Tables
- Table 1: Global Baby Products Industry Revenue Million Forecast, by Product Type 2020 & 2033
- Table 2: Global Baby Products Industry Volume K Units Forecast, by Product Type 2020 & 2033
- Table 3: Global Baby Products Industry Revenue Million Forecast, by Distribution Channel 2020 & 2033
- Table 4: Global Baby Products Industry Volume K Units Forecast, by Distribution Channel 2020 & 2033
- Table 5: Global Baby Products Industry Revenue Million Forecast, by Region 2020 & 2033
- Table 6: Global Baby Products Industry Volume K Units Forecast, by Region 2020 & 2033
- Table 7: Global Baby Products Industry Revenue Million Forecast, by Product Type 2020 & 2033
- Table 8: Global Baby Products Industry Volume K Units Forecast, by Product Type 2020 & 2033
- Table 9: Global Baby Products Industry Revenue Million Forecast, by Distribution Channel 2020 & 2033
- Table 10: Global Baby Products Industry Volume K Units Forecast, by Distribution Channel 2020 & 2033
- Table 11: Global Baby Products Industry Revenue Million Forecast, by Country 2020 & 2033
- Table 12: Global Baby Products Industry Volume K Units Forecast, by Country 2020 & 2033
- Table 13: United States Baby Products Industry Revenue (Million) Forecast, by Application 2020 & 2033
- Table 14: United States Baby Products Industry Volume (K Units) Forecast, by Application 2020 & 2033
- Table 15: Canada Baby Products Industry Revenue (Million) Forecast, by Application 2020 & 2033
- Table 16: Canada Baby Products Industry Volume (K Units) Forecast, by Application 2020 & 2033
- Table 17: Mexico Baby Products Industry Revenue (Million) Forecast, by Application 2020 & 2033
- Table 18: Mexico Baby Products Industry Volume (K Units) Forecast, by Application 2020 & 2033
- Table 19: Rest of North America Baby Products Industry Revenue (Million) Forecast, by Application 2020 & 2033
- Table 20: Rest of North America Baby Products Industry Volume (K Units) Forecast, by Application 2020 & 2033
- Table 21: Global Baby Products Industry Revenue Million Forecast, by Product Type 2020 & 2033
- Table 22: Global Baby Products Industry Volume K Units Forecast, by Product Type 2020 & 2033
- Table 23: Global Baby Products Industry Revenue Million Forecast, by Distribution Channel 2020 & 2033
- Table 24: Global Baby Products Industry Volume K Units Forecast, by Distribution Channel 2020 & 2033
- Table 25: Global Baby Products Industry Revenue Million Forecast, by Country 2020 & 2033
- Table 26: Global Baby Products Industry Volume K Units Forecast, by Country 2020 & 2033
- Table 27: United Kingdom Baby Products Industry Revenue (Million) Forecast, by Application 2020 & 2033
- Table 28: United Kingdom Baby Products Industry Volume (K Units) Forecast, by Application 2020 & 2033
- Table 29: Germany Baby Products Industry Revenue (Million) Forecast, by Application 2020 & 2033
- Table 30: Germany Baby Products Industry Volume (K Units) Forecast, by Application 2020 & 2033
- Table 31: Spain Baby Products Industry Revenue (Million) Forecast, by Application 2020 & 2033
- Table 32: Spain Baby Products Industry Volume (K Units) Forecast, by Application 2020 & 2033
- Table 33: France Baby Products Industry Revenue (Million) Forecast, by Application 2020 & 2033
- Table 34: France Baby Products Industry Volume (K Units) Forecast, by Application 2020 & 2033
- Table 35: Italy Baby Products Industry Revenue (Million) Forecast, by Application 2020 & 2033
- Table 36: Italy Baby Products Industry Volume (K Units) Forecast, by Application 2020 & 2033
- Table 37: Russia Baby Products Industry Revenue (Million) Forecast, by Application 2020 & 2033
- Table 38: Russia Baby Products Industry Volume (K Units) Forecast, by Application 2020 & 2033
- Table 39: Rest of Europe Baby Products Industry Revenue (Million) Forecast, by Application 2020 & 2033
- Table 40: Rest of Europe Baby Products Industry Volume (K Units) Forecast, by Application 2020 & 2033
- Table 41: Global Baby Products Industry Revenue Million Forecast, by Product Type 2020 & 2033
- Table 42: Global Baby Products Industry Volume K Units Forecast, by Product Type 2020 & 2033
- Table 43: Global Baby Products Industry Revenue Million Forecast, by Distribution Channel 2020 & 2033
- Table 44: Global Baby Products Industry Volume K Units Forecast, by Distribution Channel 2020 & 2033
- Table 45: Global Baby Products Industry Revenue Million Forecast, by Country 2020 & 2033
- Table 46: Global Baby Products Industry Volume K Units Forecast, by Country 2020 & 2033
- Table 47: China Baby Products Industry Revenue (Million) Forecast, by Application 2020 & 2033
- Table 48: China Baby Products Industry Volume (K Units) Forecast, by Application 2020 & 2033
- Table 49: Japan Baby Products Industry Revenue (Million) Forecast, by Application 2020 & 2033
- Table 50: Japan Baby Products Industry Volume (K Units) Forecast, by Application 2020 & 2033
- Table 51: India Baby Products Industry Revenue (Million) Forecast, by Application 2020 & 2033
- Table 52: India Baby Products Industry Volume (K Units) Forecast, by Application 2020 & 2033
- Table 53: Australia Baby Products Industry Revenue (Million) Forecast, by Application 2020 & 2033
- Table 54: Australia Baby Products Industry Volume (K Units) Forecast, by Application 2020 & 2033
- Table 55: Rest of Asia Pacific Baby Products Industry Revenue (Million) Forecast, by Application 2020 & 2033
- Table 56: Rest of Asia Pacific Baby Products Industry Volume (K Units) Forecast, by Application 2020 & 2033
- Table 57: Global Baby Products Industry Revenue Million Forecast, by Product Type 2020 & 2033
- Table 58: Global Baby Products Industry Volume K Units Forecast, by Product Type 2020 & 2033
- Table 59: Global Baby Products Industry Revenue Million Forecast, by Distribution Channel 2020 & 2033
- Table 60: Global Baby Products Industry Volume K Units Forecast, by Distribution Channel 2020 & 2033
- Table 61: Global Baby Products Industry Revenue Million Forecast, by Country 2020 & 2033
- Table 62: Global Baby Products Industry Volume K Units Forecast, by Country 2020 & 2033
- Table 63: Brazil Baby Products Industry Revenue (Million) Forecast, by Application 2020 & 2033
- Table 64: Brazil Baby Products Industry Volume (K Units) Forecast, by Application 2020 & 2033
- Table 65: Argentina Baby Products Industry Revenue (Million) Forecast, by Application 2020 & 2033
- Table 66: Argentina Baby Products Industry Volume (K Units) Forecast, by Application 2020 & 2033
- Table 67: Rest of South America Baby Products Industry Revenue (Million) Forecast, by Application 2020 & 2033
- Table 68: Rest of South America Baby Products Industry Volume (K Units) Forecast, by Application 2020 & 2033
- Table 69: Global Baby Products Industry Revenue Million Forecast, by Product Type 2020 & 2033
- Table 70: Global Baby Products Industry Volume K Units Forecast, by Product Type 2020 & 2033
- Table 71: Global Baby Products Industry Revenue Million Forecast, by Distribution Channel 2020 & 2033
- Table 72: Global Baby Products Industry Volume K Units Forecast, by Distribution Channel 2020 & 2033
- Table 73: Global Baby Products Industry Revenue Million Forecast, by Country 2020 & 2033
- Table 74: Global Baby Products Industry Volume K Units Forecast, by Country 2020 & 2033
- Table 75: South Africa Baby Products Industry Revenue (Million) Forecast, by Application 2020 & 2033
- Table 76: South Africa Baby Products Industry Volume (K Units) Forecast, by Application 2020 & 2033
- Table 77: Saudi Arabia Baby Products Industry Revenue (Million) Forecast, by Application 2020 & 2033
- Table 78: Saudi Arabia Baby Products Industry Volume (K Units) Forecast, by Application 2020 & 2033
- Table 79: Rest of Middle East and Africa Baby Products Industry Revenue (Million) Forecast, by Application 2020 & 2033
- Table 80: Rest of Middle East and Africa Baby Products Industry Volume (K Units) Forecast, by Application 2020 & 2033
Frequently Asked Questions
1. What is the projected Compound Annual Growth Rate (CAGR) of the Baby Products Industry?
The projected CAGR is approximately 5.08%.
2. Which companies are prominent players in the Baby Products Industry?
Key companies in the market include Unicharm Corporation, Abbott Laboratories, Unilever PLC, Himalaya Global Holdings Ltd, Danone S A, Kimberly-Clark Corporation, Johnson & Johnson, Procter & Gamble Company, Royal Frieslandcampina N V *List Not Exhaustive, Nestlé S A.
3. What are the main segments of the Baby Products Industry?
The market segments include Product Type, Distribution Channel.
4. Can you provide details about the market size?
The market size is estimated to be USD 161.19 Million as of 2022.
5. What are some drivers contributing to market growth?
Concerns Among Parents Toward Baby Personal Care and Hygiene; Influence of Endorsements and Aggressive Marketing.
6. What are the notable trends driving market growth?
Increasing Preference for Fortified Baby Food.
7. Are there any restraints impacting market growth?
Presence of Counterfeit Products.
8. Can you provide examples of recent developments in the market?
February 2024: MamyPoko Pants launched Extra Absorb Pants with 30+ patented technologies. The diapers are claimed to be up to 60% absorbent.
9. What pricing options are available for accessing the report?
Pricing options include single-user, multi-user, and enterprise licenses priced at USD 4750, USD 5250, and USD 8750 respectively.
10. Is the market size provided in terms of value or volume?
The market size is provided in terms of value, measured in Million and volume, measured in K Units.
11. Are there any specific market keywords associated with the report?
Yes, the market keyword associated with the report is "Baby Products Industry," which aids in identifying and referencing the specific market segment covered.
12. How do I determine which pricing option suits my needs best?
The pricing options vary based on user requirements and access needs. Individual users may opt for single-user licenses, while businesses requiring broader access may choose multi-user or enterprise licenses for cost-effective access to the report.
13. Are there any additional resources or data provided in the Baby Products Industry report?
While the report offers comprehensive insights, it's advisable to review the specific contents or supplementary materials provided to ascertain if additional resources or data are available.
14. How can I stay updated on further developments or reports in the Baby Products Industry?
To stay informed about further developments, trends, and reports in the Baby Products Industry, consider subscribing to industry newsletters, following relevant companies and organizations, or regularly checking reputable industry news sources and publications.
Methodology
Step 1 - Identification of Relevant Samples Size from Population Database


Step 2 - Approaches for Defining Global Market Size (Value, Volume* & Price*)

Note*: In applicable scenarios
Step 3 - Data Sources
Primary Research
- Web Analytics
- Survey Reports
- Research Institute
- Latest Research Reports
- Opinion Leaders
Secondary Research
- Annual Reports
- White Paper
- Latest Press Release
- Industry Association
- Paid Database
- Investor Presentations

Step 4 - Data Triangulation
Involves using different sources of information in order to increase the validity of a study
These sources are likely to be stakeholders in a program - participants, other researchers, program staff, other community members, and so on.
Then we put all data in single framework & apply various statistical tools to find out the dynamic on the market.
During the analysis stage, feedback from the stakeholder groups would be compared to determine areas of agreement as well as areas of divergence