

Key Insights
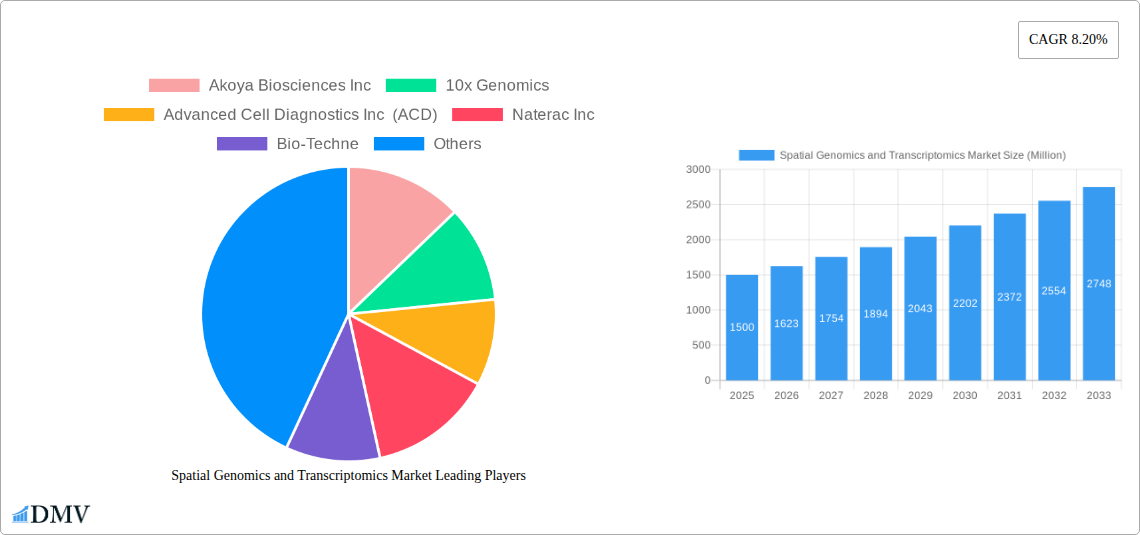
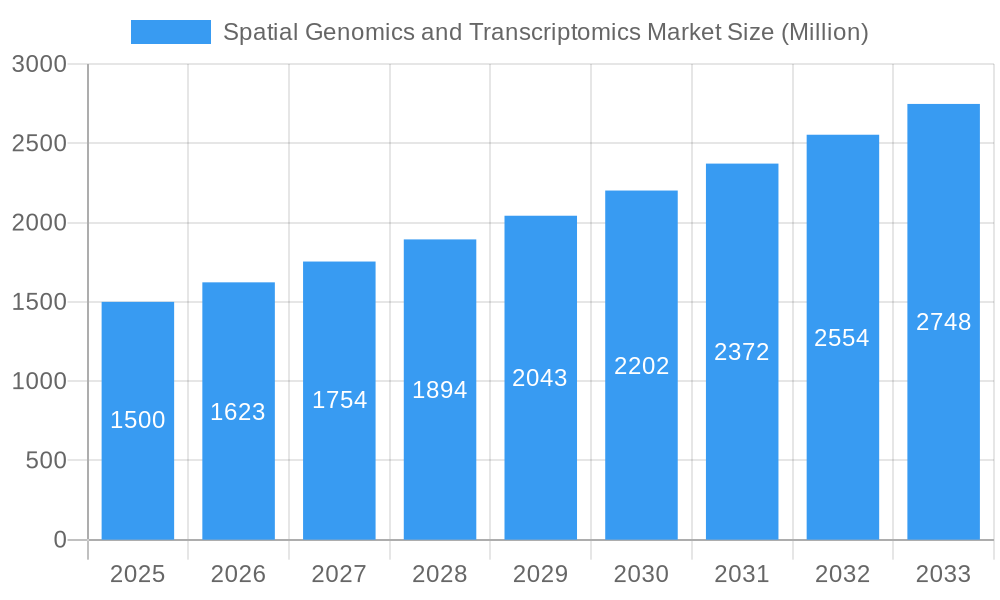
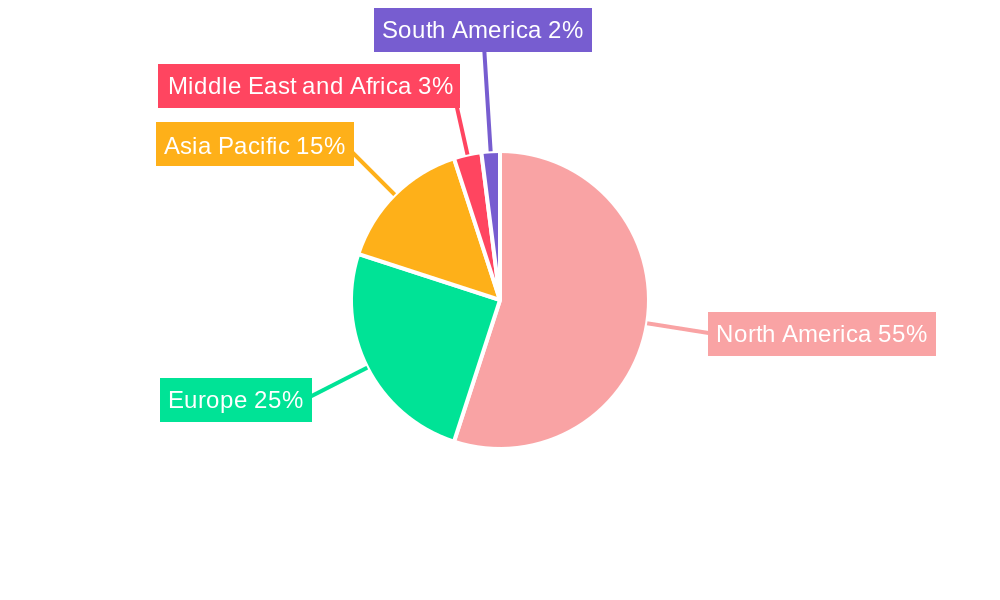
The Spatial Genomics and Transcriptomics market is experiencing robust growth, driven by the increasing need for high-resolution, spatially resolved analyses in biological research and clinical diagnostics. The market's Compound Annual Growth Rate (CAGR) of 8.20% from 2019 to 2024 suggests a significant expansion, projected to continue throughout the forecast period (2025-2033). This growth is fueled by advancements in technologies like spatial transcriptomics and spatial genomics, enabling researchers to understand the complex interplay between gene expression and cellular organization within tissues. Key applications are found in oncology, immunology, neuroscience, and drug discovery, where the ability to visualize cellular heterogeneity and spatial context is crucial for developing targeted therapies and diagnostics. The market is segmented by technology (Spatial Transcriptomics and Spatial Genomics), product (Instruments, Software, and Consumables), and end-user (Pharmaceutical Manufacturers, Diagnostic Customers, and Others). The dominance of North America, attributed to strong research infrastructure and funding, is expected to persist, although other regions, especially Asia Pacific, are showing promising growth trajectories due to increasing research investments and expanding healthcare infrastructure. The competitive landscape includes established players like 10x Genomics, Illumina, and Akoya Biosciences, alongside emerging companies developing innovative technologies and applications. Continued technological advancements, expanding applications, and increasing collaborations are expected to further propel market growth.
Spatial Genomics and Transcriptomics Market Market Size (In Billion)
The market's substantial growth potential stems from several factors. The decreasing cost of sequencing and the rise of sophisticated bioinformatics tools are making spatial genomics and transcriptomics accessible to a wider range of researchers. This improved accessibility has fueled broader adoption across various research areas and translational applications. The substantial investment in life sciences research globally, including government grants and venture capital, has directly contributed to the market expansion. Furthermore, the growing need for personalized medicine and the development of targeted therapies are creating strong demand for technologies providing detailed spatial information about biological samples, ensuring the continued success of the Spatial Genomics and Transcriptomics Market. The market is expected to reach a significant value by 2033.
Spatial Genomics and Transcriptomics Market Company Market Share
Spatial Genomics and Transcriptomics Market: A Comprehensive Report (2019-2033)
This insightful report provides a detailed analysis of the Spatial Genomics and Transcriptomics market, offering a comprehensive overview of market trends, leading players, technological advancements, and future growth prospects. The study period spans from 2019 to 2033, with 2025 serving as the base and estimated year. The forecast period covers 2025-2033, while the historical period encompasses 2019-2024. This report is invaluable for stakeholders seeking to understand and capitalize on opportunities within this rapidly evolving market. The market is projected to reach xx Million by 2033.
Spatial Genomics and Transcriptomics Market Market Composition & Trends
The Spatial Genomics and Transcriptomics market exhibits a moderately concentrated landscape, with key players such as Akoya Biosciences Inc, 10x Genomics, Advanced Cell Diagnostics Inc (ACD), Naterac Inc, Bio-Techne, Illumina Inc, Fluidigm, S2 Genomics Inc, Seven Bridges Genomics, Dovetail Genomics, NanoString Technologies Inc, and Horizon Discovery Group plc holding significant market share. Innovation is driven by advancements in sequencing technologies, data analysis software, and the development of novel applications in oncology and drug discovery. The regulatory landscape varies across regions, influencing market entry and product approvals. Substitute products are limited, strengthening the market's growth trajectory. The market is largely driven by pharmaceutical manufacturers and diagnostic customers, with others contributing a smaller segment. M&A activities have been observed, though deal values remain undisclosed in many instances, indicating strategic consolidation within the industry. Market share distribution is currently dominated by a few major players, with a more fragmented landscape emerging at the smaller company level.
- Market Share Distribution (2025): Illumina Inc. (xx%), 10x Genomics (xx%), Akoya Biosciences Inc. (xx%), Others (xx%)
- M&A Deal Values (2019-2024): xx Million (cumulative)
Spatial Genomics and Transcriptomics Market Industry Evolution
The Spatial Genomics and Transcriptomics market has witnessed substantial growth over the past five years, fueled by technological advancements and increased demand for precise spatial information in biological research. The market is expanding at a Compound Annual Growth Rate (CAGR) of xx% during the historical period (2019-2024) and is projected to grow at a CAGR of xx% during the forecast period (2025-2033). This growth is driven by several factors: the increasing adoption of next-generation sequencing (NGS) technologies, the development of advanced spatial transcriptomics platforms, the rising demand for personalized medicine and precision oncology, and increasing research funding for spatial biology. Adoption metrics, such as the number of research papers published, showcase a significant increase in the usage of spatial genomics and transcriptomics technologies over recent years, indicating rapid market penetration and future growth potential. The development of more user-friendly software, coupled with decreased instrument costs, has broadened accessibility to researchers globally. Shifting consumer demands are increasingly focused on higher throughput, better data resolution, and seamless integration with existing workflows. This is leading to innovative solutions and collaborations among market players.
Leading Regions, Countries, or Segments in Spatial Genomics and Transcriptomics Market
By Technology: Spatial Transcriptomics currently holds a larger market share compared to Spatial Genomics, driven by its earlier maturity and wider adoption. However, Spatial Genomics is expected to experience faster growth due to its higher resolution capabilities and emerging applications.
By Product: Instruments represent the largest market segment due to the high initial investment required. Software and consumables follow, representing a significant revenue stream for market players. Software growth is particularly robust due to increasing demand for sophisticated data analysis tools.
By End-User: Pharmaceutical manufacturers currently dominate the market, investing heavily in spatial biology research for drug discovery and development. Diagnostic customers represent a rapidly growing segment, leveraging spatial insights for improved disease diagnosis and prognosis.
Key Drivers:
- North America: High research funding, presence of key players, and early adoption of advanced technologies
- Europe: Growing government initiatives, expanding research infrastructure, and increasing collaborations among academic institutions and industry
- Asia Pacific: Rapidly increasing research activities, rising healthcare expenditure, and favorable government policies.
Spatial Genomics and Transcriptomics Market Product Innovations
Recent innovations focus on improving spatial resolution, increasing throughput, and simplifying workflow complexity. New instruments offer multiplexing capabilities, enabling the simultaneous detection of numerous genes or proteins within a single tissue sample. Advanced software solutions provide user-friendly interfaces for data analysis and visualization. Improvements in consumables, such as reagents and probes, enhance sensitivity and accuracy. Unique selling propositions include streamlined workflows, reduced costs, and higher data quality. These advancements are leading to wider applications in various fields, such as oncology, immunology, neuroscience, and developmental biology.
Propelling Factors for Spatial Genomics and Transcriptomics Market Growth
The market's growth is fueled by several factors: increasing demand for personalized medicine, advancements in NGS technologies offering higher resolution data, increasing research funding in spatial biology, development of user-friendly software for data analysis, and collaborations between academic institutions and industry to drive innovation and applications in clinical diagnostics and drug development. Government support in multiple regions is contributing to accelerated growth as well.
Obstacles in the Spatial Genomics and Transcriptomics Market Market
Challenges include the high cost of instruments and consumables, which limits accessibility, particularly for researchers in low-resource settings. The complexity of data analysis necessitates specialized expertise, potentially restricting widespread adoption. Regulatory hurdles for new technologies and applications can also slow market penetration. Competitive pressures among established and emerging players further shape the market dynamics. Supply chain disruptions can impact the availability of critical components and reagents.
Future Opportunities in Spatial Genomics and Transcriptomics Market
Emerging opportunities exist in expanding applications beyond traditional research areas, such as in agriculture and environmental science. The development of novel technologies, such as single-cell spatial profiling and multi-omics integration, presents significant growth potential. The growing demand for spatial biology in clinical diagnostics and personalized medicine will drive market expansion.
Major Players in the Spatial Genomics and Transcriptomics Market Ecosystem
- Akoya Biosciences Inc
- 10x Genomics
- Advanced Cell Diagnostics Inc (ACD)
- Naterac Inc
- Bio-Techne
- Illumina Inc
- Fluidigm
- S2 Genomics Inc
- Seven Bridges Genomics
- Dovetail Genomics
- NanoString Technologies Inc
- Horizon Discovery Group plc
Key Developments in Spatial Genomics and Transcriptomics Market Industry
May 2022: NanoString announced a seamless, cloud-based workflow improving spatial data analysis for customers using Illumina NextSeq 1000/2000 systems and the GeoMx Digital Spatial Profiler, boosting spatial biology research via NGS. This development enhanced user experience and data analysis capabilities for a large user group, expanding the application range of spatial biology research.
January 2022: Illumina Inc. and Nashville Biosciences LLC partnered to use Illumina's NGS platforms for a clinical genomic resource, accelerating new medicine development. This collaboration highlights the growing role of spatial genomics in drug discovery and development, creating a significant market driver.
Strategic Spatial Genomics and Transcriptomics Market Market Forecast
The Spatial Genomics and Transcriptomics market is poised for continued strong growth, driven by technological innovation, expanding applications, and increasing investments in research and development. Future opportunities lie in the development of integrated multi-omics platforms, expansion into new clinical applications, and the creation of user-friendly software tools to facilitate wider adoption. The market's potential is substantial, with ongoing advancements likely to further propel its trajectory in the coming years.
Spatial Genomics and Transcriptomics Market Segmentation
-
1. Technology
- 1.1. Spatial Transcriptomics
- 1.2. Spatial Genomics
-
2. Product
- 2.1. Instruments
- 2.2. Software
- 2.3. Consumables
-
3. End-User
- 3.1. Pharmaceutical Manufacturer
- 3.2. Diagnostic Customers
- 3.3. Others
Spatial Genomics and Transcriptomics Market Segmentation By Geography
-
1. North America
- 1.1. United States
- 1.2. Canada
- 1.3. Mexico
-
2. Europe
- 2.1. Germany
- 2.2. United Kingdom
- 2.3. France
- 2.4. Italy
- 2.5. Spain
- 2.6. Rest of Europe
-
3. Asia Pacific
- 3.1. China
- 3.2. Japan
- 3.3. India
- 3.4. Australia
- 3.5. South Korea
- 3.6. Rest of Asia Pacific
-
4. Middle East and Africa
- 4.1. GCC
- 4.2. South Africa
- 4.3. Rest of Middle East and Africa
-
5. South America
- 5.1. Brazil
- 5.2. Argentina
- 5.3. Rest of South America
Spatial Genomics and Transcriptomics Market Regional Market Share
Geographic Coverage of Spatial Genomics and Transcriptomics Market
Spatial Genomics and Transcriptomics Market REPORT HIGHLIGHTS
| Aspects | Details |
|---|---|
| Study Period | 2020-2034 |
| Base Year | 2025 |
| Estimated Year | 2026 |
| Forecast Period | 2026-2034 |
| Historical Period | 2020-2025 |
| Growth Rate | CAGR of 12.62% from 2020-2034 |
| Segmentation |
|
Table of Contents
- 1. Introduction
- 1.1. Research Scope
- 1.2. Market Segmentation
- 1.3. Research Objective
- 1.4. Definitions and Assumptions
- 2. Executive Summary
- 2.1. Market Snapshot
- 3. Market Dynamics
- 3.1. Market Drivers
- 3.2. Market Restrains
- 3.3. Market Trends
- 3.4. Market Opportunities
- 4. Market Factor Analysis
- 4.1. Porters Five Forces
- 4.1.1. Bargaining Power of Suppliers
- 4.1.2. Bargaining Power of Buyers
- 4.1.3. Threat of New Entrants
- 4.1.4. Threat of Substitutes
- 4.1.5. Competitive Rivalry
- 4.2. PESTEL analysis
- 4.3. BCG Analysis
- 4.3.1. Stars (High Growth, High Market Share)
- 4.3.2. Cash Cows (Low Growth, High Market Share)
- 4.3.3. Question Mark (High Growth, Low Market Share)
- 4.3.4. Dogs (Low Growth, Low Market Share)
- 4.4. Ansoff Matrix Analysis
- 4.5. Supply Chain Analysis
- 4.6. Regulatory Landscape
- 4.7. Current Market Potential and Opportunity Assessment (TAM–SAM–SOM Framework)
- 4.8. DMV Analyst Note
- 4.1. Porters Five Forces
- 5. Market Analysis, Insights and Forecast 2021-2033
- 5.1. Market Analysis, Insights and Forecast - by Technology
- 5.1.1. Spatial Transcriptomics
- 5.1.2. Spatial Genomics
- 5.2. Market Analysis, Insights and Forecast - by Product
- 5.2.1. Instruments
- 5.2.2. Software
- 5.2.3. Consumables
- 5.3. Market Analysis, Insights and Forecast - by End-User
- 5.3.1. Pharmaceutical Manufacturer
- 5.3.2. Diagnostic Customers
- 5.3.3. Others
- 5.4. Market Analysis, Insights and Forecast - by Region
- 5.4.1. North America
- 5.4.2. Europe
- 5.4.3. Asia Pacific
- 5.4.4. Middle East and Africa
- 5.4.5. South America
- 5.1. Market Analysis, Insights and Forecast - by Technology
- 6. Global Spatial Genomics and Transcriptomics Market Analysis, Insights and Forecast, 2021-2033
- 6.1. Market Analysis, Insights and Forecast - by Technology
- 6.1.1. Spatial Transcriptomics
- 6.1.2. Spatial Genomics
- 6.2. Market Analysis, Insights and Forecast - by Product
- 6.2.1. Instruments
- 6.2.2. Software
- 6.2.3. Consumables
- 6.3. Market Analysis, Insights and Forecast - by End-User
- 6.3.1. Pharmaceutical Manufacturer
- 6.3.2. Diagnostic Customers
- 6.3.3. Others
- 6.1. Market Analysis, Insights and Forecast - by Technology
- 7. North America Spatial Genomics and Transcriptomics Market Analysis, Insights and Forecast, 2020-2032
- 7.1. Market Analysis, Insights and Forecast - by Technology
- 7.1.1. Spatial Transcriptomics
- 7.1.2. Spatial Genomics
- 7.2. Market Analysis, Insights and Forecast - by Product
- 7.2.1. Instruments
- 7.2.2. Software
- 7.2.3. Consumables
- 7.3. Market Analysis, Insights and Forecast - by End-User
- 7.3.1. Pharmaceutical Manufacturer
- 7.3.2. Diagnostic Customers
- 7.3.3. Others
- 7.1. Market Analysis, Insights and Forecast - by Technology
- 8. Europe Spatial Genomics and Transcriptomics Market Analysis, Insights and Forecast, 2020-2032
- 8.1. Market Analysis, Insights and Forecast - by Technology
- 8.1.1. Spatial Transcriptomics
- 8.1.2. Spatial Genomics
- 8.2. Market Analysis, Insights and Forecast - by Product
- 8.2.1. Instruments
- 8.2.2. Software
- 8.2.3. Consumables
- 8.3. Market Analysis, Insights and Forecast - by End-User
- 8.3.1. Pharmaceutical Manufacturer
- 8.3.2. Diagnostic Customers
- 8.3.3. Others
- 8.1. Market Analysis, Insights and Forecast - by Technology
- 9. Asia Pacific Spatial Genomics and Transcriptomics Market Analysis, Insights and Forecast, 2020-2032
- 9.1. Market Analysis, Insights and Forecast - by Technology
- 9.1.1. Spatial Transcriptomics
- 9.1.2. Spatial Genomics
- 9.2. Market Analysis, Insights and Forecast - by Product
- 9.2.1. Instruments
- 9.2.2. Software
- 9.2.3. Consumables
- 9.3. Market Analysis, Insights and Forecast - by End-User
- 9.3.1. Pharmaceutical Manufacturer
- 9.3.2. Diagnostic Customers
- 9.3.3. Others
- 9.1. Market Analysis, Insights and Forecast - by Technology
- 10. Middle East and Africa Spatial Genomics and Transcriptomics Market Analysis, Insights and Forecast, 2020-2032
- 10.1. Market Analysis, Insights and Forecast - by Technology
- 10.1.1. Spatial Transcriptomics
- 10.1.2. Spatial Genomics
- 10.2. Market Analysis, Insights and Forecast - by Product
- 10.2.1. Instruments
- 10.2.2. Software
- 10.2.3. Consumables
- 10.3. Market Analysis, Insights and Forecast - by End-User
- 10.3.1. Pharmaceutical Manufacturer
- 10.3.2. Diagnostic Customers
- 10.3.3. Others
- 10.1. Market Analysis, Insights and Forecast - by Technology
- 11. South America Spatial Genomics and Transcriptomics Market Analysis, Insights and Forecast, 2020-2032
- 11.1. Market Analysis, Insights and Forecast - by Technology
- 11.1.1. Spatial Transcriptomics
- 11.1.2. Spatial Genomics
- 11.2. Market Analysis, Insights and Forecast - by Product
- 11.2.1. Instruments
- 11.2.2. Software
- 11.2.3. Consumables
- 11.3. Market Analysis, Insights and Forecast - by End-User
- 11.3.1. Pharmaceutical Manufacturer
- 11.3.2. Diagnostic Customers
- 11.3.3. Others
- 11.1. Market Analysis, Insights and Forecast - by Technology
- 12. Competitive Analysis
- 12.1. Company Profiles
- 12.1.1 Akoya Biosciences Inc
- 12.1.1.1. Company Overview
- 12.1.1.2. Products
- 12.1.1.3. Company Financials
- 12.1.1.4. SWOT Analysis
- 12.1.2 10x Genomics
- 12.1.2.1. Company Overview
- 12.1.2.2. Products
- 12.1.2.3. Company Financials
- 12.1.2.4. SWOT Analysis
- 12.1.3 Advanced Cell Diagnostics Inc (ACD)
- 12.1.3.1. Company Overview
- 12.1.3.2. Products
- 12.1.3.3. Company Financials
- 12.1.3.4. SWOT Analysis
- 12.1.4 Naterac Inc
- 12.1.4.1. Company Overview
- 12.1.4.2. Products
- 12.1.4.3. Company Financials
- 12.1.4.4. SWOT Analysis
- 12.1.5 Bio-Techne
- 12.1.5.1. Company Overview
- 12.1.5.2. Products
- 12.1.5.3. Company Financials
- 12.1.5.4. SWOT Analysis
- 12.1.6 Illumina Inc
- 12.1.6.1. Company Overview
- 12.1.6.2. Products
- 12.1.6.3. Company Financials
- 12.1.6.4. SWOT Analysis
- 12.1.7 Fluidigm
- 12.1.7.1. Company Overview
- 12.1.7.2. Products
- 12.1.7.3. Company Financials
- 12.1.7.4. SWOT Analysis
- 12.1.8 S2 Genomics Inc
- 12.1.8.1. Company Overview
- 12.1.8.2. Products
- 12.1.8.3. Company Financials
- 12.1.8.4. SWOT Analysis
- 12.1.9 Seven Bridges Genomics*List Not Exhaustive
- 12.1.9.1. Company Overview
- 12.1.9.2. Products
- 12.1.9.3. Company Financials
- 12.1.9.4. SWOT Analysis
- 12.1.10 Dovetail Genomics
- 12.1.10.1. Company Overview
- 12.1.10.2. Products
- 12.1.10.3. Company Financials
- 12.1.10.4. SWOT Analysis
- 12.1.11 NanoString Technologies Inc
- 12.1.11.1. Company Overview
- 12.1.11.2. Products
- 12.1.11.3. Company Financials
- 12.1.11.4. SWOT Analysis
- 12.1.12 Horizon Discovery Group plc
- 12.1.12.1. Company Overview
- 12.1.12.2. Products
- 12.1.12.3. Company Financials
- 12.1.12.4. SWOT Analysis
- 12.1.1 Akoya Biosciences Inc
- 12.2. Market Entropy
- 12.2.1 Company's Key Areas Served
- 12.2.2 Recent Developments
- 12.3. Company Market Share Analysis 2025
- 12.3.1 Top 5 Companies Market Share Analysis
- 12.3.2 Top 3 Companies Market Share Analysis
- 12.4. List of Potential Customers
- 13. Research Methodology
List of Figures
- Figure 1: Global Spatial Genomics and Transcriptomics Market Revenue Breakdown (billion, %) by Region 2025 & 2033
- Figure 2: North America Spatial Genomics and Transcriptomics Market Revenue (billion), by Technology 2025 & 2033
- Figure 3: North America Spatial Genomics and Transcriptomics Market Revenue Share (%), by Technology 2025 & 2033
- Figure 4: North America Spatial Genomics and Transcriptomics Market Revenue (billion), by Product 2025 & 2033
- Figure 5: North America Spatial Genomics and Transcriptomics Market Revenue Share (%), by Product 2025 & 2033
- Figure 6: North America Spatial Genomics and Transcriptomics Market Revenue (billion), by End-User 2025 & 2033
- Figure 7: North America Spatial Genomics and Transcriptomics Market Revenue Share (%), by End-User 2025 & 2033
- Figure 8: North America Spatial Genomics and Transcriptomics Market Revenue (billion), by Country 2025 & 2033
- Figure 9: North America Spatial Genomics and Transcriptomics Market Revenue Share (%), by Country 2025 & 2033
- Figure 10: Europe Spatial Genomics and Transcriptomics Market Revenue (billion), by Technology 2025 & 2033
- Figure 11: Europe Spatial Genomics and Transcriptomics Market Revenue Share (%), by Technology 2025 & 2033
- Figure 12: Europe Spatial Genomics and Transcriptomics Market Revenue (billion), by Product 2025 & 2033
- Figure 13: Europe Spatial Genomics and Transcriptomics Market Revenue Share (%), by Product 2025 & 2033
- Figure 14: Europe Spatial Genomics and Transcriptomics Market Revenue (billion), by End-User 2025 & 2033
- Figure 15: Europe Spatial Genomics and Transcriptomics Market Revenue Share (%), by End-User 2025 & 2033
- Figure 16: Europe Spatial Genomics and Transcriptomics Market Revenue (billion), by Country 2025 & 2033
- Figure 17: Europe Spatial Genomics and Transcriptomics Market Revenue Share (%), by Country 2025 & 2033
- Figure 18: Asia Pacific Spatial Genomics and Transcriptomics Market Revenue (billion), by Technology 2025 & 2033
- Figure 19: Asia Pacific Spatial Genomics and Transcriptomics Market Revenue Share (%), by Technology 2025 & 2033
- Figure 20: Asia Pacific Spatial Genomics and Transcriptomics Market Revenue (billion), by Product 2025 & 2033
- Figure 21: Asia Pacific Spatial Genomics and Transcriptomics Market Revenue Share (%), by Product 2025 & 2033
- Figure 22: Asia Pacific Spatial Genomics and Transcriptomics Market Revenue (billion), by End-User 2025 & 2033
- Figure 23: Asia Pacific Spatial Genomics and Transcriptomics Market Revenue Share (%), by End-User 2025 & 2033
- Figure 24: Asia Pacific Spatial Genomics and Transcriptomics Market Revenue (billion), by Country 2025 & 2033
- Figure 25: Asia Pacific Spatial Genomics and Transcriptomics Market Revenue Share (%), by Country 2025 & 2033
- Figure 26: Middle East and Africa Spatial Genomics and Transcriptomics Market Revenue (billion), by Technology 2025 & 2033
- Figure 27: Middle East and Africa Spatial Genomics and Transcriptomics Market Revenue Share (%), by Technology 2025 & 2033
- Figure 28: Middle East and Africa Spatial Genomics and Transcriptomics Market Revenue (billion), by Product 2025 & 2033
- Figure 29: Middle East and Africa Spatial Genomics and Transcriptomics Market Revenue Share (%), by Product 2025 & 2033
- Figure 30: Middle East and Africa Spatial Genomics and Transcriptomics Market Revenue (billion), by End-User 2025 & 2033
- Figure 31: Middle East and Africa Spatial Genomics and Transcriptomics Market Revenue Share (%), by End-User 2025 & 2033
- Figure 32: Middle East and Africa Spatial Genomics and Transcriptomics Market Revenue (billion), by Country 2025 & 2033
- Figure 33: Middle East and Africa Spatial Genomics and Transcriptomics Market Revenue Share (%), by Country 2025 & 2033
- Figure 34: South America Spatial Genomics and Transcriptomics Market Revenue (billion), by Technology 2025 & 2033
- Figure 35: South America Spatial Genomics and Transcriptomics Market Revenue Share (%), by Technology 2025 & 2033
- Figure 36: South America Spatial Genomics and Transcriptomics Market Revenue (billion), by Product 2025 & 2033
- Figure 37: South America Spatial Genomics and Transcriptomics Market Revenue Share (%), by Product 2025 & 2033
- Figure 38: South America Spatial Genomics and Transcriptomics Market Revenue (billion), by End-User 2025 & 2033
- Figure 39: South America Spatial Genomics and Transcriptomics Market Revenue Share (%), by End-User 2025 & 2033
- Figure 40: South America Spatial Genomics and Transcriptomics Market Revenue (billion), by Country 2025 & 2033
- Figure 41: South America Spatial Genomics and Transcriptomics Market Revenue Share (%), by Country 2025 & 2033
List of Tables
- Table 1: Global Spatial Genomics and Transcriptomics Market Revenue billion Forecast, by Technology 2020 & 2033
- Table 2: Global Spatial Genomics and Transcriptomics Market Revenue billion Forecast, by Product 2020 & 2033
- Table 3: Global Spatial Genomics and Transcriptomics Market Revenue billion Forecast, by End-User 2020 & 2033
- Table 4: Global Spatial Genomics and Transcriptomics Market Revenue billion Forecast, by Region 2020 & 2033
- Table 5: Global Spatial Genomics and Transcriptomics Market Revenue billion Forecast, by Technology 2020 & 2033
- Table 6: Global Spatial Genomics and Transcriptomics Market Revenue billion Forecast, by Product 2020 & 2033
- Table 7: Global Spatial Genomics and Transcriptomics Market Revenue billion Forecast, by End-User 2020 & 2033
- Table 8: Global Spatial Genomics and Transcriptomics Market Revenue billion Forecast, by Country 2020 & 2033
- Table 9: United States Spatial Genomics and Transcriptomics Market Revenue (billion) Forecast, by Application 2020 & 2033
- Table 10: Canada Spatial Genomics and Transcriptomics Market Revenue (billion) Forecast, by Application 2020 & 2033
- Table 11: Mexico Spatial Genomics and Transcriptomics Market Revenue (billion) Forecast, by Application 2020 & 2033
- Table 12: Global Spatial Genomics and Transcriptomics Market Revenue billion Forecast, by Technology 2020 & 2033
- Table 13: Global Spatial Genomics and Transcriptomics Market Revenue billion Forecast, by Product 2020 & 2033
- Table 14: Global Spatial Genomics and Transcriptomics Market Revenue billion Forecast, by End-User 2020 & 2033
- Table 15: Global Spatial Genomics and Transcriptomics Market Revenue billion Forecast, by Country 2020 & 2033
- Table 16: Germany Spatial Genomics and Transcriptomics Market Revenue (billion) Forecast, by Application 2020 & 2033
- Table 17: United Kingdom Spatial Genomics and Transcriptomics Market Revenue (billion) Forecast, by Application 2020 & 2033
- Table 18: France Spatial Genomics and Transcriptomics Market Revenue (billion) Forecast, by Application 2020 & 2033
- Table 19: Italy Spatial Genomics and Transcriptomics Market Revenue (billion) Forecast, by Application 2020 & 2033
- Table 20: Spain Spatial Genomics and Transcriptomics Market Revenue (billion) Forecast, by Application 2020 & 2033
- Table 21: Rest of Europe Spatial Genomics and Transcriptomics Market Revenue (billion) Forecast, by Application 2020 & 2033
- Table 22: Global Spatial Genomics and Transcriptomics Market Revenue billion Forecast, by Technology 2020 & 2033
- Table 23: Global Spatial Genomics and Transcriptomics Market Revenue billion Forecast, by Product 2020 & 2033
- Table 24: Global Spatial Genomics and Transcriptomics Market Revenue billion Forecast, by End-User 2020 & 2033
- Table 25: Global Spatial Genomics and Transcriptomics Market Revenue billion Forecast, by Country 2020 & 2033
- Table 26: China Spatial Genomics and Transcriptomics Market Revenue (billion) Forecast, by Application 2020 & 2033
- Table 27: Japan Spatial Genomics and Transcriptomics Market Revenue (billion) Forecast, by Application 2020 & 2033
- Table 28: India Spatial Genomics and Transcriptomics Market Revenue (billion) Forecast, by Application 2020 & 2033
- Table 29: Australia Spatial Genomics and Transcriptomics Market Revenue (billion) Forecast, by Application 2020 & 2033
- Table 30: South Korea Spatial Genomics and Transcriptomics Market Revenue (billion) Forecast, by Application 2020 & 2033
- Table 31: Rest of Asia Pacific Spatial Genomics and Transcriptomics Market Revenue (billion) Forecast, by Application 2020 & 2033
- Table 32: Global Spatial Genomics and Transcriptomics Market Revenue billion Forecast, by Technology 2020 & 2033
- Table 33: Global Spatial Genomics and Transcriptomics Market Revenue billion Forecast, by Product 2020 & 2033
- Table 34: Global Spatial Genomics and Transcriptomics Market Revenue billion Forecast, by End-User 2020 & 2033
- Table 35: Global Spatial Genomics and Transcriptomics Market Revenue billion Forecast, by Country 2020 & 2033
- Table 36: GCC Spatial Genomics and Transcriptomics Market Revenue (billion) Forecast, by Application 2020 & 2033
- Table 37: South Africa Spatial Genomics and Transcriptomics Market Revenue (billion) Forecast, by Application 2020 & 2033
- Table 38: Rest of Middle East and Africa Spatial Genomics and Transcriptomics Market Revenue (billion) Forecast, by Application 2020 & 2033
- Table 39: Global Spatial Genomics and Transcriptomics Market Revenue billion Forecast, by Technology 2020 & 2033
- Table 40: Global Spatial Genomics and Transcriptomics Market Revenue billion Forecast, by Product 2020 & 2033
- Table 41: Global Spatial Genomics and Transcriptomics Market Revenue billion Forecast, by End-User 2020 & 2033
- Table 42: Global Spatial Genomics and Transcriptomics Market Revenue billion Forecast, by Country 2020 & 2033
- Table 43: Brazil Spatial Genomics and Transcriptomics Market Revenue (billion) Forecast, by Application 2020 & 2033
- Table 44: Argentina Spatial Genomics and Transcriptomics Market Revenue (billion) Forecast, by Application 2020 & 2033
- Table 45: Rest of South America Spatial Genomics and Transcriptomics Market Revenue (billion) Forecast, by Application 2020 & 2033
Frequently Asked Questions
1. What is the projected Compound Annual Growth Rate (CAGR) of the Spatial Genomics and Transcriptomics Market?
The projected CAGR is approximately 12.62%.
2. Which companies are prominent players in the Spatial Genomics and Transcriptomics Market?
Key companies in the market include Akoya Biosciences Inc, 10x Genomics, Advanced Cell Diagnostics Inc (ACD), Naterac Inc, Bio-Techne, Illumina Inc, Fluidigm, S2 Genomics Inc, Seven Bridges Genomics*List Not Exhaustive, Dovetail Genomics, NanoString Technologies Inc, Horizon Discovery Group plc.
3. What are the main segments of the Spatial Genomics and Transcriptomics Market?
The market segments include Technology, Product, End-User.
4. Can you provide details about the market size?
The market size is estimated to be USD 0.64 billion as of 2022.
5. What are some drivers contributing to market growth?
Emerging Potential of Spatial Genomic Analysis as Cancer Diagnostic Tool; Increasing Advanced Technologies of Spatial Genomics and Transcriptomics; Advent of Fourth Generation of Sequencing.
6. What are the notable trends driving market growth?
Consumables Segment is Expected to Witness Healthy Growth During the Forecast Period.
7. Are there any restraints impacting market growth?
Slow Implementation of Technology; Well-Established Workflows for Conventional Genomics and Transcriptomics Analysis.
8. Can you provide examples of recent developments in the market?
May 2022: NanoString announced a seamless, cloud-based workflow that improves the spatial data analysis experience of customers using Illumina NextSeq 1000 and NextSeq 2000 sequencing systems and the GeoMx Digital Spatial Profiler to facilitate spatial biology research using next-generation sequencing.
9. What pricing options are available for accessing the report?
Pricing options include single-user, multi-user, and enterprise licenses priced at USD 4750, USD 5250, and USD 8750 respectively.
10. Is the market size provided in terms of value or volume?
The market size is provided in terms of value, measured in billion.
11. Are there any specific market keywords associated with the report?
Yes, the market keyword associated with the report is "Spatial Genomics and Transcriptomics Market," which aids in identifying and referencing the specific market segment covered.
12. How do I determine which pricing option suits my needs best?
The pricing options vary based on user requirements and access needs. Individual users may opt for single-user licenses, while businesses requiring broader access may choose multi-user or enterprise licenses for cost-effective access to the report.
13. Are there any additional resources or data provided in the Spatial Genomics and Transcriptomics Market report?
While the report offers comprehensive insights, it's advisable to review the specific contents or supplementary materials provided to ascertain if additional resources or data are available.
14. How can I stay updated on further developments or reports in the Spatial Genomics and Transcriptomics Market?
To stay informed about further developments, trends, and reports in the Spatial Genomics and Transcriptomics Market, consider subscribing to industry newsletters, following relevant companies and organizations, or regularly checking reputable industry news sources and publications.
Methodology
Step 1 - Identification of Relevant Samples Size from Population Database


Step 2 - Approaches for Defining Global Market Size (Value, Volume* & Price*)

Note*: In applicable scenarios
Step 3 - Data Sources
Primary Research
- Web Analytics
- Survey Reports
- Research Institute
- Latest Research Reports
- Opinion Leaders
Secondary Research
- Annual Reports
- White Paper
- Latest Press Release
- Industry Association
- Paid Database
- Investor Presentations

Step 4 - Data Triangulation
Involves using different sources of information in order to increase the validity of a study
These sources are likely to be stakeholders in a program - participants, other researchers, program staff, other community members, and so on.
Then we put all data in single framework & apply various statistical tools to find out the dynamic on the market.
During the analysis stage, feedback from the stakeholder groups would be compared to determine areas of agreement as well as areas of divergence