

Key Insights
The global soy protein market, valued at $3.29 billion in 2025, is projected for robust expansion at a 2.9% CAGR from 2025 to 2033. Key growth drivers include escalating demand for plant-based proteins driven by health consciousness and increasing adoption of vegetarian and vegan diets. The expanding animal feed sector, leveraging soy protein as a cost-effective nutritional ingredient, further bolsters market volume. Technological advancements in soy protein processing, enhancing functionality and product diversity (isolates, concentrates, textured/hydrolyzed), are facilitating broader market penetration across food & beverages and sports nutrition. Potential restraints include soybean price volatility and competition from alternative plant proteins like pea and rice. North America and Europe currently lead market share, with significant growth opportunities emerging in Asian markets.
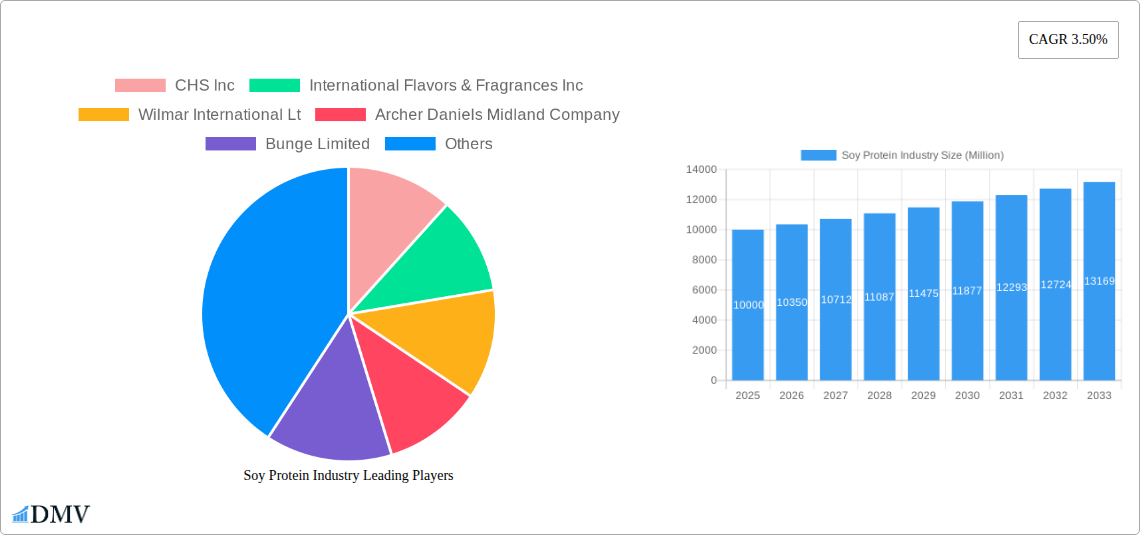
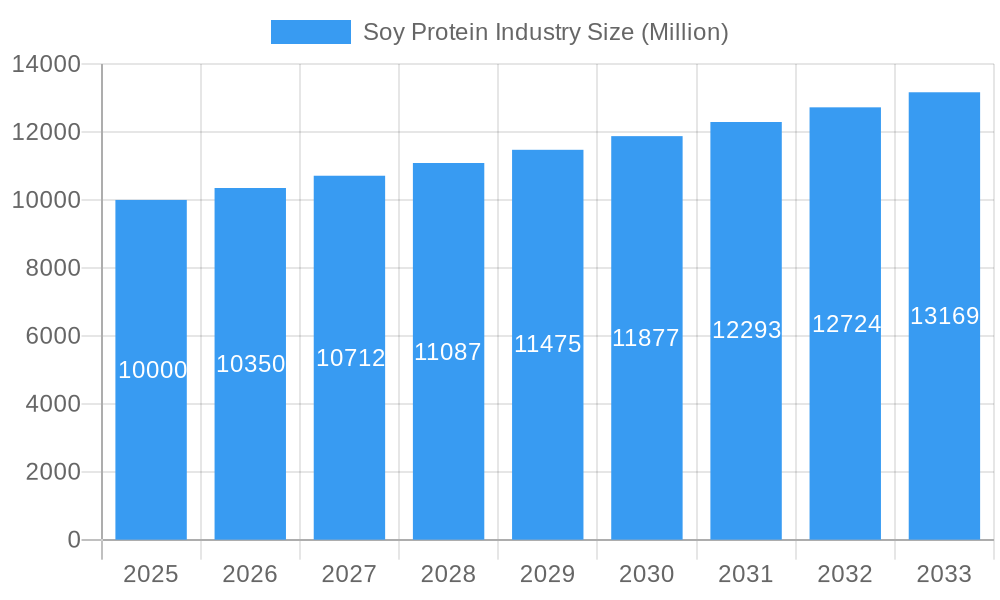
Soy Protein Industry Market Size (In Billion)
Market segmentation reveals diverse applications. Soy protein concentrates are the leading form, followed by isolates, catering to specific functional requirements. Textured and hydrolyzed variants address niche demands for texture and digestibility. The animal feed industry dominates end-use due to its critical role in animal nutrition. However, the food & beverage and sports nutrition sectors exhibit rapid growth, fueled by consumer preference for healthy, functional foods. Leading players including CHS Inc., International Flavors & Fragrances Inc., Wilmar International Ltd., Archer Daniels Midland Company, Bunge Limited, Fuji Oil Group, Kerry Group PLC, and A Costantino & C SpA are actively influencing market dynamics through innovation and strategic alliances. The 2025-2033 forecast anticipates sustained growth, alongside a growing emphasis on sustainable sourcing and processing practices to address environmental and economic considerations.
Soy Protein Industry Company Market Share
Global Soy Protein Market Analysis: Trends, Size, and Forecast (2025-2033)
This comprehensive report offers an in-depth analysis of the soy protein industry, detailing market size, prevailing trends, key industry participants, and future growth projections. The analysis covers the period from 2025 to 2033, with 2025 serving as the base year. The global soy protein market is estimated at $3.29 billion in 2025 and is projected to expand significantly by 2033.
Soy Protein Industry Market Composition & Trends
This section evaluates the competitive landscape of the soy protein market, analyzing market concentration, innovation, regulatory factors, substitute products, end-user profiles, and merger and acquisition (M&A) activities. We delve into the market share distribution among key players like Archer Daniels Midland Company, Bunge Limited, and CHS Inc., examining their strategic moves and market dominance. The report quantifies M&A activity with detailed deal values, providing insights into industry consolidation and strategic partnerships. Furthermore, the analysis will explore the impact of regulatory changes on market growth, the emergence of substitute proteins, and evolving consumer preferences.
- Market Concentration: Analysis of market share held by top 5 players (estimated at XX%).
- Innovation Catalysts: Discussion of technological advancements driving market growth (e.g., improved extraction methods, new applications).
- Regulatory Landscape: Assessment of impact of food safety regulations and labeling requirements on soy protein producers.
- Substitute Products: Examination of the competitive threat posed by alternative protein sources (e.g., pea protein, whey protein).
- End-User Profiles: Detailed analysis of market segments by end-user (Animal Feed, Food and Beverages, Sport/Performance Nutrition), including consumption patterns and growth potential.
- M&A Activity: Review of significant M&A transactions, including deal values and strategic implications (e.g., Bunge's USD 12 Million acquisition of Imcopa's soy processing plants).
Soy Protein Industry Industry Evolution
This section examines the evolution of the soy protein industry, detailing market growth trajectories, technological advancements, and shifting consumer demands. We analyze historical data (2019-2024) and project future trends (2025-2033), providing concrete data points such as compound annual growth rates (CAGR) for different segments. The analysis also explores the influence of factors like rising health consciousness, increased demand for plant-based products, and technological breakthroughs in soy protein processing. The report examines how these trends are shaping the industry's competitive landscape and driving innovation.
Leading Regions, Countries, or Segments in Soy Protein Industry
This section identifies the dominant regions, countries, and segments within the soy protein market. We analyze factors contributing to the leadership of specific regions and segments, including: Form (Concentrates, Isolates, Textured/Hydrolyzed), and End-User (Animal Feed, Food and Beverages, Sport/Performance Nutrition).
- Key Drivers (by segment):
- Concentrates: High volume production and cost-effectiveness.
- Isolates: Growing demand for high-protein, clean-label products in the food and beverage sector.
- Textured/Hydrolyzed: Applications in meat alternatives and other food products.
- Animal Feed: Large-scale consumption driven by cost-efficiency and nutritional value.
- Food and Beverages: Increasing demand for plant-based ingredients.
- Sport/Performance Nutrition: Focus on high protein content and functional benefits.
- Dominant Regions/Countries: Analysis of factors such as production capacity, consumption patterns, and regulatory environment. (Specific regions and countries will be detailed in the full report).
Soy Protein Industry Product Innovations
This section details recent product innovations in the soy protein market, focusing on unique selling propositions (USPs) and technological advancements driving new applications. We examine advancements in soy protein extraction and processing technologies that enhance product quality and expand application possibilities. Examples include advancements in texture modification and the development of soy protein ingredients with improved functionality.
Propelling Factors for Soy Protein Industry Growth
The soy protein industry is experiencing significant growth driven by several key factors. Increased consumer demand for plant-based protein sources, driven by health and sustainability concerns, is a major catalyst. Technological innovations in soy protein processing are also contributing to improved product quality and expanded applications. Furthermore, supportive government policies and regulations promoting sustainable food systems are fostering market expansion.
Obstacles in the Soy Protein Industry Market
Despite the growth potential, the soy protein industry faces several challenges. Fluctuations in raw material prices, supply chain disruptions, and intense competition from other protein sources pose significant risks. Stringent regulatory requirements and concerns about sustainability in soy production also present obstacles. These factors can impact production costs and market competitiveness.
Future Opportunities in Soy Protein Industry
The future of the soy protein industry looks bright, with numerous emerging opportunities. Expanding into new markets, particularly in developing economies with growing populations and rising demand for affordable protein sources, holds significant potential. Advancements in technology leading to innovative soy-based products will further fuel growth. The rising interest in plant-based diets and the increasing awareness of sustainability issues will contribute to the industry's continued expansion.
Major Players in the Soy Protein Industry Ecosystem
Key Developments in Soy Protein Industry Industry
- February 2021: Bunge expands soy protein manufacturing capacity through acquisition, strengthening its market position.
- March 2021: Fuji Oil Group appoints a new CEO focused on expanding plant-based food solutions, highlighting the growing importance of soy protein.
- April 2021: Fuji Oil's subsidiary invests in food technology, emphasizing its commitment to sustainable soy protein production.
Strategic Soy Protein Industry Market Forecast
The soy protein market is poised for substantial growth, driven by increasing consumer demand for plant-based proteins and continuous innovation in soy protein processing and application. The market's future is promising, with opportunities for expansion in various sectors and geographical regions. The report projects robust growth driven by these factors and others examined in detail in the complete document.
Soy Protein Industry Segmentation
-
1. Form
- 1.1. Concentrates
- 1.2. Isolates
- 1.3. Textured/Hydrolyzed
-
2. End User
- 2.1. Animal Feed
-
2.2. Food and Beverages
-
2.2.1. By Sub End User
- 2.2.1.1. Bakery
- 2.2.1.2. Breakfast Cereals
- 2.2.1.3. Condiments/Sauces
- 2.2.1.4. Dairy and Dairy Alternative Products
- 2.2.1.5. Meat/Poultry/Seafood and Meat Alternative Products
- 2.2.1.6. RTE/RTC Food Products
- 2.2.1.7. Snacks
-
2.2.1. By Sub End User
-
2.3. Supplements
- 2.3.1. Baby Food and Infant Formula
- 2.3.2. Elderly Nutrition and Medical Nutrition
- 2.3.3. Sport/Performance Nutrition
Soy Protein Industry Segmentation By Geography
-
1. North America
- 1.1. United States
- 1.2. Canada
- 1.3. Mexico
-
2. South America
- 2.1. Brazil
- 2.2. Argentina
- 2.3. Rest of South America
-
3. Europe
- 3.1. United Kingdom
- 3.2. Germany
- 3.3. France
- 3.4. Italy
- 3.5. Spain
- 3.6. Russia
- 3.7. Benelux
- 3.8. Nordics
- 3.9. Rest of Europe
-
4. Middle East & Africa
- 4.1. Turkey
- 4.2. Israel
- 4.3. GCC
- 4.4. North Africa
- 4.5. South Africa
- 4.6. Rest of Middle East & Africa
-
5. Asia Pacific
- 5.1. China
- 5.2. India
- 5.3. Japan
- 5.4. South Korea
- 5.5. ASEAN
- 5.6. Oceania
- 5.7. Rest of Asia Pacific
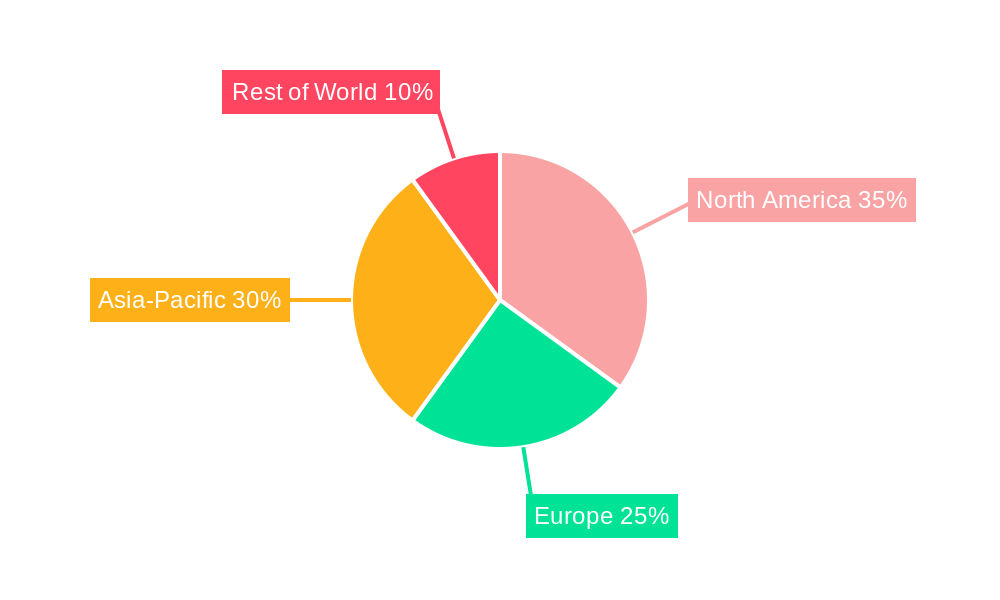
Soy Protein Industry Regional Market Share
Geographic Coverage of Soy Protein Industry
Soy Protein Industry REPORT HIGHLIGHTS
| Aspects | Details |
|---|---|
| Study Period | 2020-2034 |
| Base Year | 2025 |
| Estimated Year | 2026 |
| Forecast Period | 2026-2034 |
| Historical Period | 2020-2025 |
| Growth Rate | CAGR of 2.9% from 2020-2034 |
| Segmentation |
|
Table of Contents
- 1. Introduction
- 1.1. Research Scope
- 1.2. Market Segmentation
- 1.3. Research Methodology
- 1.4. Definitions and Assumptions
- 2. Executive Summary
- 2.1. Introduction
- 3. Market Dynamics
- 3.1. Introduction
- 3.2. Market Drivers
- 3.2.1. Increasing Consumer Demand for Products with Low Environmental Impacts; Dedicated Policies and Government Efforts to Promote the use of Biotechnology
- 3.3. Market Restrains
- 3.3.1. Deteriorating Fertility of Agricultural Lands
- 3.4. Market Trends
- 3.4.1. OTHER KEY INDUSTRY TRENDS COVERED IN THE REPORT
- 4. Market Factor Analysis
- 4.1. Porters Five Forces
- 4.2. Supply/Value Chain
- 4.3. PESTEL analysis
- 4.4. Market Entropy
- 4.5. Patent/Trademark Analysis
- 5. Global Soy Protein Industry Analysis, Insights and Forecast, 2020-2032
- 5.1. Market Analysis, Insights and Forecast - by Form
- 5.1.1. Concentrates
- 5.1.2. Isolates
- 5.1.3. Textured/Hydrolyzed
- 5.2. Market Analysis, Insights and Forecast - by End User
- 5.2.1. Animal Feed
- 5.2.2. Food and Beverages
- 5.2.2.1. By Sub End User
- 5.2.2.1.1. Bakery
- 5.2.2.1.2. Breakfast Cereals
- 5.2.2.1.3. Condiments/Sauces
- 5.2.2.1.4. Dairy and Dairy Alternative Products
- 5.2.2.1.5. Meat/Poultry/Seafood and Meat Alternative Products
- 5.2.2.1.6. RTE/RTC Food Products
- 5.2.2.1.7. Snacks
- 5.2.2.1. By Sub End User
- 5.2.3. Supplements
- 5.2.3.1. Baby Food and Infant Formula
- 5.2.3.2. Elderly Nutrition and Medical Nutrition
- 5.2.3.3. Sport/Performance Nutrition
- 5.3. Market Analysis, Insights and Forecast - by Region
- 5.3.1. North America
- 5.3.2. South America
- 5.3.3. Europe
- 5.3.4. Middle East & Africa
- 5.3.5. Asia Pacific
- 5.1. Market Analysis, Insights and Forecast - by Form
- 6. North America Soy Protein Industry Analysis, Insights and Forecast, 2020-2032
- 6.1. Market Analysis, Insights and Forecast - by Form
- 6.1.1. Concentrates
- 6.1.2. Isolates
- 6.1.3. Textured/Hydrolyzed
- 6.2. Market Analysis, Insights and Forecast - by End User
- 6.2.1. Animal Feed
- 6.2.2. Food and Beverages
- 6.2.2.1. By Sub End User
- 6.2.2.1.1. Bakery
- 6.2.2.1.2. Breakfast Cereals
- 6.2.2.1.3. Condiments/Sauces
- 6.2.2.1.4. Dairy and Dairy Alternative Products
- 6.2.2.1.5. Meat/Poultry/Seafood and Meat Alternative Products
- 6.2.2.1.6. RTE/RTC Food Products
- 6.2.2.1.7. Snacks
- 6.2.2.1. By Sub End User
- 6.2.3. Supplements
- 6.2.3.1. Baby Food and Infant Formula
- 6.2.3.2. Elderly Nutrition and Medical Nutrition
- 6.2.3.3. Sport/Performance Nutrition
- 6.1. Market Analysis, Insights and Forecast - by Form
- 7. South America Soy Protein Industry Analysis, Insights and Forecast, 2020-2032
- 7.1. Market Analysis, Insights and Forecast - by Form
- 7.1.1. Concentrates
- 7.1.2. Isolates
- 7.1.3. Textured/Hydrolyzed
- 7.2. Market Analysis, Insights and Forecast - by End User
- 7.2.1. Animal Feed
- 7.2.2. Food and Beverages
- 7.2.2.1. By Sub End User
- 7.2.2.1.1. Bakery
- 7.2.2.1.2. Breakfast Cereals
- 7.2.2.1.3. Condiments/Sauces
- 7.2.2.1.4. Dairy and Dairy Alternative Products
- 7.2.2.1.5. Meat/Poultry/Seafood and Meat Alternative Products
- 7.2.2.1.6. RTE/RTC Food Products
- 7.2.2.1.7. Snacks
- 7.2.2.1. By Sub End User
- 7.2.3. Supplements
- 7.2.3.1. Baby Food and Infant Formula
- 7.2.3.2. Elderly Nutrition and Medical Nutrition
- 7.2.3.3. Sport/Performance Nutrition
- 7.1. Market Analysis, Insights and Forecast - by Form
- 8. Europe Soy Protein Industry Analysis, Insights and Forecast, 2020-2032
- 8.1. Market Analysis, Insights and Forecast - by Form
- 8.1.1. Concentrates
- 8.1.2. Isolates
- 8.1.3. Textured/Hydrolyzed
- 8.2. Market Analysis, Insights and Forecast - by End User
- 8.2.1. Animal Feed
- 8.2.2. Food and Beverages
- 8.2.2.1. By Sub End User
- 8.2.2.1.1. Bakery
- 8.2.2.1.2. Breakfast Cereals
- 8.2.2.1.3. Condiments/Sauces
- 8.2.2.1.4. Dairy and Dairy Alternative Products
- 8.2.2.1.5. Meat/Poultry/Seafood and Meat Alternative Products
- 8.2.2.1.6. RTE/RTC Food Products
- 8.2.2.1.7. Snacks
- 8.2.2.1. By Sub End User
- 8.2.3. Supplements
- 8.2.3.1. Baby Food and Infant Formula
- 8.2.3.2. Elderly Nutrition and Medical Nutrition
- 8.2.3.3. Sport/Performance Nutrition
- 8.1. Market Analysis, Insights and Forecast - by Form
- 9. Middle East & Africa Soy Protein Industry Analysis, Insights and Forecast, 2020-2032
- 9.1. Market Analysis, Insights and Forecast - by Form
- 9.1.1. Concentrates
- 9.1.2. Isolates
- 9.1.3. Textured/Hydrolyzed
- 9.2. Market Analysis, Insights and Forecast - by End User
- 9.2.1. Animal Feed
- 9.2.2. Food and Beverages
- 9.2.2.1. By Sub End User
- 9.2.2.1.1. Bakery
- 9.2.2.1.2. Breakfast Cereals
- 9.2.2.1.3. Condiments/Sauces
- 9.2.2.1.4. Dairy and Dairy Alternative Products
- 9.2.2.1.5. Meat/Poultry/Seafood and Meat Alternative Products
- 9.2.2.1.6. RTE/RTC Food Products
- 9.2.2.1.7. Snacks
- 9.2.2.1. By Sub End User
- 9.2.3. Supplements
- 9.2.3.1. Baby Food and Infant Formula
- 9.2.3.2. Elderly Nutrition and Medical Nutrition
- 9.2.3.3. Sport/Performance Nutrition
- 9.1. Market Analysis, Insights and Forecast - by Form
- 10. Asia Pacific Soy Protein Industry Analysis, Insights and Forecast, 2020-2032
- 10.1. Market Analysis, Insights and Forecast - by Form
- 10.1.1. Concentrates
- 10.1.2. Isolates
- 10.1.3. Textured/Hydrolyzed
- 10.2. Market Analysis, Insights and Forecast - by End User
- 10.2.1. Animal Feed
- 10.2.2. Food and Beverages
- 10.2.2.1. By Sub End User
- 10.2.2.1.1. Bakery
- 10.2.2.1.2. Breakfast Cereals
- 10.2.2.1.3. Condiments/Sauces
- 10.2.2.1.4. Dairy and Dairy Alternative Products
- 10.2.2.1.5. Meat/Poultry/Seafood and Meat Alternative Products
- 10.2.2.1.6. RTE/RTC Food Products
- 10.2.2.1.7. Snacks
- 10.2.2.1. By Sub End User
- 10.2.3. Supplements
- 10.2.3.1. Baby Food and Infant Formula
- 10.2.3.2. Elderly Nutrition and Medical Nutrition
- 10.2.3.3. Sport/Performance Nutrition
- 10.1. Market Analysis, Insights and Forecast - by Form
- 11. Competitive Analysis
- 11.1. Global Market Share Analysis 2025
- 11.2. Company Profiles
- 11.2.1 CHS Inc
- 11.2.1.1. Overview
- 11.2.1.2. Products
- 11.2.1.3. SWOT Analysis
- 11.2.1.4. Recent Developments
- 11.2.1.5. Financials (Based on Availability)
- 11.2.2 International Flavors & Fragrances Inc
- 11.2.2.1. Overview
- 11.2.2.2. Products
- 11.2.2.3. SWOT Analysis
- 11.2.2.4. Recent Developments
- 11.2.2.5. Financials (Based on Availability)
- 11.2.3 Wilmar International Lt
- 11.2.3.1. Overview
- 11.2.3.2. Products
- 11.2.3.3. SWOT Analysis
- 11.2.3.4. Recent Developments
- 11.2.3.5. Financials (Based on Availability)
- 11.2.4 Archer Daniels Midland Company
- 11.2.4.1. Overview
- 11.2.4.2. Products
- 11.2.4.3. SWOT Analysis
- 11.2.4.4. Recent Developments
- 11.2.4.5. Financials (Based on Availability)
- 11.2.5 Bunge Limited
- 11.2.5.1. Overview
- 11.2.5.2. Products
- 11.2.5.3. SWOT Analysis
- 11.2.5.4. Recent Developments
- 11.2.5.5. Financials (Based on Availability)
- 11.2.6 Fuji Oil Group
- 11.2.6.1. Overview
- 11.2.6.2. Products
- 11.2.6.3. SWOT Analysis
- 11.2.6.4. Recent Developments
- 11.2.6.5. Financials (Based on Availability)
- 11.2.7 Kerry Group PLC
- 11.2.7.1. Overview
- 11.2.7.2. Products
- 11.2.7.3. SWOT Analysis
- 11.2.7.4. Recent Developments
- 11.2.7.5. Financials (Based on Availability)
- 11.2.8 A Costantino & C SpA
- 11.2.8.1. Overview
- 11.2.8.2. Products
- 11.2.8.3. SWOT Analysis
- 11.2.8.4. Recent Developments
- 11.2.8.5. Financials (Based on Availability)
- 11.2.1 CHS Inc
List of Figures
- Figure 1: Global Soy Protein Industry Revenue Breakdown (billion, %) by Region 2025 & 2033
- Figure 2: North America Soy Protein Industry Revenue (billion), by Form 2025 & 2033
- Figure 3: North America Soy Protein Industry Revenue Share (%), by Form 2025 & 2033
- Figure 4: North America Soy Protein Industry Revenue (billion), by End User 2025 & 2033
- Figure 5: North America Soy Protein Industry Revenue Share (%), by End User 2025 & 2033
- Figure 6: North America Soy Protein Industry Revenue (billion), by Country 2025 & 2033
- Figure 7: North America Soy Protein Industry Revenue Share (%), by Country 2025 & 2033
- Figure 8: South America Soy Protein Industry Revenue (billion), by Form 2025 & 2033
- Figure 9: South America Soy Protein Industry Revenue Share (%), by Form 2025 & 2033
- Figure 10: South America Soy Protein Industry Revenue (billion), by End User 2025 & 2033
- Figure 11: South America Soy Protein Industry Revenue Share (%), by End User 2025 & 2033
- Figure 12: South America Soy Protein Industry Revenue (billion), by Country 2025 & 2033
- Figure 13: South America Soy Protein Industry Revenue Share (%), by Country 2025 & 2033
- Figure 14: Europe Soy Protein Industry Revenue (billion), by Form 2025 & 2033
- Figure 15: Europe Soy Protein Industry Revenue Share (%), by Form 2025 & 2033
- Figure 16: Europe Soy Protein Industry Revenue (billion), by End User 2025 & 2033
- Figure 17: Europe Soy Protein Industry Revenue Share (%), by End User 2025 & 2033
- Figure 18: Europe Soy Protein Industry Revenue (billion), by Country 2025 & 2033
- Figure 19: Europe Soy Protein Industry Revenue Share (%), by Country 2025 & 2033
- Figure 20: Middle East & Africa Soy Protein Industry Revenue (billion), by Form 2025 & 2033
- Figure 21: Middle East & Africa Soy Protein Industry Revenue Share (%), by Form 2025 & 2033
- Figure 22: Middle East & Africa Soy Protein Industry Revenue (billion), by End User 2025 & 2033
- Figure 23: Middle East & Africa Soy Protein Industry Revenue Share (%), by End User 2025 & 2033
- Figure 24: Middle East & Africa Soy Protein Industry Revenue (billion), by Country 2025 & 2033
- Figure 25: Middle East & Africa Soy Protein Industry Revenue Share (%), by Country 2025 & 2033
- Figure 26: Asia Pacific Soy Protein Industry Revenue (billion), by Form 2025 & 2033
- Figure 27: Asia Pacific Soy Protein Industry Revenue Share (%), by Form 2025 & 2033
- Figure 28: Asia Pacific Soy Protein Industry Revenue (billion), by End User 2025 & 2033
- Figure 29: Asia Pacific Soy Protein Industry Revenue Share (%), by End User 2025 & 2033
- Figure 30: Asia Pacific Soy Protein Industry Revenue (billion), by Country 2025 & 2033
- Figure 31: Asia Pacific Soy Protein Industry Revenue Share (%), by Country 2025 & 2033
List of Tables
- Table 1: Global Soy Protein Industry Revenue billion Forecast, by Form 2020 & 2033
- Table 2: Global Soy Protein Industry Revenue billion Forecast, by End User 2020 & 2033
- Table 3: Global Soy Protein Industry Revenue billion Forecast, by Region 2020 & 2033
- Table 4: Global Soy Protein Industry Revenue billion Forecast, by Form 2020 & 2033
- Table 5: Global Soy Protein Industry Revenue billion Forecast, by End User 2020 & 2033
- Table 6: Global Soy Protein Industry Revenue billion Forecast, by Country 2020 & 2033
- Table 7: United States Soy Protein Industry Revenue (billion) Forecast, by Application 2020 & 2033
- Table 8: Canada Soy Protein Industry Revenue (billion) Forecast, by Application 2020 & 2033
- Table 9: Mexico Soy Protein Industry Revenue (billion) Forecast, by Application 2020 & 2033
- Table 10: Global Soy Protein Industry Revenue billion Forecast, by Form 2020 & 2033
- Table 11: Global Soy Protein Industry Revenue billion Forecast, by End User 2020 & 2033
- Table 12: Global Soy Protein Industry Revenue billion Forecast, by Country 2020 & 2033
- Table 13: Brazil Soy Protein Industry Revenue (billion) Forecast, by Application 2020 & 2033
- Table 14: Argentina Soy Protein Industry Revenue (billion) Forecast, by Application 2020 & 2033
- Table 15: Rest of South America Soy Protein Industry Revenue (billion) Forecast, by Application 2020 & 2033
- Table 16: Global Soy Protein Industry Revenue billion Forecast, by Form 2020 & 2033
- Table 17: Global Soy Protein Industry Revenue billion Forecast, by End User 2020 & 2033
- Table 18: Global Soy Protein Industry Revenue billion Forecast, by Country 2020 & 2033
- Table 19: United Kingdom Soy Protein Industry Revenue (billion) Forecast, by Application 2020 & 2033
- Table 20: Germany Soy Protein Industry Revenue (billion) Forecast, by Application 2020 & 2033
- Table 21: France Soy Protein Industry Revenue (billion) Forecast, by Application 2020 & 2033
- Table 22: Italy Soy Protein Industry Revenue (billion) Forecast, by Application 2020 & 2033
- Table 23: Spain Soy Protein Industry Revenue (billion) Forecast, by Application 2020 & 2033
- Table 24: Russia Soy Protein Industry Revenue (billion) Forecast, by Application 2020 & 2033
- Table 25: Benelux Soy Protein Industry Revenue (billion) Forecast, by Application 2020 & 2033
- Table 26: Nordics Soy Protein Industry Revenue (billion) Forecast, by Application 2020 & 2033
- Table 27: Rest of Europe Soy Protein Industry Revenue (billion) Forecast, by Application 2020 & 2033
- Table 28: Global Soy Protein Industry Revenue billion Forecast, by Form 2020 & 2033
- Table 29: Global Soy Protein Industry Revenue billion Forecast, by End User 2020 & 2033
- Table 30: Global Soy Protein Industry Revenue billion Forecast, by Country 2020 & 2033
- Table 31: Turkey Soy Protein Industry Revenue (billion) Forecast, by Application 2020 & 2033
- Table 32: Israel Soy Protein Industry Revenue (billion) Forecast, by Application 2020 & 2033
- Table 33: GCC Soy Protein Industry Revenue (billion) Forecast, by Application 2020 & 2033
- Table 34: North Africa Soy Protein Industry Revenue (billion) Forecast, by Application 2020 & 2033
- Table 35: South Africa Soy Protein Industry Revenue (billion) Forecast, by Application 2020 & 2033
- Table 36: Rest of Middle East & Africa Soy Protein Industry Revenue (billion) Forecast, by Application 2020 & 2033
- Table 37: Global Soy Protein Industry Revenue billion Forecast, by Form 2020 & 2033
- Table 38: Global Soy Protein Industry Revenue billion Forecast, by End User 2020 & 2033
- Table 39: Global Soy Protein Industry Revenue billion Forecast, by Country 2020 & 2033
- Table 40: China Soy Protein Industry Revenue (billion) Forecast, by Application 2020 & 2033
- Table 41: India Soy Protein Industry Revenue (billion) Forecast, by Application 2020 & 2033
- Table 42: Japan Soy Protein Industry Revenue (billion) Forecast, by Application 2020 & 2033
- Table 43: South Korea Soy Protein Industry Revenue (billion) Forecast, by Application 2020 & 2033
- Table 44: ASEAN Soy Protein Industry Revenue (billion) Forecast, by Application 2020 & 2033
- Table 45: Oceania Soy Protein Industry Revenue (billion) Forecast, by Application 2020 & 2033
- Table 46: Rest of Asia Pacific Soy Protein Industry Revenue (billion) Forecast, by Application 2020 & 2033
Frequently Asked Questions
1. What is the projected Compound Annual Growth Rate (CAGR) of the Soy Protein Industry?
The projected CAGR is approximately 2.9%.
2. Which companies are prominent players in the Soy Protein Industry?
Key companies in the market include CHS Inc, International Flavors & Fragrances Inc, Wilmar International Lt, Archer Daniels Midland Company, Bunge Limited, Fuji Oil Group, Kerry Group PLC, A Costantino & C SpA.
3. What are the main segments of the Soy Protein Industry?
The market segments include Form, End User.
4. Can you provide details about the market size?
The market size is estimated to be USD 3.29 billion as of 2022.
5. What are some drivers contributing to market growth?
Increasing Consumer Demand for Products with Low Environmental Impacts; Dedicated Policies and Government Efforts to Promote the use of Biotechnology.
6. What are the notable trends driving market growth?
OTHER KEY INDUSTRY TRENDS COVERED IN THE REPORT.
7. Are there any restraints impacting market growth?
Deteriorating Fertility of Agricultural Lands.
8. Can you provide examples of recent developments in the market?
April 2021: Fuji Oil Holdings Inc.'s Dutch subsidiary invested in UNOVIS NCAP II Fund, a major fund specializing in food technology. The company plans to contribute to a sustainable society using its processing technologies for plant-based food materials to tackle the issues consumers face across the world.March 2021: Fuji Oil Group appointed Mikio Sakai as the new president and CEO. Mikio Sakai is engaged in developing Plant-based Food Solutions as a core concept to grow a third business pillar, along with the Oil and Fat and Chocolate businesses. Plant-based Food Solutions include soy meat and soybeans, which are used as raw materials for plant-based protein.February 2021: Bunge has expanded its soy protein manufacturing plants by purchasing two soy processing plants from the local crusher Imcopa for USD 12 million, reinforcing its position as the country's biggest oilseed processor.
9. What pricing options are available for accessing the report?
Pricing options include single-user, multi-user, and enterprise licenses priced at USD 3800, USD 4500, and USD 5800 respectively.
10. Is the market size provided in terms of value or volume?
The market size is provided in terms of value, measured in billion.
11. Are there any specific market keywords associated with the report?
Yes, the market keyword associated with the report is "Soy Protein Industry," which aids in identifying and referencing the specific market segment covered.
12. How do I determine which pricing option suits my needs best?
The pricing options vary based on user requirements and access needs. Individual users may opt for single-user licenses, while businesses requiring broader access may choose multi-user or enterprise licenses for cost-effective access to the report.
13. Are there any additional resources or data provided in the Soy Protein Industry report?
While the report offers comprehensive insights, it's advisable to review the specific contents or supplementary materials provided to ascertain if additional resources or data are available.
14. How can I stay updated on further developments or reports in the Soy Protein Industry?
To stay informed about further developments, trends, and reports in the Soy Protein Industry, consider subscribing to industry newsletters, following relevant companies and organizations, or regularly checking reputable industry news sources and publications.
Methodology
Step 1 - Identification of Relevant Samples Size from Population Database


Step 2 - Approaches for Defining Global Market Size (Value, Volume* & Price*)

Note*: In applicable scenarios
Step 3 - Data Sources
Primary Research
- Web Analytics
- Survey Reports
- Research Institute
- Latest Research Reports
- Opinion Leaders
Secondary Research
- Annual Reports
- White Paper
- Latest Press Release
- Industry Association
- Paid Database
- Investor Presentations

Step 4 - Data Triangulation
Involves using different sources of information in order to increase the validity of a study
These sources are likely to be stakeholders in a program - participants, other researchers, program staff, other community members, and so on.
Then we put all data in single framework & apply various statistical tools to find out the dynamic on the market.
During the analysis stage, feedback from the stakeholder groups would be compared to determine areas of agreement as well as areas of divergence