

Key Insights
The global preserved egg market is poised for significant expansion, driven by escalating consumer appetite across diverse international markets. Projections indicate a market size of 25.65 billion by 2025, with a projected Compound Annual Growth Rate (CAGR) of 7.39% from 2025 to 2033. This robust growth is underpinned by the increasing integration of preserved eggs into global culinary traditions, especially within Asian gastronomy. Concurrently, the rising demand for convenient, long-shelf-life food solutions and a growing global populace further bolster market expansion. Key market drivers include advancements in preservation technologies, heightened emphasis on product quality and safety, and a growing adoption of sustainable packaging. Despite these opportunities, potential market constraints arise from raw material price volatility and evolving consumer preferences for health-conscious food choices. Geographically, regions with established culinary histories featuring preserved eggs are expected to lead market performance. Prominent industry leaders such as Hubei God Dan, Goosun, and Gaoyou Hongsun Food are strategically positioned to capitalize on their expertise and extensive distribution networks.
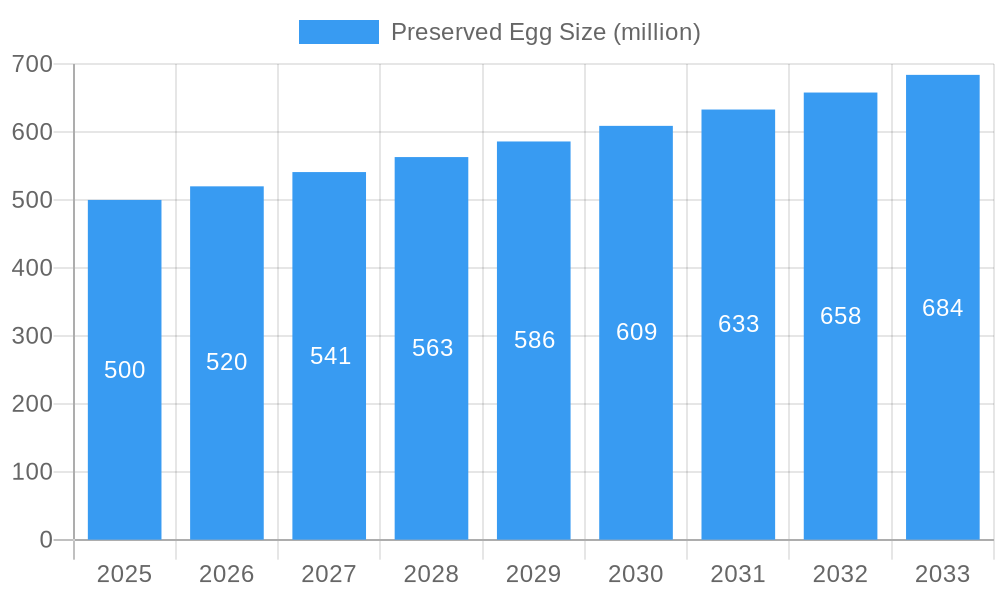
Preserved Egg Market Size (In Billion)
Sustained growth in the preserved egg market will depend on agile adaptation to evolving consumer tastes and the implementation of targeted marketing initiatives to broaden consumer reach. This necessitates educating consumers on the nutritional benefits and culinary versatility of preserved eggs, alongside identifying and cultivating new market segments. Companies must prioritize product innovation, introducing healthier formulations and novel flavor profiles to align with shifting consumer demands. Strategic collaborations, investment in research and development, and resilient supply chain management are critical for achieving sustained profitability in this competitive arena. This market presents substantial opportunities for entities that effectively harness these dynamics and respond proactively to the evolving market landscape.
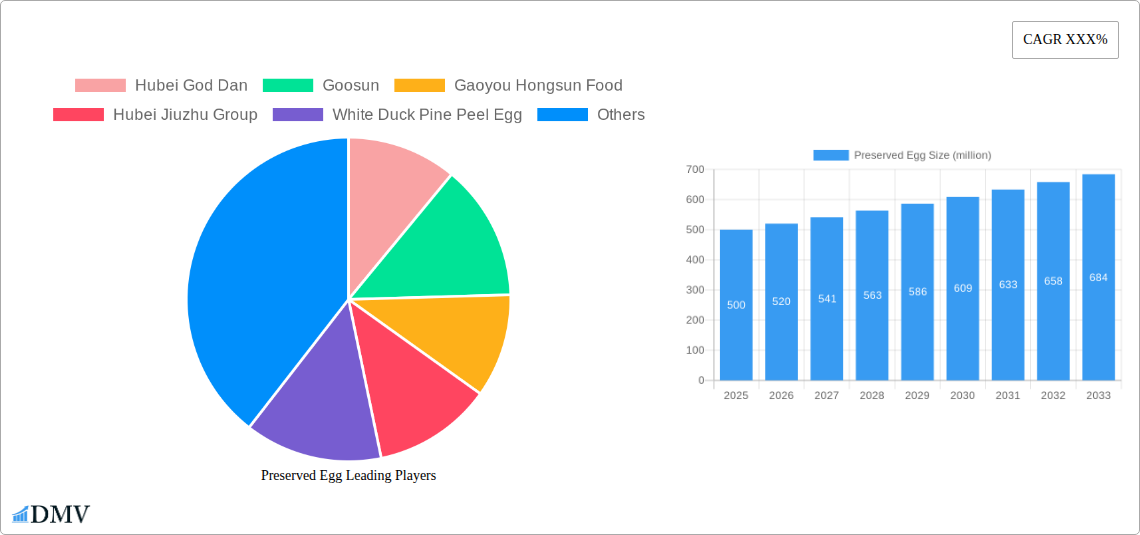
Preserved Egg Company Market Share
Preserved Egg Market Report: A Comprehensive Analysis (2019-2033)
This insightful report provides a comprehensive analysis of the global preserved egg market, projecting a multi-million dollar valuation by 2033. The study meticulously examines market dynamics, competitive landscapes, and future growth trajectories, offering invaluable insights for stakeholders across the industry. With a study period spanning 2019-2033, a base year of 2025, and a forecast period of 2025-2033, this report is an indispensable resource for strategic decision-making.
Preserved Egg Market Composition & Trends
This section delves into the intricate structure of the preserved egg market, assessing its concentration, innovation drivers, regulatory environment, substitute products, and end-user preferences. We analyze market share distribution amongst key players like Hubei God Dan, Goosun, and Gaoyou Hongsun Food, revealing a market concentration of xx%. Further, we examine the impact of M&A activities, estimating a total deal value of $xx million during the historical period (2019-2024). The influence of regulatory changes on market access and product standards is also comprehensively explored.
- Market Share Distribution (2025): Hubei God Dan (xx%), Goosun (xx%), Gaoyou Hongsun Food (xx%), Others (xx%).
- M&A Activity (2019-2024): Total deal value estimated at $xx million, with xx major transactions identified.
- Innovation Catalysts: Focus on improved preservation techniques, enhanced flavor profiles, and convenient packaging formats.
- Substitute Products: Analysis of competitive substitutes and their market impact.
- End-User Profiles: Detailed segmentation of consumer preferences and purchasing behavior.
Preserved Egg Industry Evolution
This section provides a detailed narrative of the preserved egg industry's evolution, examining market growth trajectories, technological advancements, and shifting consumer preferences. The historical period (2019-2024) witnessed a Compound Annual Growth Rate (CAGR) of xx%, driven by factors such as increasing consumer demand and product diversification. We project a CAGR of xx% during the forecast period (2025-2033), underpinned by technological innovations and expanding global markets. The report meticulously analyzes the adoption of new preservation technologies and packaging solutions and explores emerging consumer preferences for healthier and more convenient preserved egg products.
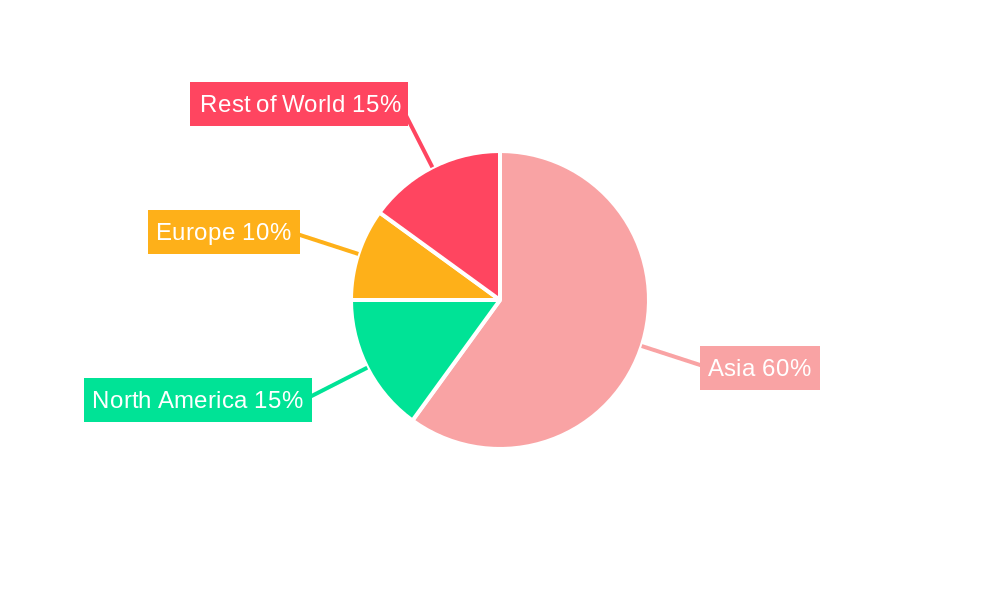
Leading Regions, Countries, or Segments in Preserved Egg
This section identifies the dominant regions and segments within the global preserved egg market. China emerges as the leading market, driven by a large consumer base and established production infrastructure.
- Key Drivers of China's Dominance:
- Strong domestic demand and consumption patterns.
- Established production base with numerous leading companies.
- Government support for agricultural development and food processing.
- Favorable climatic conditions for egg production.
The report further analyses the growth potential of other key regions, including Southeast Asia and parts of North America, highlighting the specific factors contributing to their respective market positions.
Preserved Egg Product Innovations
Recent years have witnessed significant innovations in preserved egg production, encompassing improved preservation techniques that extend shelf life, novel flavor profiles catering to diverse palates, and convenient packaging formats enhancing consumer experience. These innovations have led to the introduction of premium preserved egg varieties with enhanced nutritional value and unique selling propositions. Technological advancements, such as automated production lines and improved quality control measures, have also played a crucial role in driving innovation.
Propelling Factors for Preserved Egg Growth
Several key factors contribute to the anticipated growth of the preserved egg market. Rising disposable incomes in developing economies fuel increased demand for convenient and affordable protein sources. Technological advancements in preservation and processing techniques enhance product quality and shelf life, driving broader market penetration. Supportive government policies and investments in the agricultural sector also stimulate market growth.
Obstacles in the Preserved Egg Market
Despite the positive outlook, the preserved egg market faces several challenges. Fluctuations in raw material prices (eggs) directly impact production costs and profitability. Supply chain disruptions due to geopolitical instability or natural disasters can impact market stability. Intense competition among established players and the entry of new entrants create pressure on pricing and market share. Stringent food safety regulations and compliance costs can also pose challenges.
Future Opportunities in Preserved Egg
Future growth opportunities lie in expanding into new markets, particularly in regions with growing middle classes and increasing demand for convenience foods. Development of novel preserved egg products with enhanced nutritional value and customized flavors can attract new consumer segments. Innovation in packaging and distribution technologies will facilitate wider product availability and increase market penetration.
Major Players in the Preserved Egg Ecosystem
- Hubei God Dan
- Goosun
- Gaoyou Hongsun Food
- Hubei Jiuzhu Group
- White Duck Pine Peel Egg
- Sunday San Diego
- Weishan Lake
- Kunming Huaxi Animal Husbandry Group Co.,Ltd
- Jiangxi Hongmen Industrial Group
- Gaoyou Sanhu Egg Products Co.,Ltd
Key Developments in Preserved Egg Industry
- 2022 Q3: Gaoyou Hongsun Food launches a new line of organic preserved eggs.
- 2023 Q1: Hubei God Dan invests $xx million in a new state-of-the-art production facility.
- 2024 Q2: A major merger between two smaller preserved egg producers results in increased market consolidation. (Further details on specific mergers and acquisitions would be included in the full report).
Strategic Preserved Egg Market Forecast
The global preserved egg market is poised for robust growth throughout the forecast period (2025-2033). Driven by factors such as increasing consumer demand, technological innovation, and expansion into new markets, the market is expected to reach a valuation of $xx million by 2033. The report's strategic forecast identifies key opportunities for market participants, highlighting areas of innovation and market expansion with specific actionable insights.
Preserved Egg Segmentation
-
1. Application
- 1.1. Household
- 1.2. Catering Enterprises
- 1.3. Food Processing
-
2. Type
- 2.1. Egg
- 2.2. Duck's egg
Preserved Egg Segmentation By Geography
-
1. North America
- 1.1. United States
- 1.2. Canada
- 1.3. Mexico
-
2. South America
- 2.1. Brazil
- 2.2. Argentina
- 2.3. Rest of South America
-
3. Europe
- 3.1. United Kingdom
- 3.2. Germany
- 3.3. France
- 3.4. Italy
- 3.5. Spain
- 3.6. Russia
- 3.7. Benelux
- 3.8. Nordics
- 3.9. Rest of Europe
-
4. Middle East & Africa
- 4.1. Turkey
- 4.2. Israel
- 4.3. GCC
- 4.4. North Africa
- 4.5. South Africa
- 4.6. Rest of Middle East & Africa
-
5. Asia Pacific
- 5.1. China
- 5.2. India
- 5.3. Japan
- 5.4. South Korea
- 5.5. ASEAN
- 5.6. Oceania
- 5.7. Rest of Asia Pacific
Preserved Egg Regional Market Share
Geographic Coverage of Preserved Egg
Preserved Egg REPORT HIGHLIGHTS
| Aspects | Details |
|---|---|
| Study Period | 2020-2034 |
| Base Year | 2025 |
| Estimated Year | 2026 |
| Forecast Period | 2026-2034 |
| Historical Period | 2020-2025 |
| Growth Rate | CAGR of 7.39% from 2020-2034 |
| Segmentation |
|
Table of Contents
- 1. Introduction
- 1.1. Research Scope
- 1.2. Market Segmentation
- 1.3. Research Methodology
- 1.4. Definitions and Assumptions
- 2. Executive Summary
- 2.1. Introduction
- 3. Market Dynamics
- 3.1. Introduction
- 3.2. Market Drivers
- 3.3. Market Restrains
- 3.4. Market Trends
- 4. Market Factor Analysis
- 4.1. Porters Five Forces
- 4.2. Supply/Value Chain
- 4.3. PESTEL analysis
- 4.4. Market Entropy
- 4.5. Patent/Trademark Analysis
- 5. Global Preserved Egg Analysis, Insights and Forecast, 2020-2032
- 5.1. Market Analysis, Insights and Forecast - by Application
- 5.1.1. Household
- 5.1.2. Catering Enterprises
- 5.1.3. Food Processing
- 5.2. Market Analysis, Insights and Forecast - by Type
- 5.2.1. Egg
- 5.2.2. Duck's egg
- 5.3. Market Analysis, Insights and Forecast - by Region
- 5.3.1. North America
- 5.3.2. South America
- 5.3.3. Europe
- 5.3.4. Middle East & Africa
- 5.3.5. Asia Pacific
- 5.1. Market Analysis, Insights and Forecast - by Application
- 6. North America Preserved Egg Analysis, Insights and Forecast, 2020-2032
- 6.1. Market Analysis, Insights and Forecast - by Application
- 6.1.1. Household
- 6.1.2. Catering Enterprises
- 6.1.3. Food Processing
- 6.2. Market Analysis, Insights and Forecast - by Type
- 6.2.1. Egg
- 6.2.2. Duck's egg
- 6.1. Market Analysis, Insights and Forecast - by Application
- 7. South America Preserved Egg Analysis, Insights and Forecast, 2020-2032
- 7.1. Market Analysis, Insights and Forecast - by Application
- 7.1.1. Household
- 7.1.2. Catering Enterprises
- 7.1.3. Food Processing
- 7.2. Market Analysis, Insights and Forecast - by Type
- 7.2.1. Egg
- 7.2.2. Duck's egg
- 7.1. Market Analysis, Insights and Forecast - by Application
- 8. Europe Preserved Egg Analysis, Insights and Forecast, 2020-2032
- 8.1. Market Analysis, Insights and Forecast - by Application
- 8.1.1. Household
- 8.1.2. Catering Enterprises
- 8.1.3. Food Processing
- 8.2. Market Analysis, Insights and Forecast - by Type
- 8.2.1. Egg
- 8.2.2. Duck's egg
- 8.1. Market Analysis, Insights and Forecast - by Application
- 9. Middle East & Africa Preserved Egg Analysis, Insights and Forecast, 2020-2032
- 9.1. Market Analysis, Insights and Forecast - by Application
- 9.1.1. Household
- 9.1.2. Catering Enterprises
- 9.1.3. Food Processing
- 9.2. Market Analysis, Insights and Forecast - by Type
- 9.2.1. Egg
- 9.2.2. Duck's egg
- 9.1. Market Analysis, Insights and Forecast - by Application
- 10. Asia Pacific Preserved Egg Analysis, Insights and Forecast, 2020-2032
- 10.1. Market Analysis, Insights and Forecast - by Application
- 10.1.1. Household
- 10.1.2. Catering Enterprises
- 10.1.3. Food Processing
- 10.2. Market Analysis, Insights and Forecast - by Type
- 10.2.1. Egg
- 10.2.2. Duck's egg
- 10.1. Market Analysis, Insights and Forecast - by Application
- 11. Competitive Analysis
- 11.1. Global Market Share Analysis 2025
- 11.2. Company Profiles
- 11.2.1 Hubei God Dan
- 11.2.1.1. Overview
- 11.2.1.2. Products
- 11.2.1.3. SWOT Analysis
- 11.2.1.4. Recent Developments
- 11.2.1.5. Financials (Based on Availability)
- 11.2.2 Goosun
- 11.2.2.1. Overview
- 11.2.2.2. Products
- 11.2.2.3. SWOT Analysis
- 11.2.2.4. Recent Developments
- 11.2.2.5. Financials (Based on Availability)
- 11.2.3 Gaoyou Hongsun Food
- 11.2.3.1. Overview
- 11.2.3.2. Products
- 11.2.3.3. SWOT Analysis
- 11.2.3.4. Recent Developments
- 11.2.3.5. Financials (Based on Availability)
- 11.2.4 Hubei Jiuzhu Group
- 11.2.4.1. Overview
- 11.2.4.2. Products
- 11.2.4.3. SWOT Analysis
- 11.2.4.4. Recent Developments
- 11.2.4.5. Financials (Based on Availability)
- 11.2.5 White Duck Pine Peel Egg
- 11.2.5.1. Overview
- 11.2.5.2. Products
- 11.2.5.3. SWOT Analysis
- 11.2.5.4. Recent Developments
- 11.2.5.5. Financials (Based on Availability)
- 11.2.6 Sunday San Diego
- 11.2.6.1. Overview
- 11.2.6.2. Products
- 11.2.6.3. SWOT Analysis
- 11.2.6.4. Recent Developments
- 11.2.6.5. Financials (Based on Availability)
- 11.2.7 Weishan Lake
- 11.2.7.1. Overview
- 11.2.7.2. Products
- 11.2.7.3. SWOT Analysis
- 11.2.7.4. Recent Developments
- 11.2.7.5. Financials (Based on Availability)
- 11.2.8 Kunming Huaxi Animal Husbandry Group Co.
- 11.2.8.1. Overview
- 11.2.8.2. Products
- 11.2.8.3. SWOT Analysis
- 11.2.8.4. Recent Developments
- 11.2.8.5. Financials (Based on Availability)
- 11.2.9 Ltd
- 11.2.9.1. Overview
- 11.2.9.2. Products
- 11.2.9.3. SWOT Analysis
- 11.2.9.4. Recent Developments
- 11.2.9.5. Financials (Based on Availability)
- 11.2.10 Jiangxi Hongmen Industrial Group
- 11.2.10.1. Overview
- 11.2.10.2. Products
- 11.2.10.3. SWOT Analysis
- 11.2.10.4. Recent Developments
- 11.2.10.5. Financials (Based on Availability)
- 11.2.11 Gaoyou Sanhu Egg Products Co.
- 11.2.11.1. Overview
- 11.2.11.2. Products
- 11.2.11.3. SWOT Analysis
- 11.2.11.4. Recent Developments
- 11.2.11.5. Financials (Based on Availability)
- 11.2.12 Ltd
- 11.2.12.1. Overview
- 11.2.12.2. Products
- 11.2.12.3. SWOT Analysis
- 11.2.12.4. Recent Developments
- 11.2.12.5. Financials (Based on Availability)
- 11.2.1 Hubei God Dan
List of Figures
- Figure 1: Global Preserved Egg Revenue Breakdown (billion, %) by Region 2025 & 2033
- Figure 2: Global Preserved Egg Volume Breakdown (K, %) by Region 2025 & 2033
- Figure 3: North America Preserved Egg Revenue (billion), by Application 2025 & 2033
- Figure 4: North America Preserved Egg Volume (K), by Application 2025 & 2033
- Figure 5: North America Preserved Egg Revenue Share (%), by Application 2025 & 2033
- Figure 6: North America Preserved Egg Volume Share (%), by Application 2025 & 2033
- Figure 7: North America Preserved Egg Revenue (billion), by Type 2025 & 2033
- Figure 8: North America Preserved Egg Volume (K), by Type 2025 & 2033
- Figure 9: North America Preserved Egg Revenue Share (%), by Type 2025 & 2033
- Figure 10: North America Preserved Egg Volume Share (%), by Type 2025 & 2033
- Figure 11: North America Preserved Egg Revenue (billion), by Country 2025 & 2033
- Figure 12: North America Preserved Egg Volume (K), by Country 2025 & 2033
- Figure 13: North America Preserved Egg Revenue Share (%), by Country 2025 & 2033
- Figure 14: North America Preserved Egg Volume Share (%), by Country 2025 & 2033
- Figure 15: South America Preserved Egg Revenue (billion), by Application 2025 & 2033
- Figure 16: South America Preserved Egg Volume (K), by Application 2025 & 2033
- Figure 17: South America Preserved Egg Revenue Share (%), by Application 2025 & 2033
- Figure 18: South America Preserved Egg Volume Share (%), by Application 2025 & 2033
- Figure 19: South America Preserved Egg Revenue (billion), by Type 2025 & 2033
- Figure 20: South America Preserved Egg Volume (K), by Type 2025 & 2033
- Figure 21: South America Preserved Egg Revenue Share (%), by Type 2025 & 2033
- Figure 22: South America Preserved Egg Volume Share (%), by Type 2025 & 2033
- Figure 23: South America Preserved Egg Revenue (billion), by Country 2025 & 2033
- Figure 24: South America Preserved Egg Volume (K), by Country 2025 & 2033
- Figure 25: South America Preserved Egg Revenue Share (%), by Country 2025 & 2033
- Figure 26: South America Preserved Egg Volume Share (%), by Country 2025 & 2033
- Figure 27: Europe Preserved Egg Revenue (billion), by Application 2025 & 2033
- Figure 28: Europe Preserved Egg Volume (K), by Application 2025 & 2033
- Figure 29: Europe Preserved Egg Revenue Share (%), by Application 2025 & 2033
- Figure 30: Europe Preserved Egg Volume Share (%), by Application 2025 & 2033
- Figure 31: Europe Preserved Egg Revenue (billion), by Type 2025 & 2033
- Figure 32: Europe Preserved Egg Volume (K), by Type 2025 & 2033
- Figure 33: Europe Preserved Egg Revenue Share (%), by Type 2025 & 2033
- Figure 34: Europe Preserved Egg Volume Share (%), by Type 2025 & 2033
- Figure 35: Europe Preserved Egg Revenue (billion), by Country 2025 & 2033
- Figure 36: Europe Preserved Egg Volume (K), by Country 2025 & 2033
- Figure 37: Europe Preserved Egg Revenue Share (%), by Country 2025 & 2033
- Figure 38: Europe Preserved Egg Volume Share (%), by Country 2025 & 2033
- Figure 39: Middle East & Africa Preserved Egg Revenue (billion), by Application 2025 & 2033
- Figure 40: Middle East & Africa Preserved Egg Volume (K), by Application 2025 & 2033
- Figure 41: Middle East & Africa Preserved Egg Revenue Share (%), by Application 2025 & 2033
- Figure 42: Middle East & Africa Preserved Egg Volume Share (%), by Application 2025 & 2033
- Figure 43: Middle East & Africa Preserved Egg Revenue (billion), by Type 2025 & 2033
- Figure 44: Middle East & Africa Preserved Egg Volume (K), by Type 2025 & 2033
- Figure 45: Middle East & Africa Preserved Egg Revenue Share (%), by Type 2025 & 2033
- Figure 46: Middle East & Africa Preserved Egg Volume Share (%), by Type 2025 & 2033
- Figure 47: Middle East & Africa Preserved Egg Revenue (billion), by Country 2025 & 2033
- Figure 48: Middle East & Africa Preserved Egg Volume (K), by Country 2025 & 2033
- Figure 49: Middle East & Africa Preserved Egg Revenue Share (%), by Country 2025 & 2033
- Figure 50: Middle East & Africa Preserved Egg Volume Share (%), by Country 2025 & 2033
- Figure 51: Asia Pacific Preserved Egg Revenue (billion), by Application 2025 & 2033
- Figure 52: Asia Pacific Preserved Egg Volume (K), by Application 2025 & 2033
- Figure 53: Asia Pacific Preserved Egg Revenue Share (%), by Application 2025 & 2033
- Figure 54: Asia Pacific Preserved Egg Volume Share (%), by Application 2025 & 2033
- Figure 55: Asia Pacific Preserved Egg Revenue (billion), by Type 2025 & 2033
- Figure 56: Asia Pacific Preserved Egg Volume (K), by Type 2025 & 2033
- Figure 57: Asia Pacific Preserved Egg Revenue Share (%), by Type 2025 & 2033
- Figure 58: Asia Pacific Preserved Egg Volume Share (%), by Type 2025 & 2033
- Figure 59: Asia Pacific Preserved Egg Revenue (billion), by Country 2025 & 2033
- Figure 60: Asia Pacific Preserved Egg Volume (K), by Country 2025 & 2033
- Figure 61: Asia Pacific Preserved Egg Revenue Share (%), by Country 2025 & 2033
- Figure 62: Asia Pacific Preserved Egg Volume Share (%), by Country 2025 & 2033
List of Tables
- Table 1: Global Preserved Egg Revenue billion Forecast, by Application 2020 & 2033
- Table 2: Global Preserved Egg Volume K Forecast, by Application 2020 & 2033
- Table 3: Global Preserved Egg Revenue billion Forecast, by Type 2020 & 2033
- Table 4: Global Preserved Egg Volume K Forecast, by Type 2020 & 2033
- Table 5: Global Preserved Egg Revenue billion Forecast, by Region 2020 & 2033
- Table 6: Global Preserved Egg Volume K Forecast, by Region 2020 & 2033
- Table 7: Global Preserved Egg Revenue billion Forecast, by Application 2020 & 2033
- Table 8: Global Preserved Egg Volume K Forecast, by Application 2020 & 2033
- Table 9: Global Preserved Egg Revenue billion Forecast, by Type 2020 & 2033
- Table 10: Global Preserved Egg Volume K Forecast, by Type 2020 & 2033
- Table 11: Global Preserved Egg Revenue billion Forecast, by Country 2020 & 2033
- Table 12: Global Preserved Egg Volume K Forecast, by Country 2020 & 2033
- Table 13: United States Preserved Egg Revenue (billion) Forecast, by Application 2020 & 2033
- Table 14: United States Preserved Egg Volume (K) Forecast, by Application 2020 & 2033
- Table 15: Canada Preserved Egg Revenue (billion) Forecast, by Application 2020 & 2033
- Table 16: Canada Preserved Egg Volume (K) Forecast, by Application 2020 & 2033
- Table 17: Mexico Preserved Egg Revenue (billion) Forecast, by Application 2020 & 2033
- Table 18: Mexico Preserved Egg Volume (K) Forecast, by Application 2020 & 2033
- Table 19: Global Preserved Egg Revenue billion Forecast, by Application 2020 & 2033
- Table 20: Global Preserved Egg Volume K Forecast, by Application 2020 & 2033
- Table 21: Global Preserved Egg Revenue billion Forecast, by Type 2020 & 2033
- Table 22: Global Preserved Egg Volume K Forecast, by Type 2020 & 2033
- Table 23: Global Preserved Egg Revenue billion Forecast, by Country 2020 & 2033
- Table 24: Global Preserved Egg Volume K Forecast, by Country 2020 & 2033
- Table 25: Brazil Preserved Egg Revenue (billion) Forecast, by Application 2020 & 2033
- Table 26: Brazil Preserved Egg Volume (K) Forecast, by Application 2020 & 2033
- Table 27: Argentina Preserved Egg Revenue (billion) Forecast, by Application 2020 & 2033
- Table 28: Argentina Preserved Egg Volume (K) Forecast, by Application 2020 & 2033
- Table 29: Rest of South America Preserved Egg Revenue (billion) Forecast, by Application 2020 & 2033
- Table 30: Rest of South America Preserved Egg Volume (K) Forecast, by Application 2020 & 2033
- Table 31: Global Preserved Egg Revenue billion Forecast, by Application 2020 & 2033
- Table 32: Global Preserved Egg Volume K Forecast, by Application 2020 & 2033
- Table 33: Global Preserved Egg Revenue billion Forecast, by Type 2020 & 2033
- Table 34: Global Preserved Egg Volume K Forecast, by Type 2020 & 2033
- Table 35: Global Preserved Egg Revenue billion Forecast, by Country 2020 & 2033
- Table 36: Global Preserved Egg Volume K Forecast, by Country 2020 & 2033
- Table 37: United Kingdom Preserved Egg Revenue (billion) Forecast, by Application 2020 & 2033
- Table 38: United Kingdom Preserved Egg Volume (K) Forecast, by Application 2020 & 2033
- Table 39: Germany Preserved Egg Revenue (billion) Forecast, by Application 2020 & 2033
- Table 40: Germany Preserved Egg Volume (K) Forecast, by Application 2020 & 2033
- Table 41: France Preserved Egg Revenue (billion) Forecast, by Application 2020 & 2033
- Table 42: France Preserved Egg Volume (K) Forecast, by Application 2020 & 2033
- Table 43: Italy Preserved Egg Revenue (billion) Forecast, by Application 2020 & 2033
- Table 44: Italy Preserved Egg Volume (K) Forecast, by Application 2020 & 2033
- Table 45: Spain Preserved Egg Revenue (billion) Forecast, by Application 2020 & 2033
- Table 46: Spain Preserved Egg Volume (K) Forecast, by Application 2020 & 2033
- Table 47: Russia Preserved Egg Revenue (billion) Forecast, by Application 2020 & 2033
- Table 48: Russia Preserved Egg Volume (K) Forecast, by Application 2020 & 2033
- Table 49: Benelux Preserved Egg Revenue (billion) Forecast, by Application 2020 & 2033
- Table 50: Benelux Preserved Egg Volume (K) Forecast, by Application 2020 & 2033
- Table 51: Nordics Preserved Egg Revenue (billion) Forecast, by Application 2020 & 2033
- Table 52: Nordics Preserved Egg Volume (K) Forecast, by Application 2020 & 2033
- Table 53: Rest of Europe Preserved Egg Revenue (billion) Forecast, by Application 2020 & 2033
- Table 54: Rest of Europe Preserved Egg Volume (K) Forecast, by Application 2020 & 2033
- Table 55: Global Preserved Egg Revenue billion Forecast, by Application 2020 & 2033
- Table 56: Global Preserved Egg Volume K Forecast, by Application 2020 & 2033
- Table 57: Global Preserved Egg Revenue billion Forecast, by Type 2020 & 2033
- Table 58: Global Preserved Egg Volume K Forecast, by Type 2020 & 2033
- Table 59: Global Preserved Egg Revenue billion Forecast, by Country 2020 & 2033
- Table 60: Global Preserved Egg Volume K Forecast, by Country 2020 & 2033
- Table 61: Turkey Preserved Egg Revenue (billion) Forecast, by Application 2020 & 2033
- Table 62: Turkey Preserved Egg Volume (K) Forecast, by Application 2020 & 2033
- Table 63: Israel Preserved Egg Revenue (billion) Forecast, by Application 2020 & 2033
- Table 64: Israel Preserved Egg Volume (K) Forecast, by Application 2020 & 2033
- Table 65: GCC Preserved Egg Revenue (billion) Forecast, by Application 2020 & 2033
- Table 66: GCC Preserved Egg Volume (K) Forecast, by Application 2020 & 2033
- Table 67: North Africa Preserved Egg Revenue (billion) Forecast, by Application 2020 & 2033
- Table 68: North Africa Preserved Egg Volume (K) Forecast, by Application 2020 & 2033
- Table 69: South Africa Preserved Egg Revenue (billion) Forecast, by Application 2020 & 2033
- Table 70: South Africa Preserved Egg Volume (K) Forecast, by Application 2020 & 2033
- Table 71: Rest of Middle East & Africa Preserved Egg Revenue (billion) Forecast, by Application 2020 & 2033
- Table 72: Rest of Middle East & Africa Preserved Egg Volume (K) Forecast, by Application 2020 & 2033
- Table 73: Global Preserved Egg Revenue billion Forecast, by Application 2020 & 2033
- Table 74: Global Preserved Egg Volume K Forecast, by Application 2020 & 2033
- Table 75: Global Preserved Egg Revenue billion Forecast, by Type 2020 & 2033
- Table 76: Global Preserved Egg Volume K Forecast, by Type 2020 & 2033
- Table 77: Global Preserved Egg Revenue billion Forecast, by Country 2020 & 2033
- Table 78: Global Preserved Egg Volume K Forecast, by Country 2020 & 2033
- Table 79: China Preserved Egg Revenue (billion) Forecast, by Application 2020 & 2033
- Table 80: China Preserved Egg Volume (K) Forecast, by Application 2020 & 2033
- Table 81: India Preserved Egg Revenue (billion) Forecast, by Application 2020 & 2033
- Table 82: India Preserved Egg Volume (K) Forecast, by Application 2020 & 2033
- Table 83: Japan Preserved Egg Revenue (billion) Forecast, by Application 2020 & 2033
- Table 84: Japan Preserved Egg Volume (K) Forecast, by Application 2020 & 2033
- Table 85: South Korea Preserved Egg Revenue (billion) Forecast, by Application 2020 & 2033
- Table 86: South Korea Preserved Egg Volume (K) Forecast, by Application 2020 & 2033
- Table 87: ASEAN Preserved Egg Revenue (billion) Forecast, by Application 2020 & 2033
- Table 88: ASEAN Preserved Egg Volume (K) Forecast, by Application 2020 & 2033
- Table 89: Oceania Preserved Egg Revenue (billion) Forecast, by Application 2020 & 2033
- Table 90: Oceania Preserved Egg Volume (K) Forecast, by Application 2020 & 2033
- Table 91: Rest of Asia Pacific Preserved Egg Revenue (billion) Forecast, by Application 2020 & 2033
- Table 92: Rest of Asia Pacific Preserved Egg Volume (K) Forecast, by Application 2020 & 2033
Frequently Asked Questions
1. What is the projected Compound Annual Growth Rate (CAGR) of the Preserved Egg?
The projected CAGR is approximately 7.39%.
2. Which companies are prominent players in the Preserved Egg?
Key companies in the market include Hubei God Dan, Goosun, Gaoyou Hongsun Food, Hubei Jiuzhu Group, White Duck Pine Peel Egg, Sunday San Diego, Weishan Lake, Kunming Huaxi Animal Husbandry Group Co., Ltd, Jiangxi Hongmen Industrial Group, Gaoyou Sanhu Egg Products Co., Ltd.
3. What are the main segments of the Preserved Egg?
The market segments include Application, Type.
4. Can you provide details about the market size?
The market size is estimated to be USD 25.65 billion as of 2022.
5. What are some drivers contributing to market growth?
N/A
6. What are the notable trends driving market growth?
N/A
7. Are there any restraints impacting market growth?
N/A
8. Can you provide examples of recent developments in the market?
N/A
9. What pricing options are available for accessing the report?
Pricing options include single-user, multi-user, and enterprise licenses priced at USD 3950.00, USD 5925.00, and USD 7900.00 respectively.
10. Is the market size provided in terms of value or volume?
The market size is provided in terms of value, measured in billion and volume, measured in K.
11. Are there any specific market keywords associated with the report?
Yes, the market keyword associated with the report is "Preserved Egg," which aids in identifying and referencing the specific market segment covered.
12. How do I determine which pricing option suits my needs best?
The pricing options vary based on user requirements and access needs. Individual users may opt for single-user licenses, while businesses requiring broader access may choose multi-user or enterprise licenses for cost-effective access to the report.
13. Are there any additional resources or data provided in the Preserved Egg report?
While the report offers comprehensive insights, it's advisable to review the specific contents or supplementary materials provided to ascertain if additional resources or data are available.
14. How can I stay updated on further developments or reports in the Preserved Egg?
To stay informed about further developments, trends, and reports in the Preserved Egg, consider subscribing to industry newsletters, following relevant companies and organizations, or regularly checking reputable industry news sources and publications.
Methodology
Step 1 - Identification of Relevant Samples Size from Population Database


Step 2 - Approaches for Defining Global Market Size (Value, Volume* & Price*)

Note*: In applicable scenarios
Step 3 - Data Sources
Primary Research
- Web Analytics
- Survey Reports
- Research Institute
- Latest Research Reports
- Opinion Leaders
Secondary Research
- Annual Reports
- White Paper
- Latest Press Release
- Industry Association
- Paid Database
- Investor Presentations

Step 4 - Data Triangulation
Involves using different sources of information in order to increase the validity of a study
These sources are likely to be stakeholders in a program - participants, other researchers, program staff, other community members, and so on.
Then we put all data in single framework & apply various statistical tools to find out the dynamic on the market.
During the analysis stage, feedback from the stakeholder groups would be compared to determine areas of agreement as well as areas of divergence