

Key Insights
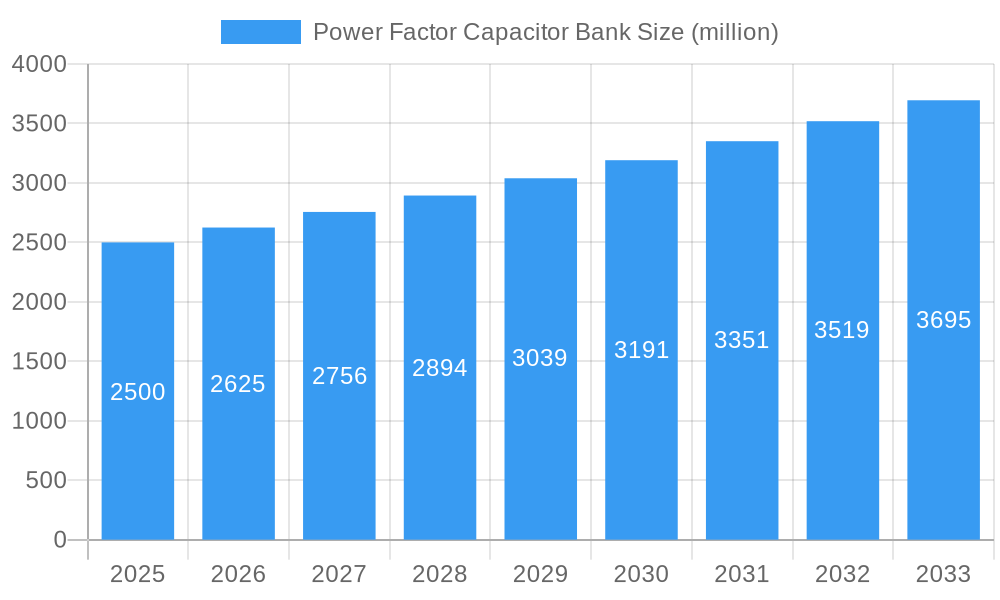
The global power factor capacitor bank market is poised for significant expansion, propelled by escalating electricity consumption, stringent energy efficiency mandates, and the widespread integration of renewable energy sources. This growth is driven by the imperative to enhance power quality, curtail energy losses, and optimize electricity expenditures across industrial and commercial sectors. Key growth catalysts include the increasing adoption of electric vehicles, the burgeoning demand from data centers for stable power, and the critical modernization of aging electrical infrastructure. Innovations yielding higher efficiency, compact designs, and extended lifespans are further fueling market advancement. While initial investment costs present a potential barrier, the long-term economic benefits derived from reduced energy consumption and improved grid stability position capacitor banks as a compelling financial solution. Leading industry players are strategically investing in R&D, M&A activities, and global expansion to reinforce their market positions. Market segmentation is anticipated across capacitor types (low, medium, high voltage), applications (industrial, commercial, residential), and power ratings. Our analysis projects a market size of $5.02 billion in the base year 2025, with a compound annual growth rate (CAGR) of approximately 4.55% for the forecast period.
Power Factor Capacitor Bank Market Size (In Billion)
The competitive arena features a blend of established global enterprises and agile regional specialists. Strategic alliances, collaborations, and technological breakthroughs are expected to define the market's future trajectory. Emphasis will be placed on developing advanced capacitor technologies for superior efficiency, enhanced reliability, and seamless grid integration. Companies are also expanding service portfolios, including maintenance, monitoring, and remote diagnostics, to elevate customer value and generate recurring revenue. The global transition towards sustainable energy practices will continue to boost demand for power factor capacitor banks, given their crucial role in optimizing energy efficiency and ensuring grid stability within renewable energy systems. This sustained growth, augmented by technological innovation and supportive regulatory frameworks, ensures a promising outlook for the power factor capacitor bank market.
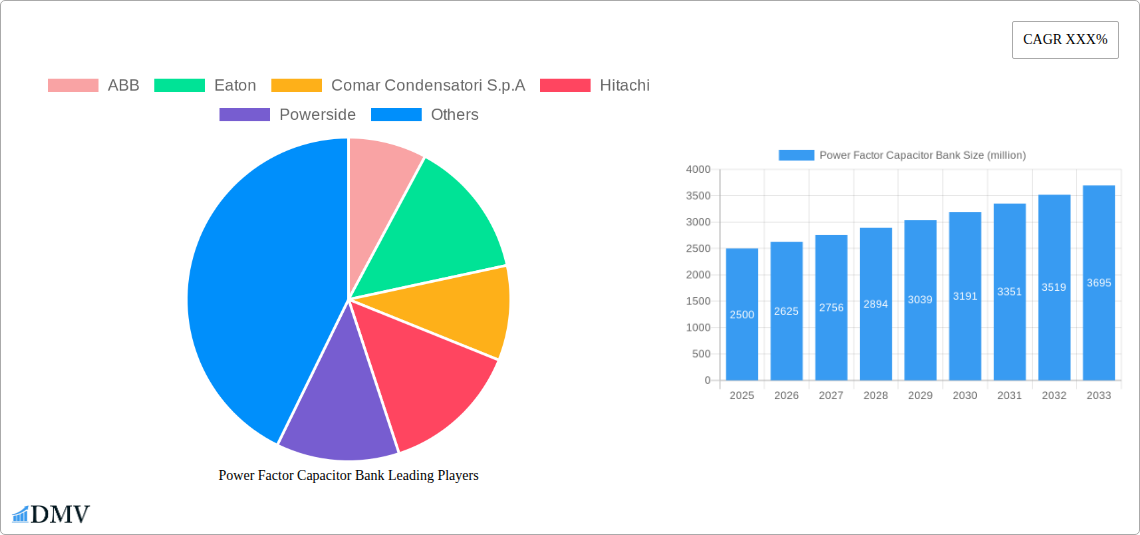
Power Factor Capacitor Bank Company Market Share
Power Factor Capacitor Bank Market Report: A Comprehensive Analysis (2019-2033)
This insightful report provides a comprehensive analysis of the global Power Factor Capacitor Bank market, offering a detailed assessment of market size, growth drivers, competitive landscape, and future outlook. With a study period spanning from 2019 to 2033, including a base year of 2025 and a forecast period from 2025 to 2033, this report is an invaluable resource for stakeholders seeking to understand and capitalize on the opportunities within this dynamic market. The market is estimated to be worth $XX million in 2025 and is projected to reach $XX million by 2033, exhibiting a CAGR of XX%. Key players analyzed include ABB, Eaton, Comar Condensatori S.p.A, Hitachi, Powerside, Siemens, Toshiba Corporation, Circutor, and Enerlux Power s.r.l.
Power Factor Capacitor Bank Market Composition & Trends
This section delves into the intricate dynamics of the Power Factor Capacitor Bank market, evaluating its concentration, innovative drivers, regulatory landscape, substitute products, end-user profiles, and mergers & acquisitions (M&A) activities. The market exhibits a moderately concentrated structure, with the top five players holding an estimated XX% market share in 2025. Innovation is primarily driven by the demand for energy efficiency and grid stability improvements, leading to the development of advanced capacitor technologies with higher reliability and lifespan. Stringent environmental regulations across various regions are further propelling the adoption of these banks. Substitute products, such as synchronous condensers, face challenges due to higher installation and operational costs. End users primarily include industrial facilities, commercial buildings, and power utilities. M&A activity has been relatively modest in recent years, with the largest deal valued at approximately $XX million in 2024.
- Market Share Distribution (2025): ABB (XX%), Eaton (XX%), Siemens (XX%), Toshiba Corporation (XX%), Others (XX%).
- M&A Deal Value (2019-2024): Total value approximately $XX million.
- Key End-Users: Industrial facilities, commercial buildings, power utilities.
- Regulatory Landscape: Increasing emphasis on energy efficiency and grid modernization.
Power Factor Capacitor Bank Industry Evolution
The Power Factor Capacitor Bank market has witnessed significant evolution since 2019. Growth has been driven primarily by rising energy costs, increasing industrialization, and the need to comply with stricter energy efficiency standards globally. Technological advancements, such as the introduction of smart capacitor banks with advanced monitoring and control capabilities, have further fueled market expansion. Consumer demand is shifting towards higher efficiency and longer lifespan solutions, creating opportunities for manufacturers to offer premium products. The historical period (2019-2024) showed a CAGR of XX%, while the forecast period (2025-2033) is projected to exhibit a CAGR of XX%. Adoption rates are increasing significantly in developing economies, driven by rapid industrial growth and infrastructure development. The market experienced a slight dip during 2020-2021 due to the global pandemic, but has since recovered and continues on a growth trajectory.
Leading Regions, Countries, or Segments in Power Factor Capacitor Bank
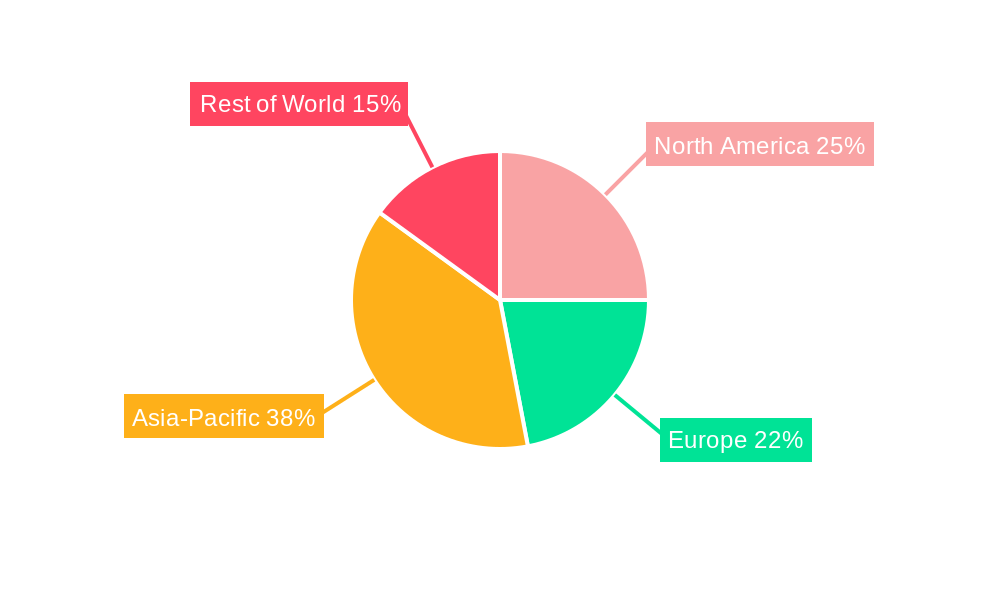
The North American region currently holds a dominant position in the Power Factor Capacitor Bank market, driven by robust industrial growth, stringent energy efficiency regulations, and significant investments in grid modernization projects. The market in China and other parts of Asia-Pacific is also experiencing rapid growth, fueled by industrial expansion and increasing power demand.
- Key Drivers in North America: Stringent energy efficiency regulations, high investments in grid infrastructure, and strong industrial base.
- Key Drivers in Asia-Pacific: Rapid industrialization, increasing power demand, and supportive government policies.
- Dominance Factors: High energy consumption in developed economies, and focus on grid stability improvements across all regions.
Power Factor Capacitor Bank Product Innovations
Recent product innovations focus on enhancing efficiency, reducing losses, and improving monitoring capabilities. Smart capacitor banks with advanced control systems and predictive maintenance features are gaining popularity. These innovations offer improved energy savings, extended lifespan, and reduced operational costs, leading to strong value propositions for end-users. Miniaturization and modular designs are also trending, allowing for flexible and scalable installations.
Propelling Factors for Power Factor Capacitor Bank Growth
The Power Factor Capacitor Bank market's growth is propelled by several factors. Firstly, rising electricity prices incentivize energy efficiency improvements. Secondly, stringent government regulations promoting energy conservation are driving adoption. Thirdly, the increasing demand for reliable and efficient power supply across various industries is a key catalyst. Finally, technological advancements leading to improved efficiency and reduced maintenance are further boosting market expansion.
Obstacles in the Power Factor Capacitor Bank Market
The market faces several challenges. High initial investment costs can be a barrier to entry for some potential customers. Supply chain disruptions can impact the availability of raw materials and components. Intense competition among established players may lead to price pressure. Furthermore, technological advancements are rapidly altering the competitive landscape.
Future Opportunities in Power Factor Capacitor Bank
Emerging markets in developing countries present significant growth potential. Advancements in energy storage technologies, such as integration with battery systems, are opening new avenues. Smart grid initiatives will further drive demand for sophisticated power factor correction solutions. The focus on sustainable energy practices also contributes to expanding market opportunities.
Major Players in the Power Factor Capacitor Bank Ecosystem
- ABB
- Eaton
- Comar Condensatori S.p.A
- Hitachi
- Powerside
- Siemens
- Toshiba Corporation
- Circutor
- Enerlux Power s.r.l.
Key Developments in Power Factor Capacitor Bank Industry
- 2022 Q4: ABB launched a new line of smart capacitor banks with integrated IoT capabilities.
- 2023 Q1: Eaton acquired a smaller capacitor bank manufacturer, expanding its market share.
- 2024 Q2: Siemens announced a significant investment in R&D for advanced capacitor technologies.
- 2025 Q1: New industry standards for power factor correction were introduced in several major markets.
Strategic Power Factor Capacitor Bank Market Forecast
The Power Factor Capacitor Bank market is poised for substantial growth driven by increasing energy efficiency mandates, grid modernization efforts, and technological advancements leading to cost-effective and reliable solutions. The forecast period will see significant adoption in emerging economies, along with increased penetration of smart capacitor banks in developed markets. This positive outlook is further reinforced by the continuous rise in energy demand and the global focus on sustainable power solutions.
Power Factor Capacitor Bank Segmentation
-
1. Application
- 1.1. undefined
-
2. Type
- 2.1. undefined
Power Factor Capacitor Bank Segmentation By Geography
- 1. undefined
- 2. undefined
- 3. undefined
- 4. undefined
- 5. undefined
Power Factor Capacitor Bank Regional Market Share
Geographic Coverage of Power Factor Capacitor Bank
Power Factor Capacitor Bank REPORT HIGHLIGHTS
| Aspects | Details |
|---|---|
| Study Period | 2020-2034 |
| Base Year | 2025 |
| Estimated Year | 2026 |
| Forecast Period | 2026-2034 |
| Historical Period | 2020-2025 |
| Growth Rate | CAGR of 4.55% from 2020-2034 |
| Segmentation |
|
Table of Contents
- 1. Introduction
- 1.1. Research Scope
- 1.2. Market Segmentation
- 1.3. Research Methodology
- 1.4. Definitions and Assumptions
- 2. Executive Summary
- 2.1. Introduction
- 3. Market Dynamics
- 3.1. Introduction
- 3.2. Market Drivers
- 3.3. Market Restrains
- 3.4. Market Trends
- 4. Market Factor Analysis
- 4.1. Porters Five Forces
- 4.2. Supply/Value Chain
- 4.3. PESTEL analysis
- 4.4. Market Entropy
- 4.5. Patent/Trademark Analysis
- 5. Global Power Factor Capacitor Bank Analysis, Insights and Forecast, 2020-2032
- 5.1. Market Analysis, Insights and Forecast - by Application
- 5.1.1.
- 5.2. Market Analysis, Insights and Forecast - by Type
- 5.2.1.
- 5.3. Market Analysis, Insights and Forecast - by Region
- 5.3.1.
- 5.3.2.
- 5.3.3.
- 5.3.4.
- 5.3.5.
- 5.1. Market Analysis, Insights and Forecast - by Application
- 6. undefined Power Factor Capacitor Bank Analysis, Insights and Forecast, 2020-2032
- 6.1. Market Analysis, Insights and Forecast - by Application
- 6.1.1.
- 6.2. Market Analysis, Insights and Forecast - by Type
- 6.2.1.
- 6.1. Market Analysis, Insights and Forecast - by Application
- 7. undefined Power Factor Capacitor Bank Analysis, Insights and Forecast, 2020-2032
- 7.1. Market Analysis, Insights and Forecast - by Application
- 7.1.1.
- 7.2. Market Analysis, Insights and Forecast - by Type
- 7.2.1.
- 7.1. Market Analysis, Insights and Forecast - by Application
- 8. undefined Power Factor Capacitor Bank Analysis, Insights and Forecast, 2020-2032
- 8.1. Market Analysis, Insights and Forecast - by Application
- 8.1.1.
- 8.2. Market Analysis, Insights and Forecast - by Type
- 8.2.1.
- 8.1. Market Analysis, Insights and Forecast - by Application
- 9. undefined Power Factor Capacitor Bank Analysis, Insights and Forecast, 2020-2032
- 9.1. Market Analysis, Insights and Forecast - by Application
- 9.1.1.
- 9.2. Market Analysis, Insights and Forecast - by Type
- 9.2.1.
- 9.1. Market Analysis, Insights and Forecast - by Application
- 10. undefined Power Factor Capacitor Bank Analysis, Insights and Forecast, 2020-2032
- 10.1. Market Analysis, Insights and Forecast - by Application
- 10.1.1.
- 10.2. Market Analysis, Insights and Forecast - by Type
- 10.2.1.
- 10.1. Market Analysis, Insights and Forecast - by Application
- 11. Competitive Analysis
- 11.1. Global Market Share Analysis 2025
- 11.2. Company Profiles
- 11.2.1 ABB
- 11.2.1.1. Overview
- 11.2.1.2. Products
- 11.2.1.3. SWOT Analysis
- 11.2.1.4. Recent Developments
- 11.2.1.5. Financials (Based on Availability)
- 11.2.2 Eaton
- 11.2.2.1. Overview
- 11.2.2.2. Products
- 11.2.2.3. SWOT Analysis
- 11.2.2.4. Recent Developments
- 11.2.2.5. Financials (Based on Availability)
- 11.2.3 Comar Condensatori S.p.A
- 11.2.3.1. Overview
- 11.2.3.2. Products
- 11.2.3.3. SWOT Analysis
- 11.2.3.4. Recent Developments
- 11.2.3.5. Financials (Based on Availability)
- 11.2.4 Hitachi
- 11.2.4.1. Overview
- 11.2.4.2. Products
- 11.2.4.3. SWOT Analysis
- 11.2.4.4. Recent Developments
- 11.2.4.5. Financials (Based on Availability)
- 11.2.5 Powerside
- 11.2.5.1. Overview
- 11.2.5.2. Products
- 11.2.5.3. SWOT Analysis
- 11.2.5.4. Recent Developments
- 11.2.5.5. Financials (Based on Availability)
- 11.2.6 Siemens
- 11.2.6.1. Overview
- 11.2.6.2. Products
- 11.2.6.3. SWOT Analysis
- 11.2.6.4. Recent Developments
- 11.2.6.5. Financials (Based on Availability)
- 11.2.7 Toshiba Corporation
- 11.2.7.1. Overview
- 11.2.7.2. Products
- 11.2.7.3. SWOT Analysis
- 11.2.7.4. Recent Developments
- 11.2.7.5. Financials (Based on Availability)
- 11.2.8 Circutor
- 11.2.8.1. Overview
- 11.2.8.2. Products
- 11.2.8.3. SWOT Analysis
- 11.2.8.4. Recent Developments
- 11.2.8.5. Financials (Based on Availability)
- 11.2.9 Enerlux Power s.r.l.
- 11.2.9.1. Overview
- 11.2.9.2. Products
- 11.2.9.3. SWOT Analysis
- 11.2.9.4. Recent Developments
- 11.2.9.5. Financials (Based on Availability)
- 11.2.1 ABB
List of Figures
- Figure 1: Global Power Factor Capacitor Bank Revenue Breakdown (billion, %) by Region 2025 & 2033
- Figure 2: undefined Power Factor Capacitor Bank Revenue (billion), by Application 2025 & 2033
- Figure 3: undefined Power Factor Capacitor Bank Revenue Share (%), by Application 2025 & 2033
- Figure 4: undefined Power Factor Capacitor Bank Revenue (billion), by Type 2025 & 2033
- Figure 5: undefined Power Factor Capacitor Bank Revenue Share (%), by Type 2025 & 2033
- Figure 6: undefined Power Factor Capacitor Bank Revenue (billion), by Country 2025 & 2033
- Figure 7: undefined Power Factor Capacitor Bank Revenue Share (%), by Country 2025 & 2033
- Figure 8: undefined Power Factor Capacitor Bank Revenue (billion), by Application 2025 & 2033
- Figure 9: undefined Power Factor Capacitor Bank Revenue Share (%), by Application 2025 & 2033
- Figure 10: undefined Power Factor Capacitor Bank Revenue (billion), by Type 2025 & 2033
- Figure 11: undefined Power Factor Capacitor Bank Revenue Share (%), by Type 2025 & 2033
- Figure 12: undefined Power Factor Capacitor Bank Revenue (billion), by Country 2025 & 2033
- Figure 13: undefined Power Factor Capacitor Bank Revenue Share (%), by Country 2025 & 2033
- Figure 14: undefined Power Factor Capacitor Bank Revenue (billion), by Application 2025 & 2033
- Figure 15: undefined Power Factor Capacitor Bank Revenue Share (%), by Application 2025 & 2033
- Figure 16: undefined Power Factor Capacitor Bank Revenue (billion), by Type 2025 & 2033
- Figure 17: undefined Power Factor Capacitor Bank Revenue Share (%), by Type 2025 & 2033
- Figure 18: undefined Power Factor Capacitor Bank Revenue (billion), by Country 2025 & 2033
- Figure 19: undefined Power Factor Capacitor Bank Revenue Share (%), by Country 2025 & 2033
- Figure 20: undefined Power Factor Capacitor Bank Revenue (billion), by Application 2025 & 2033
- Figure 21: undefined Power Factor Capacitor Bank Revenue Share (%), by Application 2025 & 2033
- Figure 22: undefined Power Factor Capacitor Bank Revenue (billion), by Type 2025 & 2033
- Figure 23: undefined Power Factor Capacitor Bank Revenue Share (%), by Type 2025 & 2033
- Figure 24: undefined Power Factor Capacitor Bank Revenue (billion), by Country 2025 & 2033
- Figure 25: undefined Power Factor Capacitor Bank Revenue Share (%), by Country 2025 & 2033
- Figure 26: undefined Power Factor Capacitor Bank Revenue (billion), by Application 2025 & 2033
- Figure 27: undefined Power Factor Capacitor Bank Revenue Share (%), by Application 2025 & 2033
- Figure 28: undefined Power Factor Capacitor Bank Revenue (billion), by Type 2025 & 2033
- Figure 29: undefined Power Factor Capacitor Bank Revenue Share (%), by Type 2025 & 2033
- Figure 30: undefined Power Factor Capacitor Bank Revenue (billion), by Country 2025 & 2033
- Figure 31: undefined Power Factor Capacitor Bank Revenue Share (%), by Country 2025 & 2033
List of Tables
- Table 1: Global Power Factor Capacitor Bank Revenue billion Forecast, by Application 2020 & 2033
- Table 2: Global Power Factor Capacitor Bank Revenue billion Forecast, by Type 2020 & 2033
- Table 3: Global Power Factor Capacitor Bank Revenue billion Forecast, by Region 2020 & 2033
- Table 4: Global Power Factor Capacitor Bank Revenue billion Forecast, by Application 2020 & 2033
- Table 5: Global Power Factor Capacitor Bank Revenue billion Forecast, by Type 2020 & 2033
- Table 6: Global Power Factor Capacitor Bank Revenue billion Forecast, by Country 2020 & 2033
- Table 7: Global Power Factor Capacitor Bank Revenue billion Forecast, by Application 2020 & 2033
- Table 8: Global Power Factor Capacitor Bank Revenue billion Forecast, by Type 2020 & 2033
- Table 9: Global Power Factor Capacitor Bank Revenue billion Forecast, by Country 2020 & 2033
- Table 10: Global Power Factor Capacitor Bank Revenue billion Forecast, by Application 2020 & 2033
- Table 11: Global Power Factor Capacitor Bank Revenue billion Forecast, by Type 2020 & 2033
- Table 12: Global Power Factor Capacitor Bank Revenue billion Forecast, by Country 2020 & 2033
- Table 13: Global Power Factor Capacitor Bank Revenue billion Forecast, by Application 2020 & 2033
- Table 14: Global Power Factor Capacitor Bank Revenue billion Forecast, by Type 2020 & 2033
- Table 15: Global Power Factor Capacitor Bank Revenue billion Forecast, by Country 2020 & 2033
- Table 16: Global Power Factor Capacitor Bank Revenue billion Forecast, by Application 2020 & 2033
- Table 17: Global Power Factor Capacitor Bank Revenue billion Forecast, by Type 2020 & 2033
- Table 18: Global Power Factor Capacitor Bank Revenue billion Forecast, by Country 2020 & 2033
Frequently Asked Questions
1. What is the projected Compound Annual Growth Rate (CAGR) of the Power Factor Capacitor Bank?
The projected CAGR is approximately 4.55%.
2. Which companies are prominent players in the Power Factor Capacitor Bank?
Key companies in the market include ABB, Eaton, Comar Condensatori S.p.A, Hitachi, Powerside, Siemens, Toshiba Corporation, Circutor, Enerlux Power s.r.l..
3. What are the main segments of the Power Factor Capacitor Bank?
The market segments include Application, Type.
4. Can you provide details about the market size?
The market size is estimated to be USD 5.02 billion as of 2022.
5. What are some drivers contributing to market growth?
N/A
6. What are the notable trends driving market growth?
N/A
7. Are there any restraints impacting market growth?
N/A
8. Can you provide examples of recent developments in the market?
N/A
9. What pricing options are available for accessing the report?
Pricing options include single-user, multi-user, and enterprise licenses priced at USD 4250.00, USD 6375.00, and USD 8500.00 respectively.
10. Is the market size provided in terms of value or volume?
The market size is provided in terms of value, measured in billion.
11. Are there any specific market keywords associated with the report?
Yes, the market keyword associated with the report is "Power Factor Capacitor Bank," which aids in identifying and referencing the specific market segment covered.
12. How do I determine which pricing option suits my needs best?
The pricing options vary based on user requirements and access needs. Individual users may opt for single-user licenses, while businesses requiring broader access may choose multi-user or enterprise licenses for cost-effective access to the report.
13. Are there any additional resources or data provided in the Power Factor Capacitor Bank report?
While the report offers comprehensive insights, it's advisable to review the specific contents or supplementary materials provided to ascertain if additional resources or data are available.
14. How can I stay updated on further developments or reports in the Power Factor Capacitor Bank?
To stay informed about further developments, trends, and reports in the Power Factor Capacitor Bank, consider subscribing to industry newsletters, following relevant companies and organizations, or regularly checking reputable industry news sources and publications.
Methodology
Step 1 - Identification of Relevant Samples Size from Population Database


Step 2 - Approaches for Defining Global Market Size (Value, Volume* & Price*)

Note*: In applicable scenarios
Step 3 - Data Sources
Primary Research
- Web Analytics
- Survey Reports
- Research Institute
- Latest Research Reports
- Opinion Leaders
Secondary Research
- Annual Reports
- White Paper
- Latest Press Release
- Industry Association
- Paid Database
- Investor Presentations

Step 4 - Data Triangulation
Involves using different sources of information in order to increase the validity of a study
These sources are likely to be stakeholders in a program - participants, other researchers, program staff, other community members, and so on.
Then we put all data in single framework & apply various statistical tools to find out the dynamic on the market.
During the analysis stage, feedback from the stakeholder groups would be compared to determine areas of agreement as well as areas of divergence