

Key Insights
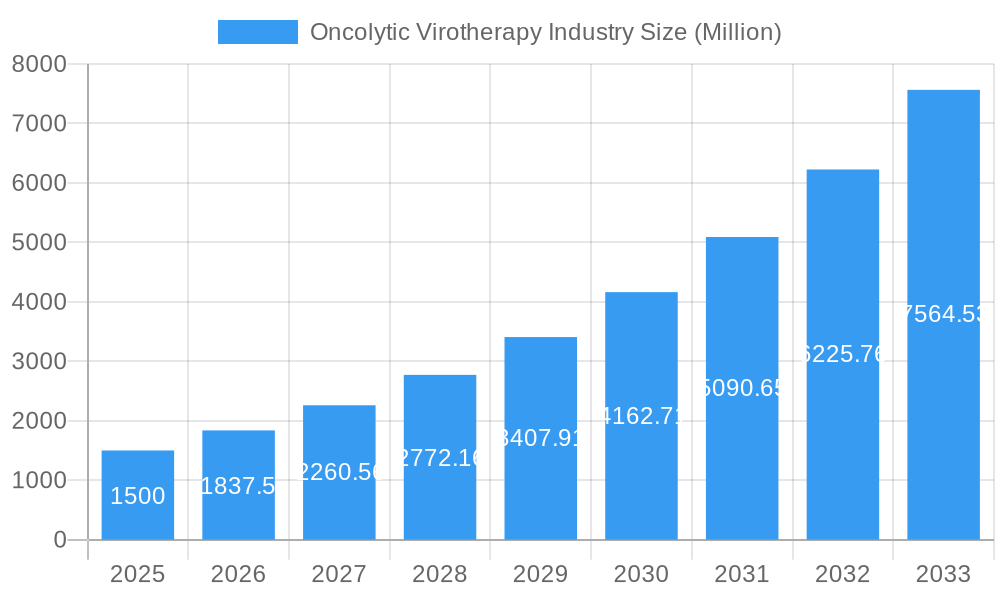
The oncolytic virotherapy market is projected to achieve significant expansion, propelled by the escalating incidence of cancer, a growing demand for advanced, targeted cancer treatments, and continuous innovation in virotherapy technologies. The market is estimated to reach 153.79 million by 2025, with a projected Compound Annual Growth Rate (CAGR) of 16.38%. Key growth drivers include the development of next-generation oncolytic viruses featuring enhanced safety and efficacy, alongside a deeper comprehension of the tumor microenvironment and its interplay with viral therapies. The increasing integration of personalized medicine further stimulates market growth, enabling the customization of oncolytic virotherapies for specific cancer types and patient profiles. Despite manufacturing and regulatory hurdles, the transformative potential of oncolytic virotherapy in cancer treatment is substantial. Augmented investment in research and development is expected to surmount these challenges and expedite market adoption.
Oncolytic Virotherapy Industry Market Size (In Million)
Segment analysis indicates that HSV-based and adenovirus-based oncolytic viruses are the leading types. Applications encompass various cancers, including melanoma, prostate, breast, ovarian, and lung cancers, underscoring the therapeutic versatility. Geographically, North America commands a substantial market share, attributed to its advanced healthcare infrastructure and intensive research and development initiatives. Europe and the Asia Pacific regions are also emerging as significant contributors to the market's growth trajectory. The competitive environment features a blend of established pharmaceutical giants and pioneering biotech enterprises, reflecting robust interest and investment in this promising therapeutic domain. Strategic alliances, mergers, and licensing agreements are anticipated as entities aim to accelerate the development and commercialization of novel oncolytic virotherapies.
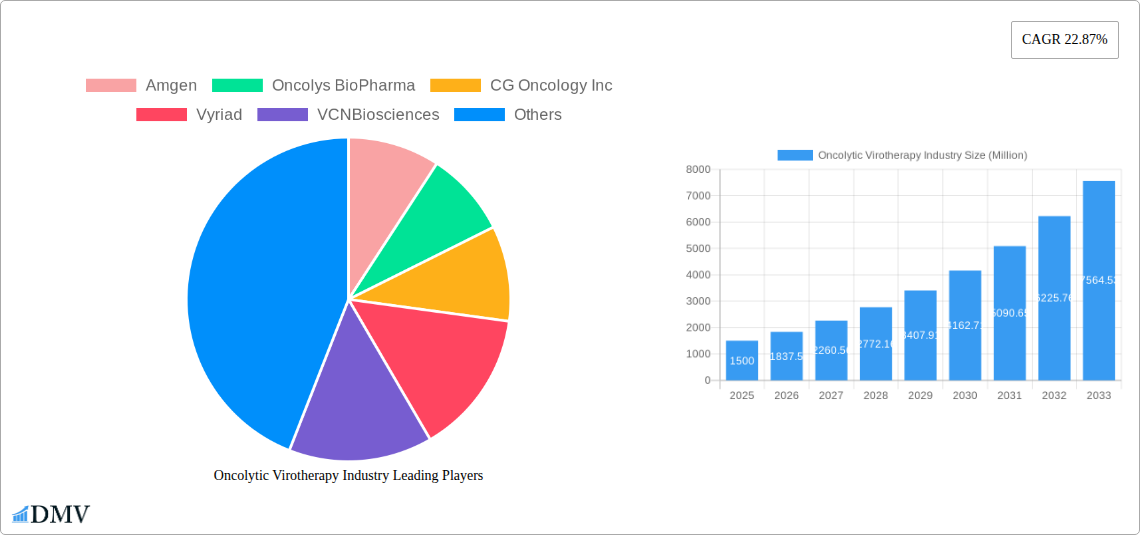
Oncolytic Virotherapy Industry Company Market Share
Oncolytic Virotherapy Industry: A Comprehensive Market Report (2019-2033)
This insightful report provides a detailed analysis of the Oncolytic Virotherapy industry, projecting robust growth from 2025 to 2033. We delve into market dynamics, competitive landscapes, technological advancements, and future opportunities, offering crucial insights for stakeholders across the value chain. The study period covers 2019-2033, with 2025 as the base and estimated year. This report is essential for investors, researchers, pharmaceutical companies, and healthcare professionals seeking a comprehensive understanding of this rapidly evolving sector. The total market size in 2025 is estimated at $XX Million, poised for significant expansion.
Oncolytic Virotherapy Industry Market Composition & Trends
This section examines the market concentration, innovative drivers, regulatory environment, substitute therapies, end-user profiles, and mergers and acquisitions (M&A) within the oncolytic virotherapy landscape. The market is currently characterized by a moderately concentrated structure, with key players like Amgen and Oncolys BioPharma holding significant market share. However, the emergence of several smaller biotech companies is increasing competition. Innovation is fueled by advancements in viral vector engineering and targeted delivery systems. The regulatory landscape varies across different regions, influencing market entry and approval processes. Substitute therapies include traditional chemotherapy and immunotherapy. End-users primarily consist of hospitals, cancer centers, and research institutions. M&A activity has been notable, with deal values exceeding $XX Million in recent years, driving consolidation and accelerating innovation.
- Market Share Distribution (2025): Amgen (XX%), Oncolys BioPharma (XX%), Others (XX%).
- M&A Deal Value (2019-2024): $XX Million.
- Key Innovation Catalysts: Improved viral vector targeting, combination therapies, personalized medicine approaches.
Oncolytic Virotherapy Industry Evolution
The oncolytic virotherapy market has experienced significant growth between 2019 and 2024, driven by increasing cancer prevalence, advancements in virotherapy technology, and a rising awareness among healthcare professionals. The market's Compound Annual Growth Rate (CAGR) during this period was approximately XX%. Technological advancements, such as the development of genetically engineered oncolytic viruses with enhanced tumor-targeting capabilities and improved safety profiles, have been instrumental in driving market growth. Furthermore, a growing understanding of the tumor microenvironment and its interaction with oncolytic viruses is facilitating the development of more effective and personalized therapies. Consumer demand is driven by a desire for less toxic and more targeted cancer treatments, creating opportunities for oncolytic virotherapies as a potential alternative or complement to existing modalities. The forecast period (2025-2033) anticipates continued growth, with a projected CAGR of XX%, driven by the factors discussed above.
Leading Regions, Countries, or Segments in Oncolytic Virotherapy Industry
North America currently holds the largest market share in the oncolytic virotherapy industry, driven by significant investments in research and development, robust regulatory frameworks supporting clinical trials, and high healthcare expenditure. However, the Asia-Pacific region is witnessing the fastest growth due to rising cancer incidence and increasing awareness of advanced therapies.
Key Drivers by Region/Segment:
- North America: High R&D spending, favorable regulatory environment, early adoption of innovative therapies.
- Europe: Growing research collaborations and clinical trial activities.
- Asia-Pacific: Rapidly expanding healthcare infrastructure, increasing cancer prevalence.
Dominant Segments:
- By Type: Adenoviruses-based Oncolytic Viruses currently hold the largest market share, due to their established safety profiles and versatile engineering capabilities.
- By Application: Melanoma and Prostate Cancer currently represent the largest application segments, owing to significant clinical success and ongoing research efforts.
Oncolytic Virotherapy Industry Product Innovations
Recent innovations in oncolytic virotherapy focus on enhancing virus selectivity, improving delivery methods, and optimizing therapeutic efficacy. Novel approaches include incorporating immune-stimulatory genes to enhance anti-tumor immune responses and developing combination therapies that leverage the synergistic effects of oncolytic viruses with other cancer treatments. Improvements in viral vector engineering, such as the use of conditionally replicating adenoviruses, have also led to improved safety profiles and targeted tumor destruction. These advancements are significantly improving the clinical outcomes associated with oncolytic virotherapy and expanding the potential applications of this approach in various cancer types.
Propelling Factors for Oncolytic Virotherapy Industry Growth
The oncolytic virotherapy market's growth is primarily fueled by several key factors. Firstly, the rising prevalence of various cancers globally is creating a substantial demand for effective treatment options. Secondly, technological advancements like genetic engineering have enhanced the efficacy and safety of oncolytic viruses, significantly improving treatment outcomes. Thirdly, favorable regulatory support through accelerated approval pathways is facilitating faster market entry for innovative therapies. Finally, increasing funding for research and development of oncolytic virotherapies is further contributing to the growth trajectory of this sector.
Obstacles in the Oncolytic Virotherapy Industry Market
Several challenges hinder the widespread adoption of oncolytic virotherapy. Regulatory hurdles, including complex approval processes and stringent safety requirements, can delay market entry and limit accessibility. Furthermore, supply chain disruptions can impact the availability of critical reagents and manufacturing capacity. Competitive pressures from other cancer treatments, such as chemotherapy and immunotherapy, also limit market penetration. The high cost of development and manufacturing, along with concerns about potential side effects, pose additional challenges to broader market adoption. These limitations could significantly affect market growth if not adequately addressed.
Future Opportunities in Oncolytic Virotherapy Industry
Emerging opportunities in the oncolytic virotherapy market include the development of novel viral vectors with improved targeting capabilities and reduced side effects. This also includes exploring new combination therapies, integrating oncolytic viruses with other cancer treatments like immunotherapy and targeted therapies. Expanding into new therapeutic areas beyond the currently approved indications offers significant growth potential. Additionally, leveraging advancements in personalized medicine and biomarker identification can further improve the effectiveness and safety of oncolytic virotherapies. Finally, expanding into emerging markets, particularly in developing countries with high cancer burdens, could substantially drive market growth.
Major Players in the Oncolytic Virotherapy Industry Ecosystem
- Amgen
- Oncolys BioPharma
- CG Oncology Inc
- Vyriad
- VCN Biosciences
- Transgene SA
- DNAtrix
- Lokon Pharma
- Replimune Group Inc
- TILT Biotherapeutics
- Targovax
- Sorrento Therapeutics
Key Developments in Oncolytic Virotherapy Industry Industry
- 2023-06: Replimune Group Inc. announces positive results from Phase 1 trial of RP1.
- 2022-11: Amgen acquires a smaller biotech company specializing in oncolytic viruses for $XX Million.
- 2021-09: Oncolys BioPharma receives FDA approval for its lead oncolytic virotherapy product.
- 2020-03: Significant funding secured by several early-stage biotech companies in the sector.
Strategic Oncolytic Virotherapy Industry Market Forecast
The oncolytic virotherapy market is poised for substantial growth during the forecast period (2025-2033). This growth will be driven by continuous innovation in viral vector engineering, the development of more effective combination therapies, and increasing awareness of the potential of oncolytic viruses as a powerful tool in cancer treatment. Furthermore, the expansion into new markets and therapeutic areas, coupled with favorable regulatory developments, will propel the market towards significant expansion, exceeding $XX Million by 2033. The market is expected to demonstrate considerable growth across all segments due to the mentioned catalysts and growing investments in this emerging therapeutic area.
Oncolytic Virotherapy Industry Segmentation
-
1. Types
- 1.1. HSV-based Oncolytic Viruses
- 1.2. Adenoviruses-based Oncolytic Viruses
- 1.3. Others
-
2. Applications
- 2.1. Melanoma
- 2.2. Prostate Cancer
- 2.3. Breast Cancer
- 2.4. Ovarian Cancer
- 2.5. Lung Cancer
- 2.6. Others
Oncolytic Virotherapy Industry Segmentation By Geography
- 1. North America
- 2. Europe
- 3. Asia Pacific
- 4. Middle East and Africa
- 5. South America
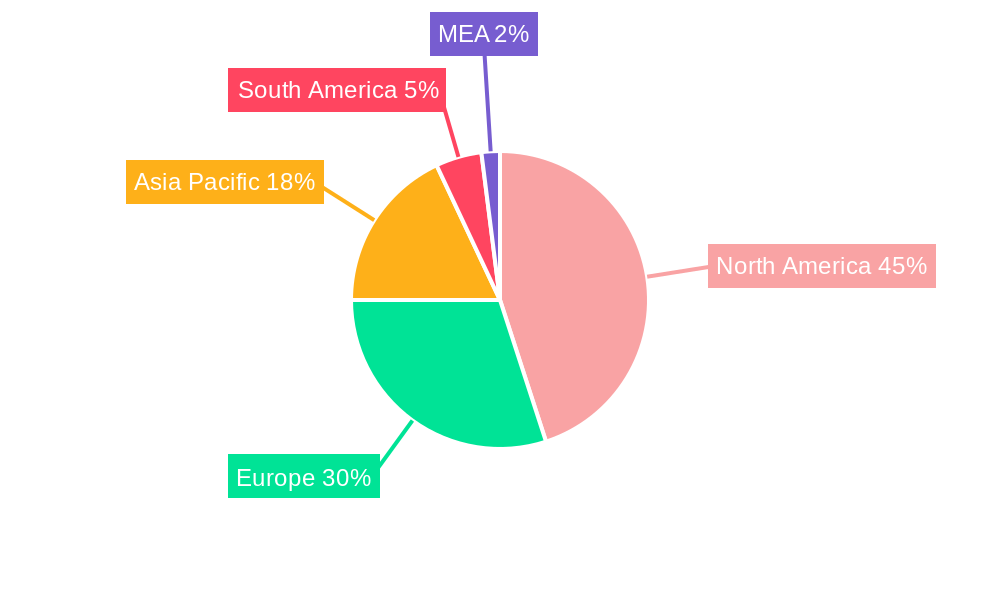
Oncolytic Virotherapy Industry Regional Market Share
Geographic Coverage of Oncolytic Virotherapy Industry
Oncolytic Virotherapy Industry REPORT HIGHLIGHTS
| Aspects | Details |
|---|---|
| Study Period | 2020-2034 |
| Base Year | 2025 |
| Estimated Year | 2026 |
| Forecast Period | 2026-2034 |
| Historical Period | 2020-2025 |
| Growth Rate | CAGR of 16.38% from 2020-2034 |
| Segmentation |
|
Table of Contents
- 1. Introduction
- 1.1. Research Scope
- 1.2. Market Segmentation
- 1.3. Research Objective
- 1.4. Definitions and Assumptions
- 2. Executive Summary
- 2.1. Market Snapshot
- 3. Market Dynamics
- 3.1. Market Drivers
- 3.2. Market Restrains
- 3.3. Market Trends
- 3.4. Market Opportunities
- 4. Market Factor Analysis
- 4.1. Porters Five Forces
- 4.1.1. Bargaining Power of Suppliers
- 4.1.2. Bargaining Power of Buyers
- 4.1.3. Threat of New Entrants
- 4.1.4. Threat of Substitutes
- 4.1.5. Competitive Rivalry
- 4.2. PESTEL analysis
- 4.3. BCG Analysis
- 4.3.1. Stars (High Growth, High Market Share)
- 4.3.2. Cash Cows (Low Growth, High Market Share)
- 4.3.3. Question Mark (High Growth, Low Market Share)
- 4.3.4. Dogs (Low Growth, Low Market Share)
- 4.4. Ansoff Matrix Analysis
- 4.5. Supply Chain Analysis
- 4.6. Regulatory Landscape
- 4.7. Current Market Potential and Opportunity Assessment (TAM–SAM–SOM Framework)
- 4.8. DMV Analyst Note
- 4.1. Porters Five Forces
- 5. Market Analysis, Insights and Forecast 2021-2033
- 5.1. Market Analysis, Insights and Forecast - by Types
- 5.1.1. HSV-based Oncolytic Viruses
- 5.1.2. Adenoviruses-based Oncolytic Viruses
- 5.1.3. Others
- 5.2. Market Analysis, Insights and Forecast - by Applications
- 5.2.1. Melanoma
- 5.2.2. Prostate Cancer
- 5.2.3. Breast Cancer
- 5.2.4. Ovarian Cancer
- 5.2.5. Lung Cancer
- 5.2.6. Others
- 5.3. Market Analysis, Insights and Forecast - by Region
- 5.3.1. North America
- 5.3.2. Europe
- 5.3.3. Asia Pacific
- 5.3.4. Middle East and Africa
- 5.3.5. South America
- 5.1. Market Analysis, Insights and Forecast - by Types
- 6. Global Oncolytic Virotherapy Industry Analysis, Insights and Forecast, 2021-2033
- 6.1. Market Analysis, Insights and Forecast - by Types
- 6.1.1. HSV-based Oncolytic Viruses
- 6.1.2. Adenoviruses-based Oncolytic Viruses
- 6.1.3. Others
- 6.2. Market Analysis, Insights and Forecast - by Applications
- 6.2.1. Melanoma
- 6.2.2. Prostate Cancer
- 6.2.3. Breast Cancer
- 6.2.4. Ovarian Cancer
- 6.2.5. Lung Cancer
- 6.2.6. Others
- 6.1. Market Analysis, Insights and Forecast - by Types
- 7. North America Oncolytic Virotherapy Industry Analysis, Insights and Forecast, 2020-2032
- 7.1. Market Analysis, Insights and Forecast - by Types
- 7.1.1. HSV-based Oncolytic Viruses
- 7.1.2. Adenoviruses-based Oncolytic Viruses
- 7.1.3. Others
- 7.2. Market Analysis, Insights and Forecast - by Applications
- 7.2.1. Melanoma
- 7.2.2. Prostate Cancer
- 7.2.3. Breast Cancer
- 7.2.4. Ovarian Cancer
- 7.2.5. Lung Cancer
- 7.2.6. Others
- 7.1. Market Analysis, Insights and Forecast - by Types
- 8. Europe Oncolytic Virotherapy Industry Analysis, Insights and Forecast, 2020-2032
- 8.1. Market Analysis, Insights and Forecast - by Types
- 8.1.1. HSV-based Oncolytic Viruses
- 8.1.2. Adenoviruses-based Oncolytic Viruses
- 8.1.3. Others
- 8.2. Market Analysis, Insights and Forecast - by Applications
- 8.2.1. Melanoma
- 8.2.2. Prostate Cancer
- 8.2.3. Breast Cancer
- 8.2.4. Ovarian Cancer
- 8.2.5. Lung Cancer
- 8.2.6. Others
- 8.1. Market Analysis, Insights and Forecast - by Types
- 9. Asia Pacific Oncolytic Virotherapy Industry Analysis, Insights and Forecast, 2020-2032
- 9.1. Market Analysis, Insights and Forecast - by Types
- 9.1.1. HSV-based Oncolytic Viruses
- 9.1.2. Adenoviruses-based Oncolytic Viruses
- 9.1.3. Others
- 9.2. Market Analysis, Insights and Forecast - by Applications
- 9.2.1. Melanoma
- 9.2.2. Prostate Cancer
- 9.2.3. Breast Cancer
- 9.2.4. Ovarian Cancer
- 9.2.5. Lung Cancer
- 9.2.6. Others
- 9.1. Market Analysis, Insights and Forecast - by Types
- 10. Middle East and Africa Oncolytic Virotherapy Industry Analysis, Insights and Forecast, 2020-2032
- 10.1. Market Analysis, Insights and Forecast - by Types
- 10.1.1. HSV-based Oncolytic Viruses
- 10.1.2. Adenoviruses-based Oncolytic Viruses
- 10.1.3. Others
- 10.2. Market Analysis, Insights and Forecast - by Applications
- 10.2.1. Melanoma
- 10.2.2. Prostate Cancer
- 10.2.3. Breast Cancer
- 10.2.4. Ovarian Cancer
- 10.2.5. Lung Cancer
- 10.2.6. Others
- 10.1. Market Analysis, Insights and Forecast - by Types
- 11. South America Oncolytic Virotherapy Industry Analysis, Insights and Forecast, 2020-2032
- 11.1. Market Analysis, Insights and Forecast - by Types
- 11.1.1. HSV-based Oncolytic Viruses
- 11.1.2. Adenoviruses-based Oncolytic Viruses
- 11.1.3. Others
- 11.2. Market Analysis, Insights and Forecast - by Applications
- 11.2.1. Melanoma
- 11.2.2. Prostate Cancer
- 11.2.3. Breast Cancer
- 11.2.4. Ovarian Cancer
- 11.2.5. Lung Cancer
- 11.2.6. Others
- 11.1. Market Analysis, Insights and Forecast - by Types
- 12. Competitive Analysis
- 12.1. Company Profiles
- 12.1.1 Amgen
- 12.1.1.1. Company Overview
- 12.1.1.2. Products
- 12.1.1.3. Company Financials
- 12.1.1.4. SWOT Analysis
- 12.1.2 Oncolys BioPharma
- 12.1.2.1. Company Overview
- 12.1.2.2. Products
- 12.1.2.3. Company Financials
- 12.1.2.4. SWOT Analysis
- 12.1.3 CG Oncology Inc
- 12.1.3.1. Company Overview
- 12.1.3.2. Products
- 12.1.3.3. Company Financials
- 12.1.3.4. SWOT Analysis
- 12.1.4 Vyriad
- 12.1.4.1. Company Overview
- 12.1.4.2. Products
- 12.1.4.3. Company Financials
- 12.1.4.4. SWOT Analysis
- 12.1.5 VCNBiosciences
- 12.1.5.1. Company Overview
- 12.1.5.2. Products
- 12.1.5.3. Company Financials
- 12.1.5.4. SWOT Analysis
- 12.1.6 Transgene SA
- 12.1.6.1. Company Overview
- 12.1.6.2. Products
- 12.1.6.3. Company Financials
- 12.1.6.4. SWOT Analysis
- 12.1.7 DNAtrix
- 12.1.7.1. Company Overview
- 12.1.7.2. Products
- 12.1.7.3. Company Financials
- 12.1.7.4. SWOT Analysis
- 12.1.8 Lokon Pharma
- 12.1.8.1. Company Overview
- 12.1.8.2. Products
- 12.1.8.3. Company Financials
- 12.1.8.4. SWOT Analysis
- 12.1.9 Replimune Group Inc
- 12.1.9.1. Company Overview
- 12.1.9.2. Products
- 12.1.9.3. Company Financials
- 12.1.9.4. SWOT Analysis
- 12.1.10 TILT Biotherapeutics
- 12.1.10.1. Company Overview
- 12.1.10.2. Products
- 12.1.10.3. Company Financials
- 12.1.10.4. SWOT Analysis
- 12.1.11 Targovax
- 12.1.11.1. Company Overview
- 12.1.11.2. Products
- 12.1.11.3. Company Financials
- 12.1.11.4. SWOT Analysis
- 12.1.12 Sorrento Therapeutics
- 12.1.12.1. Company Overview
- 12.1.12.2. Products
- 12.1.12.3. Company Financials
- 12.1.12.4. SWOT Analysis
- 12.1.1 Amgen
- 12.2. Market Entropy
- 12.2.1 Company's Key Areas Served
- 12.2.2 Recent Developments
- 12.3. Company Market Share Analysis 2025
- 12.3.1 Top 5 Companies Market Share Analysis
- 12.3.2 Top 3 Companies Market Share Analysis
- 12.4. List of Potential Customers
- 13. Research Methodology
List of Figures
- Figure 1: Global Oncolytic Virotherapy Industry Revenue Breakdown (million, %) by Region 2025 & 2033
- Figure 2: Global Oncolytic Virotherapy Industry Volume Breakdown (K Unit, %) by Region 2025 & 2033
- Figure 3: North America Oncolytic Virotherapy Industry Revenue (million), by Types 2025 & 2033
- Figure 4: North America Oncolytic Virotherapy Industry Volume (K Unit), by Types 2025 & 2033
- Figure 5: North America Oncolytic Virotherapy Industry Revenue Share (%), by Types 2025 & 2033
- Figure 6: North America Oncolytic Virotherapy Industry Volume Share (%), by Types 2025 & 2033
- Figure 7: North America Oncolytic Virotherapy Industry Revenue (million), by Applications 2025 & 2033
- Figure 8: North America Oncolytic Virotherapy Industry Volume (K Unit), by Applications 2025 & 2033
- Figure 9: North America Oncolytic Virotherapy Industry Revenue Share (%), by Applications 2025 & 2033
- Figure 10: North America Oncolytic Virotherapy Industry Volume Share (%), by Applications 2025 & 2033
- Figure 11: North America Oncolytic Virotherapy Industry Revenue (million), by Country 2025 & 2033
- Figure 12: North America Oncolytic Virotherapy Industry Volume (K Unit), by Country 2025 & 2033
- Figure 13: North America Oncolytic Virotherapy Industry Revenue Share (%), by Country 2025 & 2033
- Figure 14: North America Oncolytic Virotherapy Industry Volume Share (%), by Country 2025 & 2033
- Figure 15: Europe Oncolytic Virotherapy Industry Revenue (million), by Types 2025 & 2033
- Figure 16: Europe Oncolytic Virotherapy Industry Volume (K Unit), by Types 2025 & 2033
- Figure 17: Europe Oncolytic Virotherapy Industry Revenue Share (%), by Types 2025 & 2033
- Figure 18: Europe Oncolytic Virotherapy Industry Volume Share (%), by Types 2025 & 2033
- Figure 19: Europe Oncolytic Virotherapy Industry Revenue (million), by Applications 2025 & 2033
- Figure 20: Europe Oncolytic Virotherapy Industry Volume (K Unit), by Applications 2025 & 2033
- Figure 21: Europe Oncolytic Virotherapy Industry Revenue Share (%), by Applications 2025 & 2033
- Figure 22: Europe Oncolytic Virotherapy Industry Volume Share (%), by Applications 2025 & 2033
- Figure 23: Europe Oncolytic Virotherapy Industry Revenue (million), by Country 2025 & 2033
- Figure 24: Europe Oncolytic Virotherapy Industry Volume (K Unit), by Country 2025 & 2033
- Figure 25: Europe Oncolytic Virotherapy Industry Revenue Share (%), by Country 2025 & 2033
- Figure 26: Europe Oncolytic Virotherapy Industry Volume Share (%), by Country 2025 & 2033
- Figure 27: Asia Pacific Oncolytic Virotherapy Industry Revenue (million), by Types 2025 & 2033
- Figure 28: Asia Pacific Oncolytic Virotherapy Industry Volume (K Unit), by Types 2025 & 2033
- Figure 29: Asia Pacific Oncolytic Virotherapy Industry Revenue Share (%), by Types 2025 & 2033
- Figure 30: Asia Pacific Oncolytic Virotherapy Industry Volume Share (%), by Types 2025 & 2033
- Figure 31: Asia Pacific Oncolytic Virotherapy Industry Revenue (million), by Applications 2025 & 2033
- Figure 32: Asia Pacific Oncolytic Virotherapy Industry Volume (K Unit), by Applications 2025 & 2033
- Figure 33: Asia Pacific Oncolytic Virotherapy Industry Revenue Share (%), by Applications 2025 & 2033
- Figure 34: Asia Pacific Oncolytic Virotherapy Industry Volume Share (%), by Applications 2025 & 2033
- Figure 35: Asia Pacific Oncolytic Virotherapy Industry Revenue (million), by Country 2025 & 2033
- Figure 36: Asia Pacific Oncolytic Virotherapy Industry Volume (K Unit), by Country 2025 & 2033
- Figure 37: Asia Pacific Oncolytic Virotherapy Industry Revenue Share (%), by Country 2025 & 2033
- Figure 38: Asia Pacific Oncolytic Virotherapy Industry Volume Share (%), by Country 2025 & 2033
- Figure 39: Middle East and Africa Oncolytic Virotherapy Industry Revenue (million), by Types 2025 & 2033
- Figure 40: Middle East and Africa Oncolytic Virotherapy Industry Volume (K Unit), by Types 2025 & 2033
- Figure 41: Middle East and Africa Oncolytic Virotherapy Industry Revenue Share (%), by Types 2025 & 2033
- Figure 42: Middle East and Africa Oncolytic Virotherapy Industry Volume Share (%), by Types 2025 & 2033
- Figure 43: Middle East and Africa Oncolytic Virotherapy Industry Revenue (million), by Applications 2025 & 2033
- Figure 44: Middle East and Africa Oncolytic Virotherapy Industry Volume (K Unit), by Applications 2025 & 2033
- Figure 45: Middle East and Africa Oncolytic Virotherapy Industry Revenue Share (%), by Applications 2025 & 2033
- Figure 46: Middle East and Africa Oncolytic Virotherapy Industry Volume Share (%), by Applications 2025 & 2033
- Figure 47: Middle East and Africa Oncolytic Virotherapy Industry Revenue (million), by Country 2025 & 2033
- Figure 48: Middle East and Africa Oncolytic Virotherapy Industry Volume (K Unit), by Country 2025 & 2033
- Figure 49: Middle East and Africa Oncolytic Virotherapy Industry Revenue Share (%), by Country 2025 & 2033
- Figure 50: Middle East and Africa Oncolytic Virotherapy Industry Volume Share (%), by Country 2025 & 2033
- Figure 51: South America Oncolytic Virotherapy Industry Revenue (million), by Types 2025 & 2033
- Figure 52: South America Oncolytic Virotherapy Industry Volume (K Unit), by Types 2025 & 2033
- Figure 53: South America Oncolytic Virotherapy Industry Revenue Share (%), by Types 2025 & 2033
- Figure 54: South America Oncolytic Virotherapy Industry Volume Share (%), by Types 2025 & 2033
- Figure 55: South America Oncolytic Virotherapy Industry Revenue (million), by Applications 2025 & 2033
- Figure 56: South America Oncolytic Virotherapy Industry Volume (K Unit), by Applications 2025 & 2033
- Figure 57: South America Oncolytic Virotherapy Industry Revenue Share (%), by Applications 2025 & 2033
- Figure 58: South America Oncolytic Virotherapy Industry Volume Share (%), by Applications 2025 & 2033
- Figure 59: South America Oncolytic Virotherapy Industry Revenue (million), by Country 2025 & 2033
- Figure 60: South America Oncolytic Virotherapy Industry Volume (K Unit), by Country 2025 & 2033
- Figure 61: South America Oncolytic Virotherapy Industry Revenue Share (%), by Country 2025 & 2033
- Figure 62: South America Oncolytic Virotherapy Industry Volume Share (%), by Country 2025 & 2033
List of Tables
- Table 1: Global Oncolytic Virotherapy Industry Revenue million Forecast, by Types 2020 & 2033
- Table 2: Global Oncolytic Virotherapy Industry Volume K Unit Forecast, by Types 2020 & 2033
- Table 3: Global Oncolytic Virotherapy Industry Revenue million Forecast, by Applications 2020 & 2033
- Table 4: Global Oncolytic Virotherapy Industry Volume K Unit Forecast, by Applications 2020 & 2033
- Table 5: Global Oncolytic Virotherapy Industry Revenue million Forecast, by Region 2020 & 2033
- Table 6: Global Oncolytic Virotherapy Industry Volume K Unit Forecast, by Region 2020 & 2033
- Table 7: Global Oncolytic Virotherapy Industry Revenue million Forecast, by Types 2020 & 2033
- Table 8: Global Oncolytic Virotherapy Industry Volume K Unit Forecast, by Types 2020 & 2033
- Table 9: Global Oncolytic Virotherapy Industry Revenue million Forecast, by Applications 2020 & 2033
- Table 10: Global Oncolytic Virotherapy Industry Volume K Unit Forecast, by Applications 2020 & 2033
- Table 11: Global Oncolytic Virotherapy Industry Revenue million Forecast, by Country 2020 & 2033
- Table 12: Global Oncolytic Virotherapy Industry Volume K Unit Forecast, by Country 2020 & 2033
- Table 13: Global Oncolytic Virotherapy Industry Revenue million Forecast, by Types 2020 & 2033
- Table 14: Global Oncolytic Virotherapy Industry Volume K Unit Forecast, by Types 2020 & 2033
- Table 15: Global Oncolytic Virotherapy Industry Revenue million Forecast, by Applications 2020 & 2033
- Table 16: Global Oncolytic Virotherapy Industry Volume K Unit Forecast, by Applications 2020 & 2033
- Table 17: Global Oncolytic Virotherapy Industry Revenue million Forecast, by Country 2020 & 2033
- Table 18: Global Oncolytic Virotherapy Industry Volume K Unit Forecast, by Country 2020 & 2033
- Table 19: Global Oncolytic Virotherapy Industry Revenue million Forecast, by Types 2020 & 2033
- Table 20: Global Oncolytic Virotherapy Industry Volume K Unit Forecast, by Types 2020 & 2033
- Table 21: Global Oncolytic Virotherapy Industry Revenue million Forecast, by Applications 2020 & 2033
- Table 22: Global Oncolytic Virotherapy Industry Volume K Unit Forecast, by Applications 2020 & 2033
- Table 23: Global Oncolytic Virotherapy Industry Revenue million Forecast, by Country 2020 & 2033
- Table 24: Global Oncolytic Virotherapy Industry Volume K Unit Forecast, by Country 2020 & 2033
- Table 25: Global Oncolytic Virotherapy Industry Revenue million Forecast, by Types 2020 & 2033
- Table 26: Global Oncolytic Virotherapy Industry Volume K Unit Forecast, by Types 2020 & 2033
- Table 27: Global Oncolytic Virotherapy Industry Revenue million Forecast, by Applications 2020 & 2033
- Table 28: Global Oncolytic Virotherapy Industry Volume K Unit Forecast, by Applications 2020 & 2033
- Table 29: Global Oncolytic Virotherapy Industry Revenue million Forecast, by Country 2020 & 2033
- Table 30: Global Oncolytic Virotherapy Industry Volume K Unit Forecast, by Country 2020 & 2033
- Table 31: Global Oncolytic Virotherapy Industry Revenue million Forecast, by Types 2020 & 2033
- Table 32: Global Oncolytic Virotherapy Industry Volume K Unit Forecast, by Types 2020 & 2033
- Table 33: Global Oncolytic Virotherapy Industry Revenue million Forecast, by Applications 2020 & 2033
- Table 34: Global Oncolytic Virotherapy Industry Volume K Unit Forecast, by Applications 2020 & 2033
- Table 35: Global Oncolytic Virotherapy Industry Revenue million Forecast, by Country 2020 & 2033
- Table 36: Global Oncolytic Virotherapy Industry Volume K Unit Forecast, by Country 2020 & 2033
Frequently Asked Questions
1. What is the projected Compound Annual Growth Rate (CAGR) of the Oncolytic Virotherapy Industry?
The projected CAGR is approximately 16.38%.
2. Which companies are prominent players in the Oncolytic Virotherapy Industry?
Key companies in the market include Amgen, Oncolys BioPharma, CG Oncology Inc, Vyriad, VCNBiosciences, Transgene SA, DNAtrix, Lokon Pharma, Replimune Group Inc, TILT Biotherapeutics, Targovax, Sorrento Therapeutics.
3. What are the main segments of the Oncolytic Virotherapy Industry?
The market segments include Types, Applications.
4. Can you provide details about the market size?
The market size is estimated to be USD 153.79 million as of 2022.
5. What are some drivers contributing to market growth?
Rising incidences of cancer and growing cases of Genetic diseases; Increasing investment in Research and development.
6. What are the notable trends driving market growth?
Adenovirus-based Oncolytic Viruses Segment Dominates the Market.
7. Are there any restraints impacting market growth?
Stringent Regulatory Standards; High Cost and Risk associate with the treatment.
8. Can you provide examples of recent developments in the market?
N/A
9. What pricing options are available for accessing the report?
Pricing options include single-user, multi-user, and enterprise licenses priced at USD 4750, USD 5250, and USD 8750 respectively.
10. Is the market size provided in terms of value or volume?
The market size is provided in terms of value, measured in million and volume, measured in K Unit.
11. Are there any specific market keywords associated with the report?
Yes, the market keyword associated with the report is "Oncolytic Virotherapy Industry," which aids in identifying and referencing the specific market segment covered.
12. How do I determine which pricing option suits my needs best?
The pricing options vary based on user requirements and access needs. Individual users may opt for single-user licenses, while businesses requiring broader access may choose multi-user or enterprise licenses for cost-effective access to the report.
13. Are there any additional resources or data provided in the Oncolytic Virotherapy Industry report?
While the report offers comprehensive insights, it's advisable to review the specific contents or supplementary materials provided to ascertain if additional resources or data are available.
14. How can I stay updated on further developments or reports in the Oncolytic Virotherapy Industry?
To stay informed about further developments, trends, and reports in the Oncolytic Virotherapy Industry, consider subscribing to industry newsletters, following relevant companies and organizations, or regularly checking reputable industry news sources and publications.
Methodology
Step 1 - Identification of Relevant Samples Size from Population Database


Step 2 - Approaches for Defining Global Market Size (Value, Volume* & Price*)

Note*: In applicable scenarios
Step 3 - Data Sources
Primary Research
- Web Analytics
- Survey Reports
- Research Institute
- Latest Research Reports
- Opinion Leaders
Secondary Research
- Annual Reports
- White Paper
- Latest Press Release
- Industry Association
- Paid Database
- Investor Presentations

Step 4 - Data Triangulation
Involves using different sources of information in order to increase the validity of a study
These sources are likely to be stakeholders in a program - participants, other researchers, program staff, other community members, and so on.
Then we put all data in single framework & apply various statistical tools to find out the dynamic on the market.
During the analysis stage, feedback from the stakeholder groups would be compared to determine areas of agreement as well as areas of divergence