

Key Insights
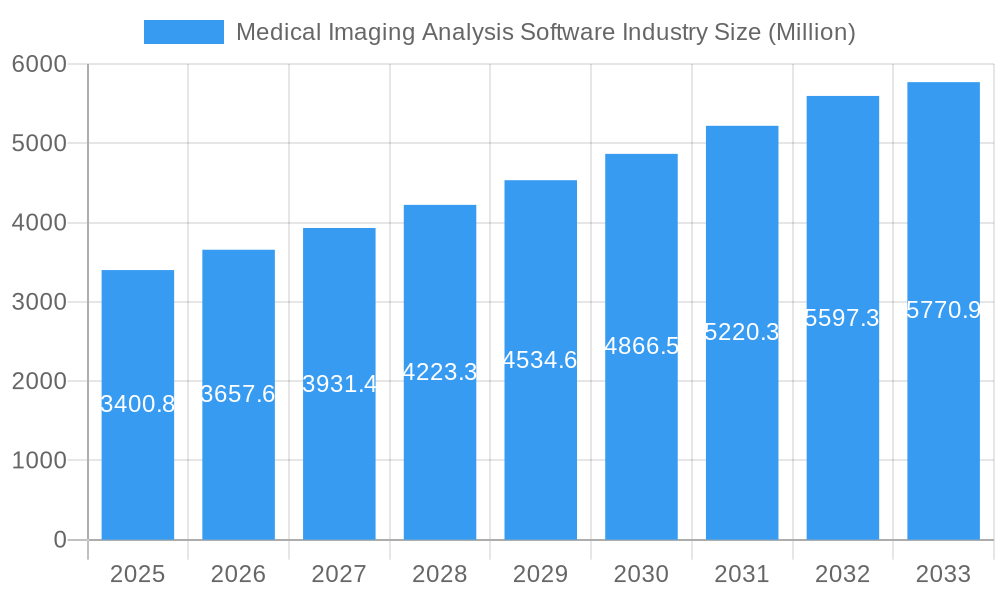
The Medical Imaging Analysis Software market is projected for significant expansion. The market size is estimated to reach USD 5,770.9 million by 2033, exhibiting a Compound Annual Growth Rate (CAGR) of 7.60% from its base year value of USD 3,400.8 million in 2025. Key growth drivers include the increasing demand for advanced diagnostic tools, the rising prevalence of chronic diseases, and continuous technological advancements in imaging modalities and AI-driven analysis. The adoption of integrated software solutions in healthcare facilities enhances workflow efficiency and diagnostic accuracy. The integration of Artificial Intelligence (AI) and Machine Learning (ML) for automated image interpretation and quantitative analysis is revolutionizing disease detection, leading to earlier and more precise diagnoses. Increased healthcare expenditure and growing awareness of advanced imaging analysis benefits further support market growth.
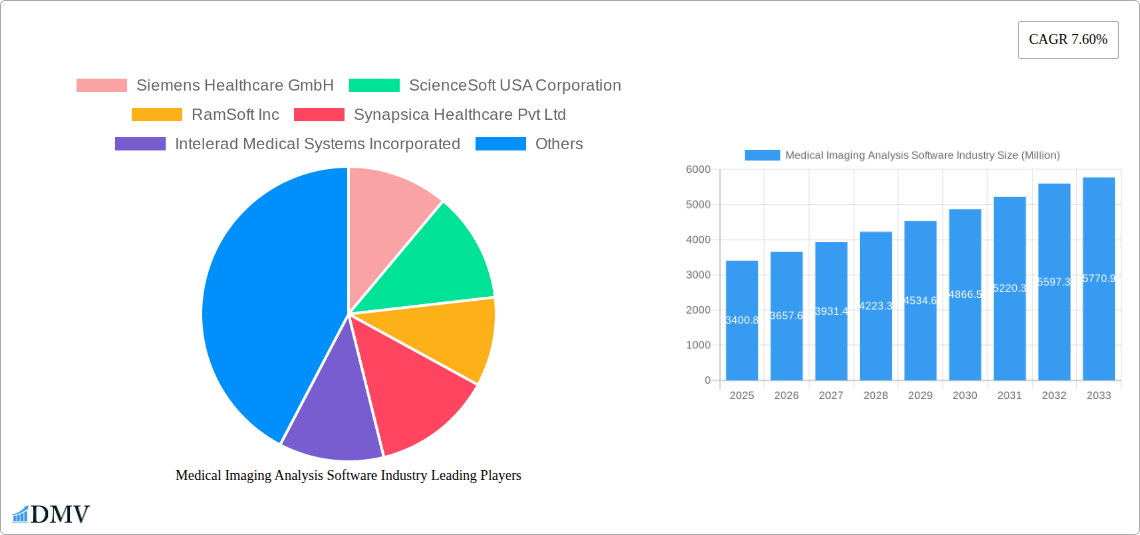
Medical Imaging Analysis Software Industry Market Size (In Billion)
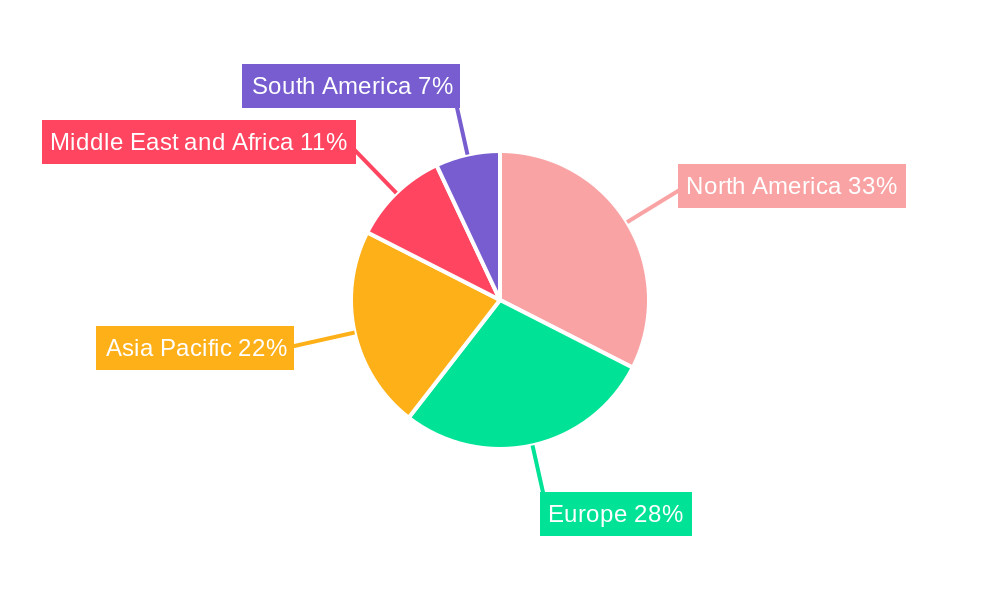
The Medical Imaging Analysis Software market is influenced by several trends, including the development of 4D imaging technologies and the increasing use of cloud-based solutions for data accessibility and collaboration. The adoption of specialized software for specific image types (3D, 4D) and modalities (MRI, CT) is driving market segmentation and growth. Potential restraints include the high cost of software implementation, data security concerns, and the need for specialized training. North America and Europe currently lead the market due to developed healthcare infrastructures and high technology adoption. The Asia Pacific region is expected to experience the fastest growth, driven by increasing healthcare investments, a large patient population, and the expansion of diagnostic imaging services in emerging economies.
Medical Imaging Analysis Software Industry Company Market Share
Medical Imaging Analysis Software Industry Market Composition & Trends
The medical imaging analysis software market is characterized by a dynamic blend of established giants and agile innovators, driving intense competition and a constant influx of new technologies. Market concentration is moderate, with leading players like Siemens Healthcare GmbH, General Electric Company (GE Healthcare), and Koninklijke Philips NV holding significant shares, alongside specialized providers such as RamSoft Inc. and Intelerad Medical Systems Incorporated. Innovation is a key catalyst, fueled by advancements in Artificial Intelligence (AI), deep learning (DL), and cloud computing, enabling more accurate diagnoses and efficient workflows. The regulatory landscape, governed by bodies like the FDA and EMA, presents a crucial, yet sometimes challenging, framework for product approvals and market entry. Substitute products, while limited in direct comparison, can include manual interpretation by radiologists or less advanced analytical tools. End-user profiles are diverse, encompassing large hospitals, specialized diagnostic centers, and forward-thinking research institutions, each with distinct needs for integrated software and standalone software solutions. Merger and acquisition (M&A) activities are prevalent, with deal values potentially reaching hundreds of millions to billions of dollars, as companies seek to expand their product portfolios, geographical reach, and technological capabilities. For instance, the acquisition of Nordisk Rontgen Teknik by Canon Medical Systems signifies strategic consolidation within the X-ray imaging segment. The market is projected to witness substantial growth, driven by increasing healthcare expenditure and the rising prevalence of chronic diseases requiring advanced diagnostic imaging. The average M&A deal value in this sector is estimated to be in the range of $50 Million to $500 Million, reflecting the strategic importance of these acquisitions.
Medical Imaging Analysis Software Industry Industry Evolution
The medical imaging analysis software industry has undergone a remarkable transformation, evolving from rudimentary digital archiving to sophisticated AI-driven platforms that are redefining diagnostic capabilities. Over the study period of 2019–2033, the market has witnessed consistent and robust growth, propelled by a confluence of technological breakthroughs, increasing healthcare infrastructure development, and a growing awareness of the benefits of early and accurate disease detection. The base year of 2025 stands as a pivotal point, with the market exhibiting a compound annual growth rate (CAGR) of approximately 12-15% during the forecast period of 2025–2033. This impressive trajectory is a testament to the expanding applications of medical imaging across various modalities, including Tomography, Ultrasound Imaging, Radiographic Imaging, X-ray Imaging, and Magnetic Resonance Imaging (MRI).
Technological advancements have been the primary engine of this evolution. The integration of Artificial Intelligence (AI) and Machine Learning (ML) algorithms has revolutionized image interpretation, enabling faster and more accurate identification of anomalies, reducing diagnostic errors, and enhancing the efficiency of radiologists. Deep learning (DL) techniques, in particular, have shown immense promise in automating tasks like image segmentation, feature extraction, and lesion detection, thereby optimizing workflows. The development of more powerful and accessible integrated software solutions that seamlessly combine imaging acquisition, processing, and analysis has also been a significant trend. Concurrently, standalone software continues to cater to specific needs, offering specialized functionalities for particular imaging modalities or analytical tasks.
Shifting consumer demands, driven by an aging global population, a rising incidence of chronic diseases, and an increasing emphasis on personalized medicine, have further amplified the need for advanced medical imaging analysis. Patients and healthcare providers alike are demanding faster, more precise, and less invasive diagnostic procedures, all of which are facilitated by sophisticated imaging software. The growing adoption of Picture Archiving and Communication Systems (PACS) and Vendor Neutral Archives (VNAs) has created a fertile ground for the implementation and integration of these advanced analytical tools. Furthermore, the increasing availability of cloud-based solutions is democratizing access to powerful imaging analysis capabilities, enabling even smaller healthcare facilities to leverage cutting-edge technology. The historical period of 2019–2024 laid the groundwork for this expansion, with steady investments in R&D and increasing digital transformation within healthcare institutions. The market's evolution is marked by a continuous pursuit of higher resolution imaging, faster processing speeds, and more intuitive user interfaces, all aimed at improving patient outcomes and healthcare economics, with an estimated market value reaching over $15 Billion by the end of 2033.
Leading Regions, Countries, or Segments in Medical Imaging Analysis Software Industry
North America, particularly the United States, stands as the dominant region in the medical imaging analysis software industry. This leadership is driven by a robust healthcare infrastructure, significant investments in advanced medical technologies, a high prevalence of chronic diseases requiring sophisticated diagnostics, and a strong presence of key industry players and research institutions. The region's early adoption of AI and ML in healthcare, coupled with favorable regulatory frameworks and substantial R&D funding, solidifies its leading position.
Within the market segments, the Magnetic Resonance Imaging (MRI) modality, followed closely by Tomography and Radiographic Imaging, currently exhibits the highest demand for advanced analysis software. This is attributed to the increasing complexity of MRI scans and the growing need for precise interpretation of detailed anatomical structures and pathologies. The demand for 3D Image and 4D Image analysis is also rapidly escalating as these advanced visualization techniques offer a more comprehensive understanding of patient anatomy and disease progression, significantly enhancing diagnostic accuracy.
In terms of software type, Integrated Software solutions are gaining considerable traction. These comprehensive platforms, which encompass image acquisition, processing, analysis, and reporting, offer a streamlined workflow and improved interoperability within healthcare IT systems. End users such as Hospitals represent the largest consumer base, driven by their high volume of imaging procedures and the need for efficient diagnostic tools. However, Diagnostic Centers are also emerging as significant adopters, seeking to enhance their service offerings and diagnostic precision.
Key drivers for North America's dominance include:
- High Healthcare Expenditure: Significant financial resources allocated to healthcare systems, allowing for investment in cutting-edge medical technologies.
- Technological Innovation Hubs: Presence of leading research institutions and technology companies actively developing and commercializing AI-powered imaging solutions.
- Growing Patient Demographics: An aging population and a high incidence of diseases like cancer, cardiovascular disorders, and neurological conditions that require detailed imaging analysis.
- Supportive Regulatory Environment: A relatively streamlined process for the approval of innovative medical devices and software, albeit with stringent quality and safety standards.
- Early Adoption of Digital Health: A proactive approach to integrating digital technologies into healthcare workflows, facilitating the adoption of advanced imaging analysis software.
The market is projected to witness continued growth in these segments, with increasing penetration of AI-driven solutions and a growing demand for advanced visualization capabilities. The overall market value for imaging analysis software in North America is estimated to exceed $8 Billion by 2033.
Medical Imaging Analysis Software Industry Product Innovations
Product innovations in the medical imaging analysis software industry are primarily focused on enhancing diagnostic accuracy, improving workflow efficiency, and enabling personalized patient care. A key advancement is the integration of deep learning (DL) algorithms for automated image segmentation, anomaly detection, and quantitative analysis, significantly reducing interpretation time and potential for human error. For instance, AI-powered software can now identify subtle lesions in 3D Image data from MRI scans with remarkable precision, often surpassing human capabilities in early detection. Furthermore, real-time image enhancement capabilities, such as those offered by Subtle Medical's SubtleMR software, are improving image quality from faster scan sequences, leading to better patient experiences and optimized workflows. These innovations are driving higher performance metrics, including increased sensitivity and specificity in disease detection, and reduced scan times by an average of 20-30%, directly impacting operational efficiency and patient throughput. The development of cloud-based platforms is also a significant innovation, offering scalability, accessibility, and collaborative analysis capabilities.
Propelling Factors for Medical Imaging Analysis Software Industry Growth
Several key factors are propelling the growth of the medical imaging analysis software industry. Technological advancements, particularly in Artificial Intelligence (AI) and Machine Learning (ML), are revolutionizing diagnostic capabilities, enabling faster and more accurate disease detection. The increasing global burden of chronic diseases like cancer and cardiovascular conditions necessitates more sophisticated diagnostic tools, driving demand for advanced imaging analysis. Growing healthcare expenditure worldwide, coupled with expanding healthcare infrastructure in emerging economies, is creating a larger market for these solutions. Furthermore, government initiatives and regulatory bodies are increasingly recognizing the importance of early diagnosis and preventative care, fostering an environment conducive to the adoption of innovative medical imaging software. The widespread adoption of digital health technologies and electronic health records (EHRs) also facilitates the integration and utilization of these advanced analytical tools.
Obstacles in the Medical Imaging Analysis Software Industry Market
Despite its robust growth, the medical imaging analysis software industry faces several obstacles. The stringent and evolving regulatory landscape, requiring extensive validation and approval processes, can lead to prolonged time-to-market and increased development costs. Data privacy and security concerns surrounding sensitive patient information are paramount, necessitating robust cybersecurity measures and compliance with regulations like GDPR and HIPAA. The high cost of implementing and integrating advanced imaging analysis software, coupled with the need for specialized IT infrastructure and training for healthcare professionals, can be a significant barrier, particularly for smaller healthcare facilities. Interoperability issues between different imaging systems and software platforms can also hinder seamless workflow integration. Finally, the ethical implications and potential for bias in AI algorithms require careful consideration and continuous refinement to ensure equitable and reliable diagnostics, with potential financial impacts of regulatory non-compliance estimated in the tens of millions of dollars annually.
Future Opportunities in Medical Imaging Analysis Software Industry
The medical imaging analysis software industry is ripe with future opportunities. The continued advancements in AI and ML algorithms promise even greater diagnostic precision and automation, leading to the development of predictive analytics for disease progression and treatment response. The expansion of cloud-based solutions will further democratize access to advanced imaging analysis, enabling wider adoption in underserved regions. The growing demand for personalized medicine will drive the development of software tailored for specific patient populations and genetic profiles. Furthermore, the integration of imaging analysis with other healthcare data sources, such as genomics and electronic health records, will unlock new insights for comprehensive patient management. The burgeoning field of teleradiology and remote diagnostics presents significant opportunities for software that facilitates secure and efficient image sharing and analysis across geographical boundaries. The global market for AI in medical imaging alone is projected to reach over $20 Billion by 2030, presenting substantial growth potential.
Major Players in the Medical Imaging Analysis Software Industry Ecosystem
- Siemens Healthcare GmbH
- ScienceSoft USA Corporation
- RamSoft Inc.
- Synapsica Healthcare Pvt Ltd
- Intelerad Medical Systems Incorporated
- Carestream Health
- Xinapse Systems Ltd
- General Electric Company (GE Healthcare)
- Canon Inc (Canon Medical Systems USA)
- Koninklijke Philips NV
- International Business Machines Corporation (IBM)
- AQUILAB SAS
- Agfa-Gevaert Group
Key Developments in Medical Imaging Analysis Software Industry Industry
- July 2022: Siemens Healthineers officially integrated Subtle Medical's SubtleMR image-enhancement software into the new reconstruction pipeline of Siemens Healthineers, Open Recon. SubtleMR offers DL (deep learning) post-processing for denoising and increased sharpness on faster MRI sequences, enabling improved image quality, optimized workflow, and a better patient experience.
- March 2022: Canon Medical Systems agreed to acquire the Danish medical equipment manufacturer, Nordisk Rontgen Teknik, to strengthen its global X-ray business.
Strategic Medical Imaging Analysis Software Industry Market Forecast
The medical imaging analysis software industry is poised for significant strategic growth, driven by the relentless pursuit of enhanced diagnostic accuracy and operational efficiency within healthcare. The increasing integration of AI and deep learning technologies will continue to be a primary growth catalyst, enabling more sophisticated automated analysis and predictive capabilities. The expanding adoption of cloud-based solutions will further democratize access to these advanced tools, fostering innovation and growth in emerging markets. The growing demand for personalized medicine and the increasing emphasis on preventative healthcare will create new avenues for specialized imaging analysis software. The market is projected to experience a robust CAGR of over 12% during the forecast period, with a projected market value to reach approximately $25 Billion by 2033, driven by these strategic opportunities and continued technological advancements in modalities like MRI and Tomography, and in the analysis of 3D Image and 4D Image data.
Medical Imaging Analysis Software Industry Segmentation
-
1. Image Type
- 1.1. 2D Image
- 1.2. 3D Image
- 1.3. 4D Image
-
2. Modality
- 2.1. Tomography
- 2.2. Ultrasound Imaging
- 2.3. Radiographic Imaging
- 2.4. X-ray Imaging
- 2.5. Magnetic Resonance Imaging (MRI)
- 2.6. Other Modalities
-
3. Software Type
- 3.1. Integrated Software
- 3.2. Standalone Software
-
4. End User
- 4.1. Hospital
- 4.2. Diagnostic Center
- 4.3. Research Center
Medical Imaging Analysis Software Industry Segmentation By Geography
-
1. North America
- 1.1. United States
- 1.2. Canada
- 1.3. Mexico
-
2. Europe
- 2.1. Germany
- 2.2. United Kingdom
- 2.3. France
- 2.4. Italy
- 2.5. Spain
- 2.6. Rest of Europe
-
3. Asia Pacific
- 3.1. China
- 3.2. Japan
- 3.3. India
- 3.4. Australia
- 3.5. South Korea
- 3.6. Rest of Asia Pacific
-
4. Middle East and Africa
- 4.1. GCC
- 4.2. South Africa
- 4.3. Rest of Middle East and Africa
-
5. South America
- 5.1. Brazil
- 5.2. Argentina
- 5.3. Rest of South America
Medical Imaging Analysis Software Industry Regional Market Share
Geographic Coverage of Medical Imaging Analysis Software Industry
Medical Imaging Analysis Software Industry REPORT HIGHLIGHTS
| Aspects | Details |
|---|---|
| Study Period | 2020-2034 |
| Base Year | 2025 |
| Estimated Year | 2026 |
| Forecast Period | 2026-2034 |
| Historical Period | 2020-2025 |
| Growth Rate | CAGR of 5.1% from 2020-2034 |
| Segmentation |
|
Table of Contents
- 1. Introduction
- 1.1. Research Scope
- 1.2. Market Segmentation
- 1.3. Research Objective
- 1.4. Definitions and Assumptions
- 2. Executive Summary
- 2.1. Market Snapshot
- 3. Market Dynamics
- 3.1. Market Drivers
- 3.2. Market Restrains
- 3.3. Market Trends
- 3.4. Market Opportunities
- 4. Market Factor Analysis
- 4.1. Porters Five Forces
- 4.1.1. Bargaining Power of Suppliers
- 4.1.2. Bargaining Power of Buyers
- 4.1.3. Threat of New Entrants
- 4.1.4. Threat of Substitutes
- 4.1.5. Competitive Rivalry
- 4.2. PESTEL analysis
- 4.3. BCG Analysis
- 4.3.1. Stars (High Growth, High Market Share)
- 4.3.2. Cash Cows (Low Growth, High Market Share)
- 4.3.3. Question Mark (High Growth, Low Market Share)
- 4.3.4. Dogs (Low Growth, Low Market Share)
- 4.4. Ansoff Matrix Analysis
- 4.5. Supply Chain Analysis
- 4.6. Regulatory Landscape
- 4.7. Current Market Potential and Opportunity Assessment (TAM–SAM–SOM Framework)
- 4.8. DMV Analyst Note
- 4.1. Porters Five Forces
- 5. Market Analysis, Insights and Forecast 2021-2033
- 5.1. Market Analysis, Insights and Forecast - by Image Type
- 5.1.1. 2D Image
- 5.1.2. 3D Image
- 5.1.3. 4D Image
- 5.2. Market Analysis, Insights and Forecast - by Modality
- 5.2.1. Tomography
- 5.2.2. Ultrasound Imaging
- 5.2.3. Radiographic Imaging
- 5.2.4. X-ray Imaging
- 5.2.5. Magnetic Resonance Imaging (MRI)
- 5.2.6. Other Modalities
- 5.3. Market Analysis, Insights and Forecast - by Software Type
- 5.3.1. Integrated Software
- 5.3.2. Standalone Software
- 5.4. Market Analysis, Insights and Forecast - by End User
- 5.4.1. Hospital
- 5.4.2. Diagnostic Center
- 5.4.3. Research Center
- 5.5. Market Analysis, Insights and Forecast - by Region
- 5.5.1. North America
- 5.5.2. Europe
- 5.5.3. Asia Pacific
- 5.5.4. Middle East and Africa
- 5.5.5. South America
- 5.1. Market Analysis, Insights and Forecast - by Image Type
- 6. Global Medical Imaging Analysis Software Industry Analysis, Insights and Forecast, 2021-2033
- 6.1. Market Analysis, Insights and Forecast - by Image Type
- 6.1.1. 2D Image
- 6.1.2. 3D Image
- 6.1.3. 4D Image
- 6.2. Market Analysis, Insights and Forecast - by Modality
- 6.2.1. Tomography
- 6.2.2. Ultrasound Imaging
- 6.2.3. Radiographic Imaging
- 6.2.4. X-ray Imaging
- 6.2.5. Magnetic Resonance Imaging (MRI)
- 6.2.6. Other Modalities
- 6.3. Market Analysis, Insights and Forecast - by Software Type
- 6.3.1. Integrated Software
- 6.3.2. Standalone Software
- 6.4. Market Analysis, Insights and Forecast - by End User
- 6.4.1. Hospital
- 6.4.2. Diagnostic Center
- 6.4.3. Research Center
- 6.1. Market Analysis, Insights and Forecast - by Image Type
- 7. North America Medical Imaging Analysis Software Industry Analysis, Insights and Forecast, 2020-2032
- 7.1. Market Analysis, Insights and Forecast - by Image Type
- 7.1.1. 2D Image
- 7.1.2. 3D Image
- 7.1.3. 4D Image
- 7.2. Market Analysis, Insights and Forecast - by Modality
- 7.2.1. Tomography
- 7.2.2. Ultrasound Imaging
- 7.2.3. Radiographic Imaging
- 7.2.4. X-ray Imaging
- 7.2.5. Magnetic Resonance Imaging (MRI)
- 7.2.6. Other Modalities
- 7.3. Market Analysis, Insights and Forecast - by Software Type
- 7.3.1. Integrated Software
- 7.3.2. Standalone Software
- 7.4. Market Analysis, Insights and Forecast - by End User
- 7.4.1. Hospital
- 7.4.2. Diagnostic Center
- 7.4.3. Research Center
- 7.1. Market Analysis, Insights and Forecast - by Image Type
- 8. Europe Medical Imaging Analysis Software Industry Analysis, Insights and Forecast, 2020-2032
- 8.1. Market Analysis, Insights and Forecast - by Image Type
- 8.1.1. 2D Image
- 8.1.2. 3D Image
- 8.1.3. 4D Image
- 8.2. Market Analysis, Insights and Forecast - by Modality
- 8.2.1. Tomography
- 8.2.2. Ultrasound Imaging
- 8.2.3. Radiographic Imaging
- 8.2.4. X-ray Imaging
- 8.2.5. Magnetic Resonance Imaging (MRI)
- 8.2.6. Other Modalities
- 8.3. Market Analysis, Insights and Forecast - by Software Type
- 8.3.1. Integrated Software
- 8.3.2. Standalone Software
- 8.4. Market Analysis, Insights and Forecast - by End User
- 8.4.1. Hospital
- 8.4.2. Diagnostic Center
- 8.4.3. Research Center
- 8.1. Market Analysis, Insights and Forecast - by Image Type
- 9. Asia Pacific Medical Imaging Analysis Software Industry Analysis, Insights and Forecast, 2020-2032
- 9.1. Market Analysis, Insights and Forecast - by Image Type
- 9.1.1. 2D Image
- 9.1.2. 3D Image
- 9.1.3. 4D Image
- 9.2. Market Analysis, Insights and Forecast - by Modality
- 9.2.1. Tomography
- 9.2.2. Ultrasound Imaging
- 9.2.3. Radiographic Imaging
- 9.2.4. X-ray Imaging
- 9.2.5. Magnetic Resonance Imaging (MRI)
- 9.2.6. Other Modalities
- 9.3. Market Analysis, Insights and Forecast - by Software Type
- 9.3.1. Integrated Software
- 9.3.2. Standalone Software
- 9.4. Market Analysis, Insights and Forecast - by End User
- 9.4.1. Hospital
- 9.4.2. Diagnostic Center
- 9.4.3. Research Center
- 9.1. Market Analysis, Insights and Forecast - by Image Type
- 10. Middle East and Africa Medical Imaging Analysis Software Industry Analysis, Insights and Forecast, 2020-2032
- 10.1. Market Analysis, Insights and Forecast - by Image Type
- 10.1.1. 2D Image
- 10.1.2. 3D Image
- 10.1.3. 4D Image
- 10.2. Market Analysis, Insights and Forecast - by Modality
- 10.2.1. Tomography
- 10.2.2. Ultrasound Imaging
- 10.2.3. Radiographic Imaging
- 10.2.4. X-ray Imaging
- 10.2.5. Magnetic Resonance Imaging (MRI)
- 10.2.6. Other Modalities
- 10.3. Market Analysis, Insights and Forecast - by Software Type
- 10.3.1. Integrated Software
- 10.3.2. Standalone Software
- 10.4. Market Analysis, Insights and Forecast - by End User
- 10.4.1. Hospital
- 10.4.2. Diagnostic Center
- 10.4.3. Research Center
- 10.1. Market Analysis, Insights and Forecast - by Image Type
- 11. South America Medical Imaging Analysis Software Industry Analysis, Insights and Forecast, 2020-2032
- 11.1. Market Analysis, Insights and Forecast - by Image Type
- 11.1.1. 2D Image
- 11.1.2. 3D Image
- 11.1.3. 4D Image
- 11.2. Market Analysis, Insights and Forecast - by Modality
- 11.2.1. Tomography
- 11.2.2. Ultrasound Imaging
- 11.2.3. Radiographic Imaging
- 11.2.4. X-ray Imaging
- 11.2.5. Magnetic Resonance Imaging (MRI)
- 11.2.6. Other Modalities
- 11.3. Market Analysis, Insights and Forecast - by Software Type
- 11.3.1. Integrated Software
- 11.3.2. Standalone Software
- 11.4. Market Analysis, Insights and Forecast - by End User
- 11.4.1. Hospital
- 11.4.2. Diagnostic Center
- 11.4.3. Research Center
- 11.1. Market Analysis, Insights and Forecast - by Image Type
- 12. Competitive Analysis
- 12.1. Company Profiles
- 12.1.1 Siemens Healthcare GmbH
- 12.1.1.1. Company Overview
- 12.1.1.2. Products
- 12.1.1.3. Company Financials
- 12.1.1.4. SWOT Analysis
- 12.1.2 ScienceSoft USA Corporation
- 12.1.2.1. Company Overview
- 12.1.2.2. Products
- 12.1.2.3. Company Financials
- 12.1.2.4. SWOT Analysis
- 12.1.3 RamSoft Inc
- 12.1.3.1. Company Overview
- 12.1.3.2. Products
- 12.1.3.3. Company Financials
- 12.1.3.4. SWOT Analysis
- 12.1.4 Synapsica Healthcare Pvt Ltd
- 12.1.4.1. Company Overview
- 12.1.4.2. Products
- 12.1.4.3. Company Financials
- 12.1.4.4. SWOT Analysis
- 12.1.5 Intelerad Medical Systems Incorporated
- 12.1.5.1. Company Overview
- 12.1.5.2. Products
- 12.1.5.3. Company Financials
- 12.1.5.4. SWOT Analysis
- 12.1.6 Carestream Health
- 12.1.6.1. Company Overview
- 12.1.6.2. Products
- 12.1.6.3. Company Financials
- 12.1.6.4. SWOT Analysis
- 12.1.7 Xinapse Systems Ltd
- 12.1.7.1. Company Overview
- 12.1.7.2. Products
- 12.1.7.3. Company Financials
- 12.1.7.4. SWOT Analysis
- 12.1.8 General Electric Company (GE Healthcare)
- 12.1.8.1. Company Overview
- 12.1.8.2. Products
- 12.1.8.3. Company Financials
- 12.1.8.4. SWOT Analysis
- 12.1.9 Canon Inc (Canon Medical Systems USA)
- 12.1.9.1. Company Overview
- 12.1.9.2. Products
- 12.1.9.3. Company Financials
- 12.1.9.4. SWOT Analysis
- 12.1.10 Koninklijke Philips NV
- 12.1.10.1. Company Overview
- 12.1.10.2. Products
- 12.1.10.3. Company Financials
- 12.1.10.4. SWOT Analysis
- 12.1.11 International Business Machines Corporation (IBM)
- 12.1.11.1. Company Overview
- 12.1.11.2. Products
- 12.1.11.3. Company Financials
- 12.1.11.4. SWOT Analysis
- 12.1.12 AQUILAB SAS
- 12.1.12.1. Company Overview
- 12.1.12.2. Products
- 12.1.12.3. Company Financials
- 12.1.12.4. SWOT Analysis
- 12.1.13 Agfa-Gevaert Group
- 12.1.13.1. Company Overview
- 12.1.13.2. Products
- 12.1.13.3. Company Financials
- 12.1.13.4. SWOT Analysis
- 12.1.1 Siemens Healthcare GmbH
- 12.2. Market Entropy
- 12.2.1 Company's Key Areas Served
- 12.2.2 Recent Developments
- 12.3. Company Market Share Analysis 2025
- 12.3.1 Top 5 Companies Market Share Analysis
- 12.3.2 Top 3 Companies Market Share Analysis
- 12.4. List of Potential Customers
- 13. Research Methodology
List of Figures
- Figure 1: Global Medical Imaging Analysis Software Industry Revenue Breakdown (billion, %) by Region 2025 & 2033
- Figure 2: Global Medical Imaging Analysis Software Industry Volume Breakdown (K Unit, %) by Region 2025 & 2033
- Figure 3: North America Medical Imaging Analysis Software Industry Revenue (billion), by Image Type 2025 & 2033
- Figure 4: North America Medical Imaging Analysis Software Industry Volume (K Unit), by Image Type 2025 & 2033
- Figure 5: North America Medical Imaging Analysis Software Industry Revenue Share (%), by Image Type 2025 & 2033
- Figure 6: North America Medical Imaging Analysis Software Industry Volume Share (%), by Image Type 2025 & 2033
- Figure 7: North America Medical Imaging Analysis Software Industry Revenue (billion), by Modality 2025 & 2033
- Figure 8: North America Medical Imaging Analysis Software Industry Volume (K Unit), by Modality 2025 & 2033
- Figure 9: North America Medical Imaging Analysis Software Industry Revenue Share (%), by Modality 2025 & 2033
- Figure 10: North America Medical Imaging Analysis Software Industry Volume Share (%), by Modality 2025 & 2033
- Figure 11: North America Medical Imaging Analysis Software Industry Revenue (billion), by Software Type 2025 & 2033
- Figure 12: North America Medical Imaging Analysis Software Industry Volume (K Unit), by Software Type 2025 & 2033
- Figure 13: North America Medical Imaging Analysis Software Industry Revenue Share (%), by Software Type 2025 & 2033
- Figure 14: North America Medical Imaging Analysis Software Industry Volume Share (%), by Software Type 2025 & 2033
- Figure 15: North America Medical Imaging Analysis Software Industry Revenue (billion), by End User 2025 & 2033
- Figure 16: North America Medical Imaging Analysis Software Industry Volume (K Unit), by End User 2025 & 2033
- Figure 17: North America Medical Imaging Analysis Software Industry Revenue Share (%), by End User 2025 & 2033
- Figure 18: North America Medical Imaging Analysis Software Industry Volume Share (%), by End User 2025 & 2033
- Figure 19: North America Medical Imaging Analysis Software Industry Revenue (billion), by Country 2025 & 2033
- Figure 20: North America Medical Imaging Analysis Software Industry Volume (K Unit), by Country 2025 & 2033
- Figure 21: North America Medical Imaging Analysis Software Industry Revenue Share (%), by Country 2025 & 2033
- Figure 22: North America Medical Imaging Analysis Software Industry Volume Share (%), by Country 2025 & 2033
- Figure 23: Europe Medical Imaging Analysis Software Industry Revenue (billion), by Image Type 2025 & 2033
- Figure 24: Europe Medical Imaging Analysis Software Industry Volume (K Unit), by Image Type 2025 & 2033
- Figure 25: Europe Medical Imaging Analysis Software Industry Revenue Share (%), by Image Type 2025 & 2033
- Figure 26: Europe Medical Imaging Analysis Software Industry Volume Share (%), by Image Type 2025 & 2033
- Figure 27: Europe Medical Imaging Analysis Software Industry Revenue (billion), by Modality 2025 & 2033
- Figure 28: Europe Medical Imaging Analysis Software Industry Volume (K Unit), by Modality 2025 & 2033
- Figure 29: Europe Medical Imaging Analysis Software Industry Revenue Share (%), by Modality 2025 & 2033
- Figure 30: Europe Medical Imaging Analysis Software Industry Volume Share (%), by Modality 2025 & 2033
- Figure 31: Europe Medical Imaging Analysis Software Industry Revenue (billion), by Software Type 2025 & 2033
- Figure 32: Europe Medical Imaging Analysis Software Industry Volume (K Unit), by Software Type 2025 & 2033
- Figure 33: Europe Medical Imaging Analysis Software Industry Revenue Share (%), by Software Type 2025 & 2033
- Figure 34: Europe Medical Imaging Analysis Software Industry Volume Share (%), by Software Type 2025 & 2033
- Figure 35: Europe Medical Imaging Analysis Software Industry Revenue (billion), by End User 2025 & 2033
- Figure 36: Europe Medical Imaging Analysis Software Industry Volume (K Unit), by End User 2025 & 2033
- Figure 37: Europe Medical Imaging Analysis Software Industry Revenue Share (%), by End User 2025 & 2033
- Figure 38: Europe Medical Imaging Analysis Software Industry Volume Share (%), by End User 2025 & 2033
- Figure 39: Europe Medical Imaging Analysis Software Industry Revenue (billion), by Country 2025 & 2033
- Figure 40: Europe Medical Imaging Analysis Software Industry Volume (K Unit), by Country 2025 & 2033
- Figure 41: Europe Medical Imaging Analysis Software Industry Revenue Share (%), by Country 2025 & 2033
- Figure 42: Europe Medical Imaging Analysis Software Industry Volume Share (%), by Country 2025 & 2033
- Figure 43: Asia Pacific Medical Imaging Analysis Software Industry Revenue (billion), by Image Type 2025 & 2033
- Figure 44: Asia Pacific Medical Imaging Analysis Software Industry Volume (K Unit), by Image Type 2025 & 2033
- Figure 45: Asia Pacific Medical Imaging Analysis Software Industry Revenue Share (%), by Image Type 2025 & 2033
- Figure 46: Asia Pacific Medical Imaging Analysis Software Industry Volume Share (%), by Image Type 2025 & 2033
- Figure 47: Asia Pacific Medical Imaging Analysis Software Industry Revenue (billion), by Modality 2025 & 2033
- Figure 48: Asia Pacific Medical Imaging Analysis Software Industry Volume (K Unit), by Modality 2025 & 2033
- Figure 49: Asia Pacific Medical Imaging Analysis Software Industry Revenue Share (%), by Modality 2025 & 2033
- Figure 50: Asia Pacific Medical Imaging Analysis Software Industry Volume Share (%), by Modality 2025 & 2033
- Figure 51: Asia Pacific Medical Imaging Analysis Software Industry Revenue (billion), by Software Type 2025 & 2033
- Figure 52: Asia Pacific Medical Imaging Analysis Software Industry Volume (K Unit), by Software Type 2025 & 2033
- Figure 53: Asia Pacific Medical Imaging Analysis Software Industry Revenue Share (%), by Software Type 2025 & 2033
- Figure 54: Asia Pacific Medical Imaging Analysis Software Industry Volume Share (%), by Software Type 2025 & 2033
- Figure 55: Asia Pacific Medical Imaging Analysis Software Industry Revenue (billion), by End User 2025 & 2033
- Figure 56: Asia Pacific Medical Imaging Analysis Software Industry Volume (K Unit), by End User 2025 & 2033
- Figure 57: Asia Pacific Medical Imaging Analysis Software Industry Revenue Share (%), by End User 2025 & 2033
- Figure 58: Asia Pacific Medical Imaging Analysis Software Industry Volume Share (%), by End User 2025 & 2033
- Figure 59: Asia Pacific Medical Imaging Analysis Software Industry Revenue (billion), by Country 2025 & 2033
- Figure 60: Asia Pacific Medical Imaging Analysis Software Industry Volume (K Unit), by Country 2025 & 2033
- Figure 61: Asia Pacific Medical Imaging Analysis Software Industry Revenue Share (%), by Country 2025 & 2033
- Figure 62: Asia Pacific Medical Imaging Analysis Software Industry Volume Share (%), by Country 2025 & 2033
- Figure 63: Middle East and Africa Medical Imaging Analysis Software Industry Revenue (billion), by Image Type 2025 & 2033
- Figure 64: Middle East and Africa Medical Imaging Analysis Software Industry Volume (K Unit), by Image Type 2025 & 2033
- Figure 65: Middle East and Africa Medical Imaging Analysis Software Industry Revenue Share (%), by Image Type 2025 & 2033
- Figure 66: Middle East and Africa Medical Imaging Analysis Software Industry Volume Share (%), by Image Type 2025 & 2033
- Figure 67: Middle East and Africa Medical Imaging Analysis Software Industry Revenue (billion), by Modality 2025 & 2033
- Figure 68: Middle East and Africa Medical Imaging Analysis Software Industry Volume (K Unit), by Modality 2025 & 2033
- Figure 69: Middle East and Africa Medical Imaging Analysis Software Industry Revenue Share (%), by Modality 2025 & 2033
- Figure 70: Middle East and Africa Medical Imaging Analysis Software Industry Volume Share (%), by Modality 2025 & 2033
- Figure 71: Middle East and Africa Medical Imaging Analysis Software Industry Revenue (billion), by Software Type 2025 & 2033
- Figure 72: Middle East and Africa Medical Imaging Analysis Software Industry Volume (K Unit), by Software Type 2025 & 2033
- Figure 73: Middle East and Africa Medical Imaging Analysis Software Industry Revenue Share (%), by Software Type 2025 & 2033
- Figure 74: Middle East and Africa Medical Imaging Analysis Software Industry Volume Share (%), by Software Type 2025 & 2033
- Figure 75: Middle East and Africa Medical Imaging Analysis Software Industry Revenue (billion), by End User 2025 & 2033
- Figure 76: Middle East and Africa Medical Imaging Analysis Software Industry Volume (K Unit), by End User 2025 & 2033
- Figure 77: Middle East and Africa Medical Imaging Analysis Software Industry Revenue Share (%), by End User 2025 & 2033
- Figure 78: Middle East and Africa Medical Imaging Analysis Software Industry Volume Share (%), by End User 2025 & 2033
- Figure 79: Middle East and Africa Medical Imaging Analysis Software Industry Revenue (billion), by Country 2025 & 2033
- Figure 80: Middle East and Africa Medical Imaging Analysis Software Industry Volume (K Unit), by Country 2025 & 2033
- Figure 81: Middle East and Africa Medical Imaging Analysis Software Industry Revenue Share (%), by Country 2025 & 2033
- Figure 82: Middle East and Africa Medical Imaging Analysis Software Industry Volume Share (%), by Country 2025 & 2033
- Figure 83: South America Medical Imaging Analysis Software Industry Revenue (billion), by Image Type 2025 & 2033
- Figure 84: South America Medical Imaging Analysis Software Industry Volume (K Unit), by Image Type 2025 & 2033
- Figure 85: South America Medical Imaging Analysis Software Industry Revenue Share (%), by Image Type 2025 & 2033
- Figure 86: South America Medical Imaging Analysis Software Industry Volume Share (%), by Image Type 2025 & 2033
- Figure 87: South America Medical Imaging Analysis Software Industry Revenue (billion), by Modality 2025 & 2033
- Figure 88: South America Medical Imaging Analysis Software Industry Volume (K Unit), by Modality 2025 & 2033
- Figure 89: South America Medical Imaging Analysis Software Industry Revenue Share (%), by Modality 2025 & 2033
- Figure 90: South America Medical Imaging Analysis Software Industry Volume Share (%), by Modality 2025 & 2033
- Figure 91: South America Medical Imaging Analysis Software Industry Revenue (billion), by Software Type 2025 & 2033
- Figure 92: South America Medical Imaging Analysis Software Industry Volume (K Unit), by Software Type 2025 & 2033
- Figure 93: South America Medical Imaging Analysis Software Industry Revenue Share (%), by Software Type 2025 & 2033
- Figure 94: South America Medical Imaging Analysis Software Industry Volume Share (%), by Software Type 2025 & 2033
- Figure 95: South America Medical Imaging Analysis Software Industry Revenue (billion), by End User 2025 & 2033
- Figure 96: South America Medical Imaging Analysis Software Industry Volume (K Unit), by End User 2025 & 2033
- Figure 97: South America Medical Imaging Analysis Software Industry Revenue Share (%), by End User 2025 & 2033
- Figure 98: South America Medical Imaging Analysis Software Industry Volume Share (%), by End User 2025 & 2033
- Figure 99: South America Medical Imaging Analysis Software Industry Revenue (billion), by Country 2025 & 2033
- Figure 100: South America Medical Imaging Analysis Software Industry Volume (K Unit), by Country 2025 & 2033
- Figure 101: South America Medical Imaging Analysis Software Industry Revenue Share (%), by Country 2025 & 2033
- Figure 102: South America Medical Imaging Analysis Software Industry Volume Share (%), by Country 2025 & 2033
List of Tables
- Table 1: Global Medical Imaging Analysis Software Industry Revenue billion Forecast, by Image Type 2020 & 2033
- Table 2: Global Medical Imaging Analysis Software Industry Volume K Unit Forecast, by Image Type 2020 & 2033
- Table 3: Global Medical Imaging Analysis Software Industry Revenue billion Forecast, by Modality 2020 & 2033
- Table 4: Global Medical Imaging Analysis Software Industry Volume K Unit Forecast, by Modality 2020 & 2033
- Table 5: Global Medical Imaging Analysis Software Industry Revenue billion Forecast, by Software Type 2020 & 2033
- Table 6: Global Medical Imaging Analysis Software Industry Volume K Unit Forecast, by Software Type 2020 & 2033
- Table 7: Global Medical Imaging Analysis Software Industry Revenue billion Forecast, by End User 2020 & 2033
- Table 8: Global Medical Imaging Analysis Software Industry Volume K Unit Forecast, by End User 2020 & 2033
- Table 9: Global Medical Imaging Analysis Software Industry Revenue billion Forecast, by Region 2020 & 2033
- Table 10: Global Medical Imaging Analysis Software Industry Volume K Unit Forecast, by Region 2020 & 2033
- Table 11: Global Medical Imaging Analysis Software Industry Revenue billion Forecast, by Image Type 2020 & 2033
- Table 12: Global Medical Imaging Analysis Software Industry Volume K Unit Forecast, by Image Type 2020 & 2033
- Table 13: Global Medical Imaging Analysis Software Industry Revenue billion Forecast, by Modality 2020 & 2033
- Table 14: Global Medical Imaging Analysis Software Industry Volume K Unit Forecast, by Modality 2020 & 2033
- Table 15: Global Medical Imaging Analysis Software Industry Revenue billion Forecast, by Software Type 2020 & 2033
- Table 16: Global Medical Imaging Analysis Software Industry Volume K Unit Forecast, by Software Type 2020 & 2033
- Table 17: Global Medical Imaging Analysis Software Industry Revenue billion Forecast, by End User 2020 & 2033
- Table 18: Global Medical Imaging Analysis Software Industry Volume K Unit Forecast, by End User 2020 & 2033
- Table 19: Global Medical Imaging Analysis Software Industry Revenue billion Forecast, by Country 2020 & 2033
- Table 20: Global Medical Imaging Analysis Software Industry Volume K Unit Forecast, by Country 2020 & 2033
- Table 21: United States Medical Imaging Analysis Software Industry Revenue (billion) Forecast, by Application 2020 & 2033
- Table 22: United States Medical Imaging Analysis Software Industry Volume (K Unit) Forecast, by Application 2020 & 2033
- Table 23: Canada Medical Imaging Analysis Software Industry Revenue (billion) Forecast, by Application 2020 & 2033
- Table 24: Canada Medical Imaging Analysis Software Industry Volume (K Unit) Forecast, by Application 2020 & 2033
- Table 25: Mexico Medical Imaging Analysis Software Industry Revenue (billion) Forecast, by Application 2020 & 2033
- Table 26: Mexico Medical Imaging Analysis Software Industry Volume (K Unit) Forecast, by Application 2020 & 2033
- Table 27: Global Medical Imaging Analysis Software Industry Revenue billion Forecast, by Image Type 2020 & 2033
- Table 28: Global Medical Imaging Analysis Software Industry Volume K Unit Forecast, by Image Type 2020 & 2033
- Table 29: Global Medical Imaging Analysis Software Industry Revenue billion Forecast, by Modality 2020 & 2033
- Table 30: Global Medical Imaging Analysis Software Industry Volume K Unit Forecast, by Modality 2020 & 2033
- Table 31: Global Medical Imaging Analysis Software Industry Revenue billion Forecast, by Software Type 2020 & 2033
- Table 32: Global Medical Imaging Analysis Software Industry Volume K Unit Forecast, by Software Type 2020 & 2033
- Table 33: Global Medical Imaging Analysis Software Industry Revenue billion Forecast, by End User 2020 & 2033
- Table 34: Global Medical Imaging Analysis Software Industry Volume K Unit Forecast, by End User 2020 & 2033
- Table 35: Global Medical Imaging Analysis Software Industry Revenue billion Forecast, by Country 2020 & 2033
- Table 36: Global Medical Imaging Analysis Software Industry Volume K Unit Forecast, by Country 2020 & 2033
- Table 37: Germany Medical Imaging Analysis Software Industry Revenue (billion) Forecast, by Application 2020 & 2033
- Table 38: Germany Medical Imaging Analysis Software Industry Volume (K Unit) Forecast, by Application 2020 & 2033
- Table 39: United Kingdom Medical Imaging Analysis Software Industry Revenue (billion) Forecast, by Application 2020 & 2033
- Table 40: United Kingdom Medical Imaging Analysis Software Industry Volume (K Unit) Forecast, by Application 2020 & 2033
- Table 41: France Medical Imaging Analysis Software Industry Revenue (billion) Forecast, by Application 2020 & 2033
- Table 42: France Medical Imaging Analysis Software Industry Volume (K Unit) Forecast, by Application 2020 & 2033
- Table 43: Italy Medical Imaging Analysis Software Industry Revenue (billion) Forecast, by Application 2020 & 2033
- Table 44: Italy Medical Imaging Analysis Software Industry Volume (K Unit) Forecast, by Application 2020 & 2033
- Table 45: Spain Medical Imaging Analysis Software Industry Revenue (billion) Forecast, by Application 2020 & 2033
- Table 46: Spain Medical Imaging Analysis Software Industry Volume (K Unit) Forecast, by Application 2020 & 2033
- Table 47: Rest of Europe Medical Imaging Analysis Software Industry Revenue (billion) Forecast, by Application 2020 & 2033
- Table 48: Rest of Europe Medical Imaging Analysis Software Industry Volume (K Unit) Forecast, by Application 2020 & 2033
- Table 49: Global Medical Imaging Analysis Software Industry Revenue billion Forecast, by Image Type 2020 & 2033
- Table 50: Global Medical Imaging Analysis Software Industry Volume K Unit Forecast, by Image Type 2020 & 2033
- Table 51: Global Medical Imaging Analysis Software Industry Revenue billion Forecast, by Modality 2020 & 2033
- Table 52: Global Medical Imaging Analysis Software Industry Volume K Unit Forecast, by Modality 2020 & 2033
- Table 53: Global Medical Imaging Analysis Software Industry Revenue billion Forecast, by Software Type 2020 & 2033
- Table 54: Global Medical Imaging Analysis Software Industry Volume K Unit Forecast, by Software Type 2020 & 2033
- Table 55: Global Medical Imaging Analysis Software Industry Revenue billion Forecast, by End User 2020 & 2033
- Table 56: Global Medical Imaging Analysis Software Industry Volume K Unit Forecast, by End User 2020 & 2033
- Table 57: Global Medical Imaging Analysis Software Industry Revenue billion Forecast, by Country 2020 & 2033
- Table 58: Global Medical Imaging Analysis Software Industry Volume K Unit Forecast, by Country 2020 & 2033
- Table 59: China Medical Imaging Analysis Software Industry Revenue (billion) Forecast, by Application 2020 & 2033
- Table 60: China Medical Imaging Analysis Software Industry Volume (K Unit) Forecast, by Application 2020 & 2033
- Table 61: Japan Medical Imaging Analysis Software Industry Revenue (billion) Forecast, by Application 2020 & 2033
- Table 62: Japan Medical Imaging Analysis Software Industry Volume (K Unit) Forecast, by Application 2020 & 2033
- Table 63: India Medical Imaging Analysis Software Industry Revenue (billion) Forecast, by Application 2020 & 2033
- Table 64: India Medical Imaging Analysis Software Industry Volume (K Unit) Forecast, by Application 2020 & 2033
- Table 65: Australia Medical Imaging Analysis Software Industry Revenue (billion) Forecast, by Application 2020 & 2033
- Table 66: Australia Medical Imaging Analysis Software Industry Volume (K Unit) Forecast, by Application 2020 & 2033
- Table 67: South Korea Medical Imaging Analysis Software Industry Revenue (billion) Forecast, by Application 2020 & 2033
- Table 68: South Korea Medical Imaging Analysis Software Industry Volume (K Unit) Forecast, by Application 2020 & 2033
- Table 69: Rest of Asia Pacific Medical Imaging Analysis Software Industry Revenue (billion) Forecast, by Application 2020 & 2033
- Table 70: Rest of Asia Pacific Medical Imaging Analysis Software Industry Volume (K Unit) Forecast, by Application 2020 & 2033
- Table 71: Global Medical Imaging Analysis Software Industry Revenue billion Forecast, by Image Type 2020 & 2033
- Table 72: Global Medical Imaging Analysis Software Industry Volume K Unit Forecast, by Image Type 2020 & 2033
- Table 73: Global Medical Imaging Analysis Software Industry Revenue billion Forecast, by Modality 2020 & 2033
- Table 74: Global Medical Imaging Analysis Software Industry Volume K Unit Forecast, by Modality 2020 & 2033
- Table 75: Global Medical Imaging Analysis Software Industry Revenue billion Forecast, by Software Type 2020 & 2033
- Table 76: Global Medical Imaging Analysis Software Industry Volume K Unit Forecast, by Software Type 2020 & 2033
- Table 77: Global Medical Imaging Analysis Software Industry Revenue billion Forecast, by End User 2020 & 2033
- Table 78: Global Medical Imaging Analysis Software Industry Volume K Unit Forecast, by End User 2020 & 2033
- Table 79: Global Medical Imaging Analysis Software Industry Revenue billion Forecast, by Country 2020 & 2033
- Table 80: Global Medical Imaging Analysis Software Industry Volume K Unit Forecast, by Country 2020 & 2033
- Table 81: GCC Medical Imaging Analysis Software Industry Revenue (billion) Forecast, by Application 2020 & 2033
- Table 82: GCC Medical Imaging Analysis Software Industry Volume (K Unit) Forecast, by Application 2020 & 2033
- Table 83: South Africa Medical Imaging Analysis Software Industry Revenue (billion) Forecast, by Application 2020 & 2033
- Table 84: South Africa Medical Imaging Analysis Software Industry Volume (K Unit) Forecast, by Application 2020 & 2033
- Table 85: Rest of Middle East and Africa Medical Imaging Analysis Software Industry Revenue (billion) Forecast, by Application 2020 & 2033
- Table 86: Rest of Middle East and Africa Medical Imaging Analysis Software Industry Volume (K Unit) Forecast, by Application 2020 & 2033
- Table 87: Global Medical Imaging Analysis Software Industry Revenue billion Forecast, by Image Type 2020 & 2033
- Table 88: Global Medical Imaging Analysis Software Industry Volume K Unit Forecast, by Image Type 2020 & 2033
- Table 89: Global Medical Imaging Analysis Software Industry Revenue billion Forecast, by Modality 2020 & 2033
- Table 90: Global Medical Imaging Analysis Software Industry Volume K Unit Forecast, by Modality 2020 & 2033
- Table 91: Global Medical Imaging Analysis Software Industry Revenue billion Forecast, by Software Type 2020 & 2033
- Table 92: Global Medical Imaging Analysis Software Industry Volume K Unit Forecast, by Software Type 2020 & 2033
- Table 93: Global Medical Imaging Analysis Software Industry Revenue billion Forecast, by End User 2020 & 2033
- Table 94: Global Medical Imaging Analysis Software Industry Volume K Unit Forecast, by End User 2020 & 2033
- Table 95: Global Medical Imaging Analysis Software Industry Revenue billion Forecast, by Country 2020 & 2033
- Table 96: Global Medical Imaging Analysis Software Industry Volume K Unit Forecast, by Country 2020 & 2033
- Table 97: Brazil Medical Imaging Analysis Software Industry Revenue (billion) Forecast, by Application 2020 & 2033
- Table 98: Brazil Medical Imaging Analysis Software Industry Volume (K Unit) Forecast, by Application 2020 & 2033
- Table 99: Argentina Medical Imaging Analysis Software Industry Revenue (billion) Forecast, by Application 2020 & 2033
- Table 100: Argentina Medical Imaging Analysis Software Industry Volume (K Unit) Forecast, by Application 2020 & 2033
- Table 101: Rest of South America Medical Imaging Analysis Software Industry Revenue (billion) Forecast, by Application 2020 & 2033
- Table 102: Rest of South America Medical Imaging Analysis Software Industry Volume (K Unit) Forecast, by Application 2020 & 2033
Frequently Asked Questions
1. What is the projected Compound Annual Growth Rate (CAGR) of the Medical Imaging Analysis Software Industry?
The projected CAGR is approximately 5.1%.
2. Which companies are prominent players in the Medical Imaging Analysis Software Industry?
Key companies in the market include Siemens Healthcare GmbH, ScienceSoft USA Corporation, RamSoft Inc, Synapsica Healthcare Pvt Ltd, Intelerad Medical Systems Incorporated, Carestream Health, Xinapse Systems Ltd, General Electric Company (GE Healthcare), Canon Inc (Canon Medical Systems USA), Koninklijke Philips NV, International Business Machines Corporation (IBM), AQUILAB SAS, Agfa-Gevaert Group.
3. What are the main segments of the Medical Imaging Analysis Software Industry?
The market segments include Image Type, Modality, Software Type, End User.
4. Can you provide details about the market size?
The market size is estimated to be USD 43.5 billion as of 2022.
5. What are some drivers contributing to market growth?
Technological Advancements in Medical Imaging Systems and Analysis Software; Increasing Usage of Imaging Equipment Due to Rising Prevalence of Chronic Diseases; Rising Applications of Computer-aided Diagnosis.
6. What are the notable trends driving market growth?
The X-ray Imaging Segment is Expected to Witness Significant Growth Over the Forecast Period.
7. Are there any restraints impacting market growth?
Budgetary Constraints.
8. Can you provide examples of recent developments in the market?
In July 2022, Siemens Healthineers, a medical technology company, officially integrated Subtle Medical's SubtleMR image-enhancement software into the new reconstruction pipeline of Siemens Healthineers, Open Recon. SubtleMR offers DL (deep learning) post-processing for denoising and increased sharpness on faster MRI sequences, enabling improved image quality, optimized workflow, and a better patient experience.
9. What pricing options are available for accessing the report?
Pricing options include single-user, multi-user, and enterprise licenses priced at USD 4750, USD 5250, and USD 8750 respectively.
10. Is the market size provided in terms of value or volume?
The market size is provided in terms of value, measured in billion and volume, measured in K Unit.
11. Are there any specific market keywords associated with the report?
Yes, the market keyword associated with the report is "Medical Imaging Analysis Software Industry," which aids in identifying and referencing the specific market segment covered.
12. How do I determine which pricing option suits my needs best?
The pricing options vary based on user requirements and access needs. Individual users may opt for single-user licenses, while businesses requiring broader access may choose multi-user or enterprise licenses for cost-effective access to the report.
13. Are there any additional resources or data provided in the Medical Imaging Analysis Software Industry report?
While the report offers comprehensive insights, it's advisable to review the specific contents or supplementary materials provided to ascertain if additional resources or data are available.
14. How can I stay updated on further developments or reports in the Medical Imaging Analysis Software Industry?
To stay informed about further developments, trends, and reports in the Medical Imaging Analysis Software Industry, consider subscribing to industry newsletters, following relevant companies and organizations, or regularly checking reputable industry news sources and publications.
Methodology
Step 1 - Identification of Relevant Samples Size from Population Database


Step 2 - Approaches for Defining Global Market Size (Value, Volume* & Price*)

Note*: In applicable scenarios
Step 3 - Data Sources
Primary Research
- Web Analytics
- Survey Reports
- Research Institute
- Latest Research Reports
- Opinion Leaders
Secondary Research
- Annual Reports
- White Paper
- Latest Press Release
- Industry Association
- Paid Database
- Investor Presentations

Step 4 - Data Triangulation
Involves using different sources of information in order to increase the validity of a study
These sources are likely to be stakeholders in a program - participants, other researchers, program staff, other community members, and so on.
Then we put all data in single framework & apply various statistical tools to find out the dynamic on the market.
During the analysis stage, feedback from the stakeholder groups would be compared to determine areas of agreement as well as areas of divergence