

Key Insights
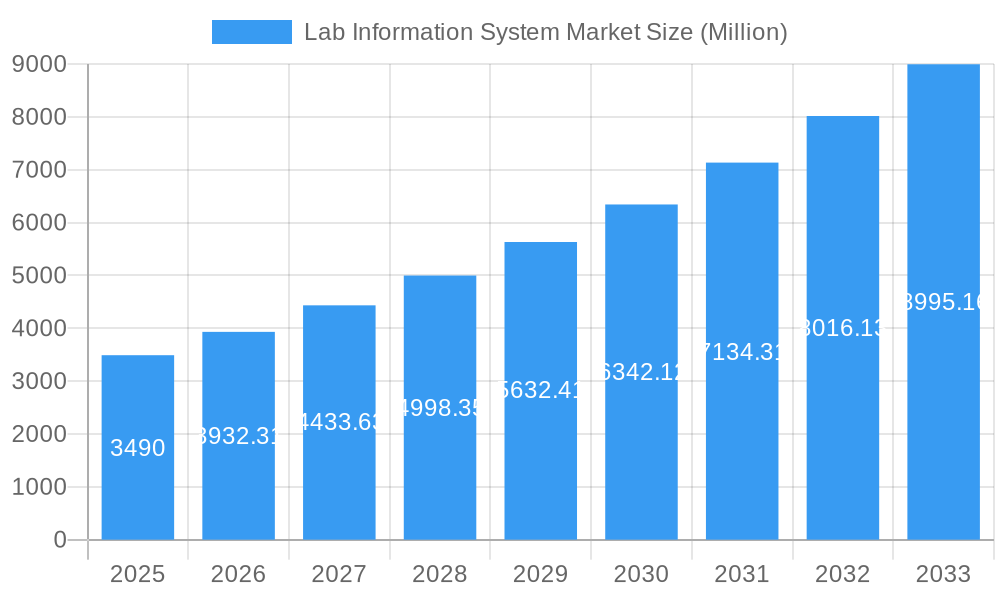
The global Lab Information System (LIS) market, valued at $3.49 billion in 2025, is projected to experience robust growth, driven by a Compound Annual Growth Rate (CAGR) of 12.79% from 2025 to 2033. This expansion is fueled by several key factors. Increasing automation needs within clinical laboratories to enhance efficiency and reduce turnaround time are major contributors. The rising prevalence of chronic diseases globally necessitates higher testing volumes, creating a greater demand for sophisticated LIS solutions capable of handling large data sets and integrating with other healthcare IT systems. Furthermore, the growing adoption of cloud-based LIS solutions offers advantages like improved accessibility, scalability, and cost-effectiveness, stimulating market growth. The integration of artificial intelligence (AI) and machine learning (ML) in LIS is also contributing to advancements in data analysis and diagnostic accuracy, further driving market adoption. Software solutions are currently dominating the market, offering comprehensive functionalities compared to traditional on-premise systems. Hospitals represent the largest end-user segment due to their high testing volumes and need for comprehensive data management. North America and Europe currently hold significant market shares due to established healthcare infrastructure and high technological adoption rates, but the Asia-Pacific region is poised for rapid growth in the coming years, driven by increasing healthcare spending and improving healthcare infrastructure.
Lab Information System Market Market Size (In Billion)
The competitive landscape of the LIS market is characterized by the presence of both established players and emerging companies. Key market leaders like Epic Systems Corporation and Cerner Corporation are leveraging their established customer base and technological expertise to maintain their market positions. However, smaller, agile companies are innovating and offering specialized solutions, creating healthy competition and stimulating market innovation. The market is also witnessing increased mergers and acquisitions, indicating a trend towards consolidation among industry players. Future growth will be influenced by factors such as regulatory changes impacting data privacy and security, the integration of LIS with other healthcare technologies such as Electronic Health Records (EHRs), and the continued development of more sophisticated analytical tools within the LIS platforms. The market's trajectory suggests a significant expansion in the coming years, promising substantial opportunities for existing players and new entrants alike.
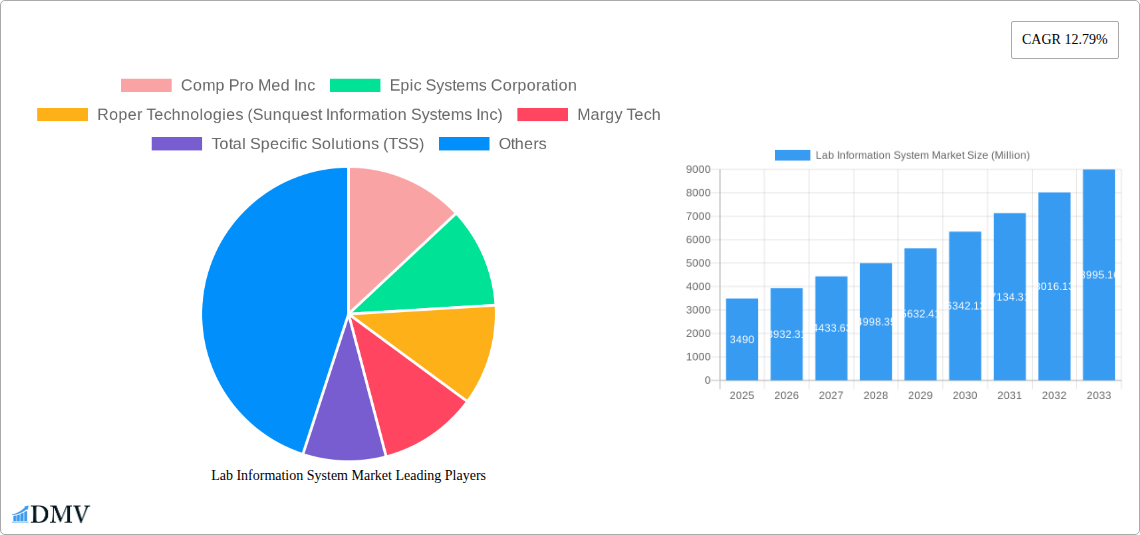
Lab Information System Market Company Market Share
Lab Information System Market: A Comprehensive Report (2019-2033)
This insightful report provides a detailed analysis of the Lab Information System (LIS) market, offering a comprehensive overview of its current state, future trajectory, and key players. With a study period spanning 2019-2033, a base year of 2025, and a forecast period of 2025-2033, this report is an indispensable resource for stakeholders seeking to understand and capitalize on the opportunities within this dynamic market. The market is estimated to reach xx Million by 2025.
Lab Information System Market Market Composition & Trends
The Lab Information System market exhibits a moderately concentrated structure, with a handful of major players holding significant market share. However, the emergence of innovative startups and the increasing adoption of cloud-based solutions are contributing to a more competitive landscape. Regulatory landscapes vary across regions, influencing market access and product approvals. Substitute products, such as manual record-keeping systems, are becoming increasingly less prevalent due to efficiency and accuracy concerns. End-users predominantly comprise hospitals and clinics, with other end-users, such as research laboratories, representing a growing segment. Mergers and acquisitions (M&A) activity has been moderate, with deal values averaging xx Million in recent years.
- Market Share Distribution (2024): Epic Systems Corporation holds approximately 20% market share, followed by Cerner Corporation (15%), and others holding smaller shares.
- M&A Activity (2019-2024): An average of 5-7 M&A deals per year occurred, with values ranging from xx Million to xx Million per transaction.
- Innovation Catalysts: Increasing demand for interoperability, improved data analytics capabilities, and the rise of AI-driven diagnostic tools.
- Regulatory Landscape: Compliance with HIPAA, GDPR, and other regional regulations is driving market growth.
Lab Information System Market Industry Evolution
The Lab Information System market has witnessed consistent growth throughout the historical period (2019-2024), primarily driven by the rising prevalence of chronic diseases, increasing healthcare expenditure, and the growing adoption of advanced diagnostic techniques. Technological advancements, such as the integration of artificial intelligence (AI) and machine learning (ML) algorithms, have significantly enhanced the capabilities of LIS systems, leading to improved efficiency, accuracy, and decision-making. The shift towards cloud-based LIS solutions has further accelerated market expansion, offering enhanced scalability, accessibility, and cost-effectiveness. The market experienced a Compound Annual Growth Rate (CAGR) of xx% between 2019 and 2024. This growth trajectory is expected to continue, albeit at a slightly moderated pace, throughout the forecast period. Adoption rates for cloud-based LIS are projected to increase from xx% in 2024 to xx% by 2033.
Leading Regions, Countries, or Segments in Lab Information System Market
The North American region dominates the Lab Information System market, driven by high healthcare expenditure, robust technological infrastructure, and stringent regulatory frameworks that encourage technology adoption. Within North America, the United States holds the largest market share.
- By Component: The software segment holds the largest market share, owing to the continuous development and integration of sophisticated features and functionalities.
- By Mode of Delivery: The cloud-based segment is experiencing rapid growth, driven by increasing demand for remote access, scalability, and cost-effectiveness.
- By End-User: Hospitals continue to be the primary users of LIS systems, followed by clinics.
- Key Drivers:
- High investment in healthcare infrastructure.
- Favorable government policies promoting digitalization in healthcare.
- Growing demand for improved diagnostic accuracy and efficiency.
Lab Information System Market Product Innovations
Recent innovations in LIS systems include the integration of advanced analytics tools, AI-powered diagnostic support, and improved interoperability with other healthcare IT systems. These features enable laboratories to improve workflow efficiency, enhance diagnostic accuracy, and reduce operational costs. Unique selling propositions include real-time data access, automated reporting, and streamlined integration with other laboratory instruments. These advancements are continually pushing the boundaries of what’s possible in laboratory management and diagnostic accuracy.
Propelling Factors for Lab Information System Market Growth
Technological advancements, such as AI and ML integration, are driving market growth by enhancing the capabilities of LIS systems. Increasing healthcare expenditure globally is also fueling demand. Stringent regulatory requirements emphasizing data security and interoperability further propel market expansion. The rise of chronic diseases globally is increasing the demand for rapid, accurate diagnostic testing, boosting the need for efficient LIS.
Obstacles in the Lab Information System Market Market
High initial investment costs for implementing LIS systems can deter smaller laboratories. Integration challenges with existing healthcare IT infrastructure can pose obstacles to smooth deployment. Concerns regarding data security and patient privacy are further challenges for market penetration. Supply chain disruptions in recent years impacted the availability of components needed for LIS systems.
Future Opportunities in Lab Information System Market
Expansion into emerging markets with growing healthcare infrastructure presents significant opportunities. The increasing adoption of telehealth and remote patient monitoring increases the demand for remote access capabilities offered by cloud-based LIS. The development of specialized LIS solutions catering to niche areas, such as genomics and personalized medicine, is expected to fuel future growth.
Major Players in the Lab Information System Market Ecosystem
Key Developments in Lab Information System Market Industry
- February 2022: Roche Diagnostics China and Sanomede Medical Technology Co., Ltd. jointly launched RS600 Lab Automation Software (LAS) for the Chinese market. This launch expands the reach of advanced LIS technology to a significant market.
- February 2022: Biosero, Inc. launched new products and features in its Green Button Go software suite, enhancing the capabilities of automated lab systems and improving workflow efficiency. This strengthens their position in the market and offers customers advanced automation capabilities.
Strategic Lab Information System Market Market Forecast
The Lab Information System market is poised for continued growth, driven by technological innovations, increasing healthcare expenditure, and a rising prevalence of chronic diseases. The shift towards cloud-based solutions and the integration of AI and ML will further fuel market expansion. New market opportunities in emerging economies and specialized niche areas like personalized medicine will create substantial growth potential over the forecast period. The market is expected to maintain a healthy growth trajectory, with a projected CAGR of xx% from 2025 to 2033.
Lab Information System Market Segmentation
-
1. Component
- 1.1. Software
- 1.2. Services
-
2. Mode of Delivery
- 2.1. On-premise
- 2.2. Cloud-based
-
3. End User
- 3.1. Hospital
- 3.2. Clinic
- 3.3. Other End Users
Lab Information System Market Segmentation By Geography
-
1. North America
- 1.1. United States
- 1.2. Canada
- 1.3. Mexico
-
2. Europe
- 2.1. Germany
- 2.2. United Kingdom
- 2.3. France
- 2.4. Italy
- 2.5. Spain
- 2.6. Rest of Europe
-
3. Asia Pacific
- 3.1. China
- 3.2. Japan
- 3.3. India
- 3.4. Australia
- 3.5. South Korea
- 3.6. Rest of Asia Pacific
-
4. Middle East and Africa
- 4.1. GCC
- 4.2. South Africa
- 4.3. Rest of Middle East and Africa
-
5. South America
- 5.1. Brazil
- 5.2. Argentina
- 5.3. Rest of South America
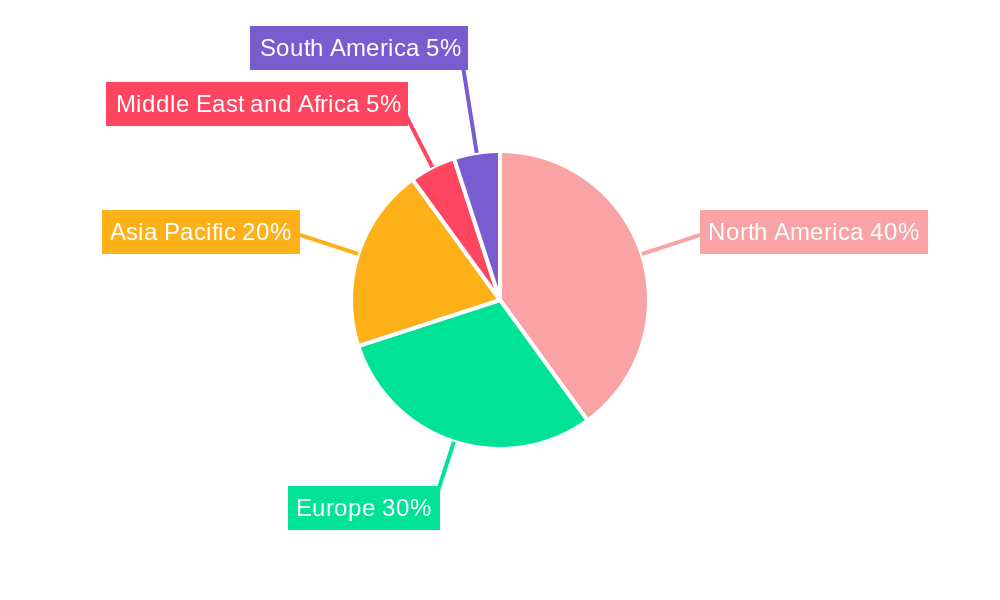
Lab Information System Market Regional Market Share
Geographic Coverage of Lab Information System Market
Lab Information System Market REPORT HIGHLIGHTS
| Aspects | Details |
|---|---|
| Study Period | 2020-2034 |
| Base Year | 2025 |
| Estimated Year | 2026 |
| Forecast Period | 2026-2034 |
| Historical Period | 2020-2025 |
| Growth Rate | CAGR of 12.79% from 2020-2034 |
| Segmentation |
|
Table of Contents
- 1. Introduction
- 1.1. Research Scope
- 1.2. Market Segmentation
- 1.3. Research Objective
- 1.4. Definitions and Assumptions
- 2. Executive Summary
- 2.1. Market Snapshot
- 3. Market Dynamics
- 3.1. Market Drivers
- 3.2. Market Restrains
- 3.3. Market Trends
- 3.4. Market Opportunities
- 4. Market Factor Analysis
- 4.1. Porters Five Forces
- 4.1.1. Bargaining Power of Suppliers
- 4.1.2. Bargaining Power of Buyers
- 4.1.3. Threat of New Entrants
- 4.1.4. Threat of Substitutes
- 4.1.5. Competitive Rivalry
- 4.2. PESTEL analysis
- 4.3. BCG Analysis
- 4.3.1. Stars (High Growth, High Market Share)
- 4.3.2. Cash Cows (Low Growth, High Market Share)
- 4.3.3. Question Mark (High Growth, Low Market Share)
- 4.3.4. Dogs (Low Growth, Low Market Share)
- 4.4. Ansoff Matrix Analysis
- 4.5. Supply Chain Analysis
- 4.6. Regulatory Landscape
- 4.7. Current Market Potential and Opportunity Assessment (TAM–SAM–SOM Framework)
- 4.8. DMV Analyst Note
- 4.1. Porters Five Forces
- 5. Market Analysis, Insights and Forecast 2021-2033
- 5.1. Market Analysis, Insights and Forecast - by Component
- 5.1.1. Software
- 5.1.2. Services
- 5.2. Market Analysis, Insights and Forecast - by Mode of Delivery
- 5.2.1. On-premise
- 5.2.2. Cloud-based
- 5.3. Market Analysis, Insights and Forecast - by End User
- 5.3.1. Hospital
- 5.3.2. Clinic
- 5.3.3. Other End Users
- 5.4. Market Analysis, Insights and Forecast - by Region
- 5.4.1. North America
- 5.4.2. Europe
- 5.4.3. Asia Pacific
- 5.4.4. Middle East and Africa
- 5.4.5. South America
- 5.1. Market Analysis, Insights and Forecast - by Component
- 6. Global Lab Information System Market Analysis, Insights and Forecast, 2021-2033
- 6.1. Market Analysis, Insights and Forecast - by Component
- 6.1.1. Software
- 6.1.2. Services
- 6.2. Market Analysis, Insights and Forecast - by Mode of Delivery
- 6.2.1. On-premise
- 6.2.2. Cloud-based
- 6.3. Market Analysis, Insights and Forecast - by End User
- 6.3.1. Hospital
- 6.3.2. Clinic
- 6.3.3. Other End Users
- 6.1. Market Analysis, Insights and Forecast - by Component
- 7. North America Lab Information System Market Analysis, Insights and Forecast, 2020-2032
- 7.1. Market Analysis, Insights and Forecast - by Component
- 7.1.1. Software
- 7.1.2. Services
- 7.2. Market Analysis, Insights and Forecast - by Mode of Delivery
- 7.2.1. On-premise
- 7.2.2. Cloud-based
- 7.3. Market Analysis, Insights and Forecast - by End User
- 7.3.1. Hospital
- 7.3.2. Clinic
- 7.3.3. Other End Users
- 7.1. Market Analysis, Insights and Forecast - by Component
- 8. Europe Lab Information System Market Analysis, Insights and Forecast, 2020-2032
- 8.1. Market Analysis, Insights and Forecast - by Component
- 8.1.1. Software
- 8.1.2. Services
- 8.2. Market Analysis, Insights and Forecast - by Mode of Delivery
- 8.2.1. On-premise
- 8.2.2. Cloud-based
- 8.3. Market Analysis, Insights and Forecast - by End User
- 8.3.1. Hospital
- 8.3.2. Clinic
- 8.3.3. Other End Users
- 8.1. Market Analysis, Insights and Forecast - by Component
- 9. Asia Pacific Lab Information System Market Analysis, Insights and Forecast, 2020-2032
- 9.1. Market Analysis, Insights and Forecast - by Component
- 9.1.1. Software
- 9.1.2. Services
- 9.2. Market Analysis, Insights and Forecast - by Mode of Delivery
- 9.2.1. On-premise
- 9.2.2. Cloud-based
- 9.3. Market Analysis, Insights and Forecast - by End User
- 9.3.1. Hospital
- 9.3.2. Clinic
- 9.3.3. Other End Users
- 9.1. Market Analysis, Insights and Forecast - by Component
- 10. Middle East and Africa Lab Information System Market Analysis, Insights and Forecast, 2020-2032
- 10.1. Market Analysis, Insights and Forecast - by Component
- 10.1.1. Software
- 10.1.2. Services
- 10.2. Market Analysis, Insights and Forecast - by Mode of Delivery
- 10.2.1. On-premise
- 10.2.2. Cloud-based
- 10.3. Market Analysis, Insights and Forecast - by End User
- 10.3.1. Hospital
- 10.3.2. Clinic
- 10.3.3. Other End Users
- 10.1. Market Analysis, Insights and Forecast - by Component
- 11. South America Lab Information System Market Analysis, Insights and Forecast, 2020-2032
- 11.1. Market Analysis, Insights and Forecast - by Component
- 11.1.1. Software
- 11.1.2. Services
- 11.2. Market Analysis, Insights and Forecast - by Mode of Delivery
- 11.2.1. On-premise
- 11.2.2. Cloud-based
- 11.3. Market Analysis, Insights and Forecast - by End User
- 11.3.1. Hospital
- 11.3.2. Clinic
- 11.3.3. Other End Users
- 11.1. Market Analysis, Insights and Forecast - by Component
- 12. Competitive Analysis
- 12.1. Company Profiles
- 12.1.1 Comp Pro Med Inc
- 12.1.1.1. Company Overview
- 12.1.1.2. Products
- 12.1.1.3. Company Financials
- 12.1.1.4. SWOT Analysis
- 12.1.2 Epic Systems Corporation
- 12.1.2.1. Company Overview
- 12.1.2.2. Products
- 12.1.2.3. Company Financials
- 12.1.2.4. SWOT Analysis
- 12.1.3 Roper Technologies (Sunquest Information Systems Inc)
- 12.1.3.1. Company Overview
- 12.1.3.2. Products
- 12.1.3.3. Company Financials
- 12.1.3.4. SWOT Analysis
- 12.1.4 Margy Tech
- 12.1.4.1. Company Overview
- 12.1.4.2. Products
- 12.1.4.3. Company Financials
- 12.1.4.4. SWOT Analysis
- 12.1.5 Total Specific Solutions (TSS)
- 12.1.5.1. Company Overview
- 12.1.5.2. Products
- 12.1.5.3. Company Financials
- 12.1.5.4. SWOT Analysis
- 12.1.6 CliniSys Group Limited
- 12.1.6.1. Company Overview
- 12.1.6.2. Products
- 12.1.6.3. Company Financials
- 12.1.6.4. SWOT Analysis
- 12.1.7 XIFIN Inc
- 12.1.7.1. Company Overview
- 12.1.7.2. Products
- 12.1.7.3. Company Financials
- 12.1.7.4. SWOT Analysis
- 12.1.8 Cerner Corporation
- 12.1.8.1. Company Overview
- 12.1.8.2. Products
- 12.1.8.3. Company Financials
- 12.1.8.4. SWOT Analysis
- 12.1.9 Orchard Software Corporation
- 12.1.9.1. Company Overview
- 12.1.9.2. Products
- 12.1.9.3. Company Financials
- 12.1.9.4. SWOT Analysis
- 12.1.10 Sysmex Corporation
- 12.1.10.1. Company Overview
- 12.1.10.2. Products
- 12.1.10.3. Company Financials
- 12.1.10.4. SWOT Analysis
- 12.1.11 Cirdan Ltd
- 12.1.11.1. Company Overview
- 12.1.11.2. Products
- 12.1.11.3. Company Financials
- 12.1.11.4. SWOT Analysis
- 12.1.12 Biosero Inc
- 12.1.12.1. Company Overview
- 12.1.12.2. Products
- 12.1.12.3. Company Financials
- 12.1.12.4. SWOT Analysis
- 12.1.1 Comp Pro Med Inc
- 12.2. Market Entropy
- 12.2.1 Company's Key Areas Served
- 12.2.2 Recent Developments
- 12.3. Company Market Share Analysis 2025
- 12.3.1 Top 5 Companies Market Share Analysis
- 12.3.2 Top 3 Companies Market Share Analysis
- 12.4. List of Potential Customers
- 13. Research Methodology
List of Figures
- Figure 1: Global Lab Information System Market Revenue Breakdown (Million, %) by Region 2025 & 2033
- Figure 2: North America Lab Information System Market Revenue (Million), by Component 2025 & 2033
- Figure 3: North America Lab Information System Market Revenue Share (%), by Component 2025 & 2033
- Figure 4: North America Lab Information System Market Revenue (Million), by Mode of Delivery 2025 & 2033
- Figure 5: North America Lab Information System Market Revenue Share (%), by Mode of Delivery 2025 & 2033
- Figure 6: North America Lab Information System Market Revenue (Million), by End User 2025 & 2033
- Figure 7: North America Lab Information System Market Revenue Share (%), by End User 2025 & 2033
- Figure 8: North America Lab Information System Market Revenue (Million), by Country 2025 & 2033
- Figure 9: North America Lab Information System Market Revenue Share (%), by Country 2025 & 2033
- Figure 10: Europe Lab Information System Market Revenue (Million), by Component 2025 & 2033
- Figure 11: Europe Lab Information System Market Revenue Share (%), by Component 2025 & 2033
- Figure 12: Europe Lab Information System Market Revenue (Million), by Mode of Delivery 2025 & 2033
- Figure 13: Europe Lab Information System Market Revenue Share (%), by Mode of Delivery 2025 & 2033
- Figure 14: Europe Lab Information System Market Revenue (Million), by End User 2025 & 2033
- Figure 15: Europe Lab Information System Market Revenue Share (%), by End User 2025 & 2033
- Figure 16: Europe Lab Information System Market Revenue (Million), by Country 2025 & 2033
- Figure 17: Europe Lab Information System Market Revenue Share (%), by Country 2025 & 2033
- Figure 18: Asia Pacific Lab Information System Market Revenue (Million), by Component 2025 & 2033
- Figure 19: Asia Pacific Lab Information System Market Revenue Share (%), by Component 2025 & 2033
- Figure 20: Asia Pacific Lab Information System Market Revenue (Million), by Mode of Delivery 2025 & 2033
- Figure 21: Asia Pacific Lab Information System Market Revenue Share (%), by Mode of Delivery 2025 & 2033
- Figure 22: Asia Pacific Lab Information System Market Revenue (Million), by End User 2025 & 2033
- Figure 23: Asia Pacific Lab Information System Market Revenue Share (%), by End User 2025 & 2033
- Figure 24: Asia Pacific Lab Information System Market Revenue (Million), by Country 2025 & 2033
- Figure 25: Asia Pacific Lab Information System Market Revenue Share (%), by Country 2025 & 2033
- Figure 26: Middle East and Africa Lab Information System Market Revenue (Million), by Component 2025 & 2033
- Figure 27: Middle East and Africa Lab Information System Market Revenue Share (%), by Component 2025 & 2033
- Figure 28: Middle East and Africa Lab Information System Market Revenue (Million), by Mode of Delivery 2025 & 2033
- Figure 29: Middle East and Africa Lab Information System Market Revenue Share (%), by Mode of Delivery 2025 & 2033
- Figure 30: Middle East and Africa Lab Information System Market Revenue (Million), by End User 2025 & 2033
- Figure 31: Middle East and Africa Lab Information System Market Revenue Share (%), by End User 2025 & 2033
- Figure 32: Middle East and Africa Lab Information System Market Revenue (Million), by Country 2025 & 2033
- Figure 33: Middle East and Africa Lab Information System Market Revenue Share (%), by Country 2025 & 2033
- Figure 34: South America Lab Information System Market Revenue (Million), by Component 2025 & 2033
- Figure 35: South America Lab Information System Market Revenue Share (%), by Component 2025 & 2033
- Figure 36: South America Lab Information System Market Revenue (Million), by Mode of Delivery 2025 & 2033
- Figure 37: South America Lab Information System Market Revenue Share (%), by Mode of Delivery 2025 & 2033
- Figure 38: South America Lab Information System Market Revenue (Million), by End User 2025 & 2033
- Figure 39: South America Lab Information System Market Revenue Share (%), by End User 2025 & 2033
- Figure 40: South America Lab Information System Market Revenue (Million), by Country 2025 & 2033
- Figure 41: South America Lab Information System Market Revenue Share (%), by Country 2025 & 2033
List of Tables
- Table 1: Global Lab Information System Market Revenue Million Forecast, by Component 2020 & 2033
- Table 2: Global Lab Information System Market Revenue Million Forecast, by Mode of Delivery 2020 & 2033
- Table 3: Global Lab Information System Market Revenue Million Forecast, by End User 2020 & 2033
- Table 4: Global Lab Information System Market Revenue Million Forecast, by Region 2020 & 2033
- Table 5: Global Lab Information System Market Revenue Million Forecast, by Component 2020 & 2033
- Table 6: Global Lab Information System Market Revenue Million Forecast, by Mode of Delivery 2020 & 2033
- Table 7: Global Lab Information System Market Revenue Million Forecast, by End User 2020 & 2033
- Table 8: Global Lab Information System Market Revenue Million Forecast, by Country 2020 & 2033
- Table 9: United States Lab Information System Market Revenue (Million) Forecast, by Application 2020 & 2033
- Table 10: Canada Lab Information System Market Revenue (Million) Forecast, by Application 2020 & 2033
- Table 11: Mexico Lab Information System Market Revenue (Million) Forecast, by Application 2020 & 2033
- Table 12: Global Lab Information System Market Revenue Million Forecast, by Component 2020 & 2033
- Table 13: Global Lab Information System Market Revenue Million Forecast, by Mode of Delivery 2020 & 2033
- Table 14: Global Lab Information System Market Revenue Million Forecast, by End User 2020 & 2033
- Table 15: Global Lab Information System Market Revenue Million Forecast, by Country 2020 & 2033
- Table 16: Germany Lab Information System Market Revenue (Million) Forecast, by Application 2020 & 2033
- Table 17: United Kingdom Lab Information System Market Revenue (Million) Forecast, by Application 2020 & 2033
- Table 18: France Lab Information System Market Revenue (Million) Forecast, by Application 2020 & 2033
- Table 19: Italy Lab Information System Market Revenue (Million) Forecast, by Application 2020 & 2033
- Table 20: Spain Lab Information System Market Revenue (Million) Forecast, by Application 2020 & 2033
- Table 21: Rest of Europe Lab Information System Market Revenue (Million) Forecast, by Application 2020 & 2033
- Table 22: Global Lab Information System Market Revenue Million Forecast, by Component 2020 & 2033
- Table 23: Global Lab Information System Market Revenue Million Forecast, by Mode of Delivery 2020 & 2033
- Table 24: Global Lab Information System Market Revenue Million Forecast, by End User 2020 & 2033
- Table 25: Global Lab Information System Market Revenue Million Forecast, by Country 2020 & 2033
- Table 26: China Lab Information System Market Revenue (Million) Forecast, by Application 2020 & 2033
- Table 27: Japan Lab Information System Market Revenue (Million) Forecast, by Application 2020 & 2033
- Table 28: India Lab Information System Market Revenue (Million) Forecast, by Application 2020 & 2033
- Table 29: Australia Lab Information System Market Revenue (Million) Forecast, by Application 2020 & 2033
- Table 30: South Korea Lab Information System Market Revenue (Million) Forecast, by Application 2020 & 2033
- Table 31: Rest of Asia Pacific Lab Information System Market Revenue (Million) Forecast, by Application 2020 & 2033
- Table 32: Global Lab Information System Market Revenue Million Forecast, by Component 2020 & 2033
- Table 33: Global Lab Information System Market Revenue Million Forecast, by Mode of Delivery 2020 & 2033
- Table 34: Global Lab Information System Market Revenue Million Forecast, by End User 2020 & 2033
- Table 35: Global Lab Information System Market Revenue Million Forecast, by Country 2020 & 2033
- Table 36: GCC Lab Information System Market Revenue (Million) Forecast, by Application 2020 & 2033
- Table 37: South Africa Lab Information System Market Revenue (Million) Forecast, by Application 2020 & 2033
- Table 38: Rest of Middle East and Africa Lab Information System Market Revenue (Million) Forecast, by Application 2020 & 2033
- Table 39: Global Lab Information System Market Revenue Million Forecast, by Component 2020 & 2033
- Table 40: Global Lab Information System Market Revenue Million Forecast, by Mode of Delivery 2020 & 2033
- Table 41: Global Lab Information System Market Revenue Million Forecast, by End User 2020 & 2033
- Table 42: Global Lab Information System Market Revenue Million Forecast, by Country 2020 & 2033
- Table 43: Brazil Lab Information System Market Revenue (Million) Forecast, by Application 2020 & 2033
- Table 44: Argentina Lab Information System Market Revenue (Million) Forecast, by Application 2020 & 2033
- Table 45: Rest of South America Lab Information System Market Revenue (Million) Forecast, by Application 2020 & 2033
Frequently Asked Questions
1. What is the projected Compound Annual Growth Rate (CAGR) of the Lab Information System Market?
The projected CAGR is approximately 12.79%.
2. Which companies are prominent players in the Lab Information System Market?
Key companies in the market include Comp Pro Med Inc, Epic Systems Corporation, Roper Technologies (Sunquest Information Systems Inc), Margy Tech, Total Specific Solutions (TSS), CliniSys Group Limited, XIFIN Inc, Cerner Corporation, Orchard Software Corporation, Sysmex Corporation, Cirdan Ltd, Biosero Inc.
3. What are the main segments of the Lab Information System Market?
The market segments include Component, Mode of Delivery, End User.
4. Can you provide details about the market size?
The market size is estimated to be USD 3.49 Million as of 2022.
5. What are some drivers contributing to market growth?
Rising Demand for Bio-banking; Increasing Focus on Improvisation of Laboratory; Technological Advancements in LIMS Offerings.
6. What are the notable trends driving market growth?
Cloud-based Segment is Expected to Hold a Major Market Share in the Laboratory Information System Market.
7. Are there any restraints impacting market growth?
Cost Associated with Implementation of Laboratory Information Management System; Rising Data Security and Privacy Concerns.
8. Can you provide examples of recent developments in the market?
In February 2022, Roche Diagnostics China entered China with Sanomede Medical Technology Co., Ltd. to jointly launch RS600 Lab Automation Software (LAS) for the Chinese Market.
9. What pricing options are available for accessing the report?
Pricing options include single-user, multi-user, and enterprise licenses priced at USD 4750, USD 5250, and USD 8750 respectively.
10. Is the market size provided in terms of value or volume?
The market size is provided in terms of value, measured in Million.
11. Are there any specific market keywords associated with the report?
Yes, the market keyword associated with the report is "Lab Information System Market," which aids in identifying and referencing the specific market segment covered.
12. How do I determine which pricing option suits my needs best?
The pricing options vary based on user requirements and access needs. Individual users may opt for single-user licenses, while businesses requiring broader access may choose multi-user or enterprise licenses for cost-effective access to the report.
13. Are there any additional resources or data provided in the Lab Information System Market report?
While the report offers comprehensive insights, it's advisable to review the specific contents or supplementary materials provided to ascertain if additional resources or data are available.
14. How can I stay updated on further developments or reports in the Lab Information System Market?
To stay informed about further developments, trends, and reports in the Lab Information System Market, consider subscribing to industry newsletters, following relevant companies and organizations, or regularly checking reputable industry news sources and publications.
Methodology
Step 1 - Identification of Relevant Samples Size from Population Database


Step 2 - Approaches for Defining Global Market Size (Value, Volume* & Price*)

Note*: In applicable scenarios
Step 3 - Data Sources
Primary Research
- Web Analytics
- Survey Reports
- Research Institute
- Latest Research Reports
- Opinion Leaders
Secondary Research
- Annual Reports
- White Paper
- Latest Press Release
- Industry Association
- Paid Database
- Investor Presentations

Step 4 - Data Triangulation
Involves using different sources of information in order to increase the validity of a study
These sources are likely to be stakeholders in a program - participants, other researchers, program staff, other community members, and so on.
Then we put all data in single framework & apply various statistical tools to find out the dynamic on the market.
During the analysis stage, feedback from the stakeholder groups would be compared to determine areas of agreement as well as areas of divergence