

Key Insights
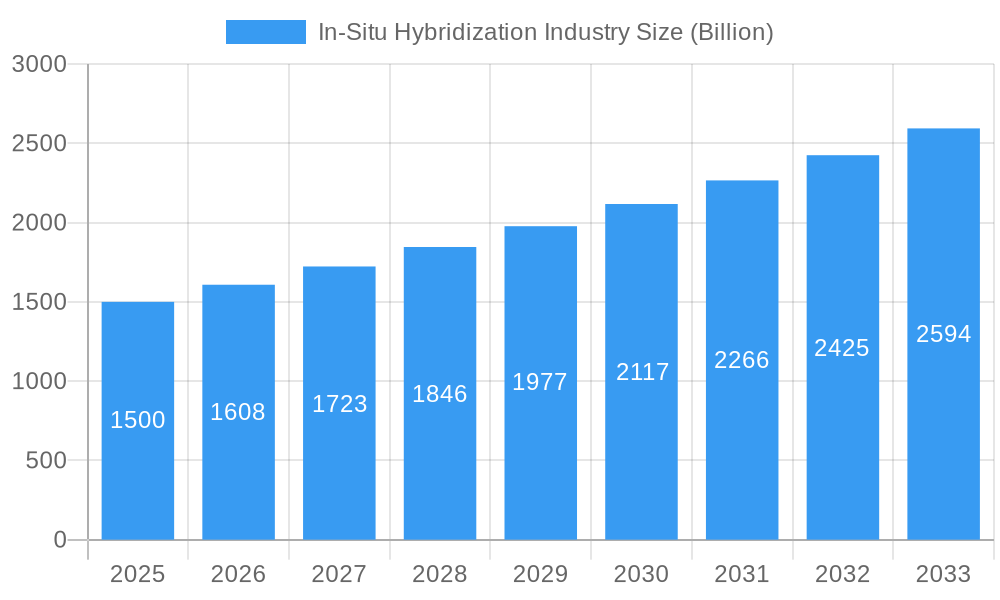
The In-Situ Hybridization (ISH) market, valued at $1.5 billion in 2025, is projected to experience robust growth, driven by the increasing prevalence of cancer and infectious diseases, advances in molecular diagnostic techniques, and the rising demand for personalized medicine. The market's Compound Annual Growth Rate (CAGR) of 7.2% from 2025 to 2033 indicates a significant expansion, with substantial opportunities across various segments. Analytical instruments and kits/reagents dominate the product segment, reflecting the critical role of these tools in ISH procedures. Fluorescence In Situ Hybridization (FISH) currently holds the largest share among techniques due to its high sensitivity and specificity, but chromogenic ISH (CISH) is witnessing increasing adoption due to its cost-effectiveness and ease of use. Cancer diagnostics represents the largest application segment, followed by infectious disease diagnostics, reflecting the widespread use of ISH in these areas. Diagnostics laboratories are the primary end-users, although academic and research institutions, along with Contract Research Organizations (CROs), also contribute significantly to market demand. Geographic growth is expected to be strongest in Asia-Pacific, driven by increasing healthcare spending and rising awareness of advanced diagnostic techniques in rapidly developing economies such as China and India.
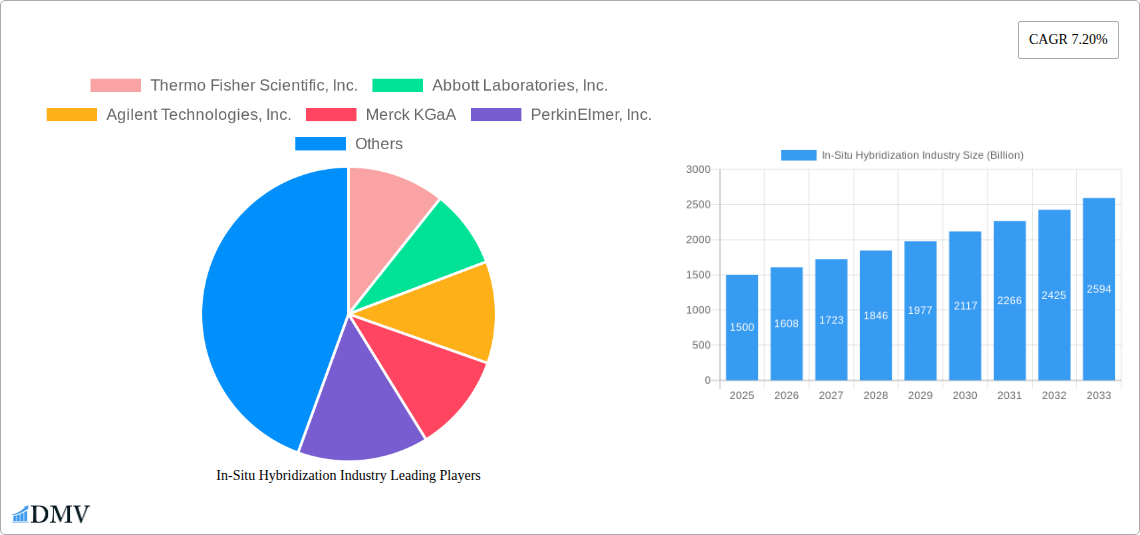
In-Situ Hybridization Industry Market Size (In Billion)
The competitive landscape is characterized by both large multinational corporations and specialized biotechnology companies. Key players like Thermo Fisher Scientific, Abbott Laboratories, and Agilent Technologies leverage their established infrastructure and broad product portfolios to maintain a strong market presence. However, smaller players are also innovating in areas such as novel probe development and automated ISH platforms, creating a dynamic market with both established and emerging players vying for market share. Future growth will likely be influenced by factors such as the development of more sensitive and specific ISH assays, advancements in automation and data analysis, and increasing regulatory approvals for new ISH-based diagnostic tests. Despite the positive outlook, potential restraints include the high cost of ISH testing, the need for skilled personnel for accurate interpretation of results, and the potential for variability in test performance across different laboratories. Addressing these challenges will be critical for sustaining the market's long-term growth trajectory.
In-Situ Hybridization Industry Company Market Share
In-Situ Hybridization Industry Market Report: A Billion-Dollar Growth Forecast (2019-2033)
This comprehensive report provides an in-depth analysis of the In-Situ Hybridization (ISH) industry, projecting a market valuation exceeding $XX Billion by 2033. It covers the historical period (2019-2024), base year (2025), and forecast period (2025-2033), offering crucial insights for stakeholders seeking to navigate this rapidly evolving landscape. The report delves into market segmentation, key players, technological advancements, and future opportunities, empowering informed decision-making across the entire value chain.
In-Situ Hybridization Industry Market Composition & Trends
This section evaluates the competitive landscape, innovation drivers, regulatory environment, and market dynamics of the In-Situ Hybridization (ISH) industry. The market is characterized by a moderately consolidated structure with key players like Thermo Fisher Scientific, Inc., Abbott Laboratories, Inc., Agilent Technologies, Inc., Merck KGaA, PerkinElmer, Inc., Bio-Rad Laboratories, Inc., F. Hoffmann-La Roche Ltd, Danaher Corporation, Abnova Corporation, and BioGenex Laboratories holding significant market share. The exact distribution is dynamic and requires further detailed analysis, but it is estimated that the top 5 companies hold approximately xx% of the market in 2025.
- Market Concentration: Moderately consolidated, with a few major players dominating. Further analysis reveals a concentration ratio of xx% for the top 5 players in 2025.
- Innovation Catalysts: Advancements in fluorescence and chromogenic technologies, coupled with the development of high-throughput platforms, are driving growth.
- Regulatory Landscape: Stringent regulatory approvals for diagnostic applications influence market entry and adoption. Variances across global jurisdictions require region-specific analysis.
- Substitute Products: Limited direct substitutes exist, but emerging technologies such as next-generation sequencing pose a potential threat.
- End-User Profiles: Diagnostics laboratories, academic and research institutions, and contract research organizations (CROs) are the primary end-users.
- M&A Activities: Significant M&A activity has been observed in the recent past. Total deal value is estimated at $XX Billion over the period from 2019-2024. This includes both large-scale acquisitions and strategic partnerships. However, precise figures are unavailable and require further research.
In-Situ Hybridization Industry Evolution
The In-Situ Hybridization market demonstrates significant growth from 2019-2024, expanding at a Compound Annual Growth Rate (CAGR) of xx%. This expansion is fuelled by several factors including technological advancements leading to higher sensitivity and specificity of assays, increased adoption in cancer diagnostics and research, expansion into new applications such as infectious disease diagnostics, and strategic partnerships and acquisitions within the industry. The shift towards personalized medicine is also a contributing factor to this growth.
The introduction of high-throughput platforms and automated workflows enhances efficiency and reduces turnaround time. This increases the appeal to large diagnostic laboratories and CROs. Consumer demand is shifting toward more sophisticated and automated solutions. Growth projections for the forecast period (2025-2033) indicate a CAGR of approximately xx%, driven by an increase in cancer prevalence, government funding towards research, and the development of novel ISH techniques. The increasing demand for point-of-care diagnostics also presents opportunities for miniaturized and portable ISH systems. Further investigation into the adoption rates of specific technologies is required for a more precise forecast. However, the market is expected to reach $XX Billion by 2033.
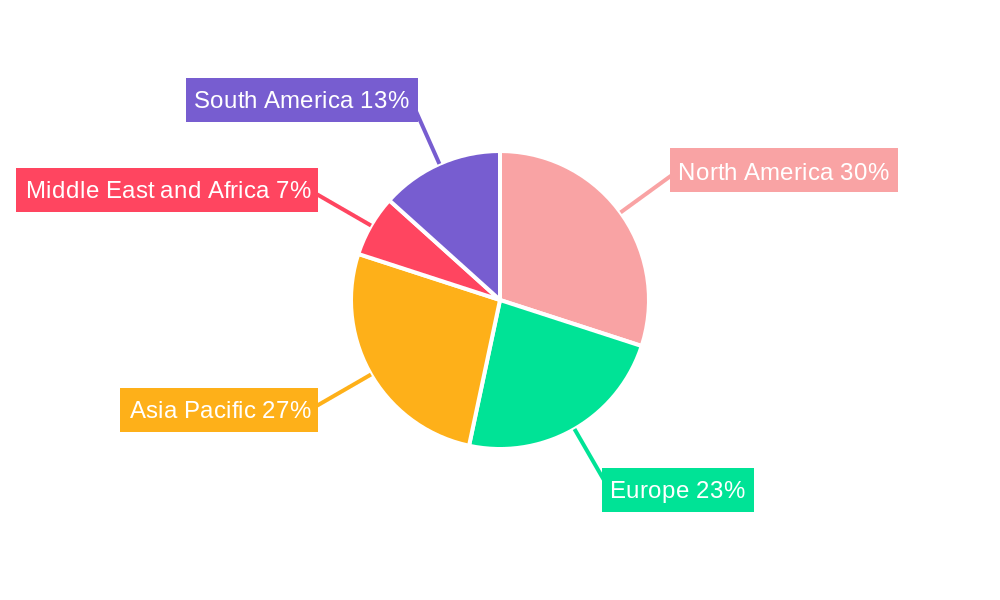
Leading Regions, Countries, or Segments in In-Situ Hybridization Industry
North America currently holds the largest market share in the In-Situ Hybridization industry, driven by substantial investments in research and development, robust healthcare infrastructure, and the high prevalence of chronic diseases like cancer. Europe follows closely, with a significant market share attributed to well-established healthcare systems and strong government support for research initiatives.
- Key Drivers:
- High prevalence of target diseases (Cancer, Infectious Diseases)
- Extensive R&D investments
- Favorable regulatory frameworks
- Growing adoption of advanced technologies
Segment Analysis:
- Product: Kits and reagents currently hold the largest market share due to high demand across various applications. Analytical instruments and software & services segments are also experiencing significant growth.
- Technique: Fluorescence In Situ Hybridization (FISH) dominates the technique segment due to its high sensitivity and versatility. Chromogenic In Situ Hybridization (CISH) is growing steadily due to its cost-effectiveness.
- Application: Cancer diagnostics account for the largest share of the application segment, driven by the high prevalence of cancer and the growing need for early diagnosis.
- End User: Diagnostic laboratories constitute the major end-user segment owing to high demand for ISH assays. Academic and Research Institutions and CROs are also significant contributors to market growth. More detailed regional analysis is required to determine dominant market segments by region and country.
In-Situ Hybridization Industry Product Innovations
Recent innovations in ISH technology focus on enhancing sensitivity, throughput, and multiplexing capabilities. Advanced fluorescent probes, automated staining platforms, and sophisticated image analysis software are revolutionizing the field. The introduction of technologies such as MERFISH allows for the simultaneous detection of multiple RNA and protein targets, providing richer insights into cellular processes. Unique selling propositions include faster turnaround times, increased accuracy, and streamlined workflows, all contributing to improved diagnostic capabilities and accelerating research efforts. This continues to drive market growth.
Propelling Factors for In-Situ Hybridization Industry Growth
Several factors are driving the growth of the In-Situ Hybridization market. Technological advancements, such as the development of improved probes and automated platforms, are significantly enhancing the efficiency and accuracy of ISH assays. The increasing prevalence of diseases such as cancer and infectious diseases is boosting the demand for ISH-based diagnostics. Furthermore, government funding and supportive regulatory frameworks are creating a favorable environment for market expansion.
Obstacles in the In-Situ Hybridization Industry Market
Despite the strong growth trajectory, the In-Situ Hybridization market faces challenges. High costs associated with specialized equipment and reagents can limit accessibility, especially in resource-constrained settings. Supply chain disruptions can affect the availability of essential components, impacting the production and delivery of ISH products. The emergence of competing technologies, such as next-generation sequencing, could also present challenges to future growth. These factors could cause a potential reduction in CAGR by xx% in specific regions or segments.
Future Opportunities in In-Situ Hybridization Industry
Future opportunities lie in developing cost-effective, point-of-care ISH assays, expanding into new application areas such as personalized medicine and pharmacogenomics, and creating integrated solutions that combine ISH with other advanced technologies like next-generation sequencing. Developing user-friendly software and AI-based image analysis tools will streamline workflow, further expanding the market's potential.
Major Players in the In-Situ Hybridization Industry Ecosystem
- Thermo Fisher Scientific, Inc.
- Abbott Laboratories, Inc.
- Agilent Technologies, Inc.
- Merck KGaA
- PerkinElmer, Inc.
- Bio-Rad Laboratories, Inc.
- F. Hoffmann-La Roche Ltd
- Danaher Corporation
- Abnova Corporation
- BioGenex Laboratories
Key Developments in In-Situ Hybridization Industry Industry
- September 2022: Vizgen launched Merscope Protein co-detection kits, enabling the measurement of subcellular spatial multi-omics. This significantly enhances the capabilities of MERFISH, offering more comprehensive data analysis.
- May 2022: Leica Biosystems launched a high-speed in situ hybridization staining platform, improving workflow efficiency and flexibility for laboratories. This enhances accessibility and throughput, impacting market competitiveness.
Strategic In-Situ Hybridization Industry Market Forecast
The In-Situ Hybridization market is poised for sustained growth, driven by technological advancements, increased demand from expanding applications, and favorable regulatory environments. The development of novel ISH techniques and high-throughput platforms will further enhance market penetration. The increasing focus on personalized medicine and the growing prevalence of chronic diseases are expected to fuel market growth over the forecast period, ultimately leading to a market value exceeding $XX Billion by 2033.
In-Situ Hybridization Industry Segmentation
-
1. Product
- 1.1. Analytical Instruments
- 1.2. Kits and Reagents
- 1.3. Software and Services
- 1.4. Other Products
-
2. Technique
- 2.1. Fluoresence In Situ Hybridization (FISH)
- 2.2. Chromogenic In Situ hybridization (CISH)
-
3. Application
- 3.1. Cancer
- 3.2. Infectious Diseases
- 3.3. Others
-
4. End User
- 4.1. Diagnostics Laboratories
- 4.2. Academic and Research Institutions
- 4.3. Contract Research Organizations (CROs)
In-Situ Hybridization Industry Segmentation By Geography
-
1. North America
- 1.1. United States
- 1.2. Canada
- 1.3. Mexico
-
2. Europe
- 2.1. Germany
- 2.2. United Kingdom
- 2.3. France
- 2.4. Italy
- 2.5. Spain
- 2.6. Rest of Europe
-
3. Asia Pacific
- 3.1. China
- 3.2. Japan
- 3.3. India
- 3.4. Australia
- 3.5. South Korea
- 3.6. Rest of Asia Pacific
-
4. Middle East and Africa
- 4.1. GCC
- 4.2. South Africa
- 4.3. Rest of Middle East and Africa
-
5. South America
- 5.1. Brazil
- 5.2. Argentina
- 5.3. Rest of South America
In-Situ Hybridization Industry Regional Market Share
Geographic Coverage of In-Situ Hybridization Industry
In-Situ Hybridization Industry REPORT HIGHLIGHTS
| Aspects | Details |
|---|---|
| Study Period | 2020-2034 |
| Base Year | 2025 |
| Estimated Year | 2026 |
| Forecast Period | 2026-2034 |
| Historical Period | 2020-2025 |
| Growth Rate | CAGR of 7.20% from 2020-2034 |
| Segmentation |
|
Table of Contents
- 1. Introduction
- 1.1. Research Scope
- 1.2. Market Segmentation
- 1.3. Research Objective
- 1.4. Definitions and Assumptions
- 2. Executive Summary
- 2.1. Market Snapshot
- 3. Market Dynamics
- 3.1. Market Drivers
- 3.2. Market Restrains
- 3.3. Market Trends
- 3.4. Market Opportunities
- 4. Market Factor Analysis
- 4.1. Porters Five Forces
- 4.1.1. Bargaining Power of Suppliers
- 4.1.2. Bargaining Power of Buyers
- 4.1.3. Threat of New Entrants
- 4.1.4. Threat of Substitutes
- 4.1.5. Competitive Rivalry
- 4.2. PESTEL analysis
- 4.3. BCG Analysis
- 4.3.1. Stars (High Growth, High Market Share)
- 4.3.2. Cash Cows (Low Growth, High Market Share)
- 4.3.3. Question Mark (High Growth, Low Market Share)
- 4.3.4. Dogs (Low Growth, Low Market Share)
- 4.4. Ansoff Matrix Analysis
- 4.5. Supply Chain Analysis
- 4.6. Regulatory Landscape
- 4.7. Current Market Potential and Opportunity Assessment (TAM–SAM–SOM Framework)
- 4.8. DMV Analyst Note
- 4.1. Porters Five Forces
- 5. Market Analysis, Insights and Forecast 2021-2033
- 5.1. Market Analysis, Insights and Forecast - by Product
- 5.1.1. Analytical Instruments
- 5.1.2. Kits and Reagents
- 5.1.3. Software and Services
- 5.1.4. Other Products
- 5.2. Market Analysis, Insights and Forecast - by Technique
- 5.2.1. Fluoresence In Situ Hybridization (FISH)
- 5.2.2. Chromogenic In Situ hybridization (CISH)
- 5.3. Market Analysis, Insights and Forecast - by Application
- 5.3.1. Cancer
- 5.3.2. Infectious Diseases
- 5.3.3. Others
- 5.4. Market Analysis, Insights and Forecast - by End User
- 5.4.1. Diagnostics Laboratories
- 5.4.2. Academic and Research Institutions
- 5.4.3. Contract Research Organizations (CROs)
- 5.5. Market Analysis, Insights and Forecast - by Region
- 5.5.1. North America
- 5.5.2. Europe
- 5.5.3. Asia Pacific
- 5.5.4. Middle East and Africa
- 5.5.5. South America
- 5.1. Market Analysis, Insights and Forecast - by Product
- 6. Global In-Situ Hybridization Industry Analysis, Insights and Forecast, 2021-2033
- 6.1. Market Analysis, Insights and Forecast - by Product
- 6.1.1. Analytical Instruments
- 6.1.2. Kits and Reagents
- 6.1.3. Software and Services
- 6.1.4. Other Products
- 6.2. Market Analysis, Insights and Forecast - by Technique
- 6.2.1. Fluoresence In Situ Hybridization (FISH)
- 6.2.2. Chromogenic In Situ hybridization (CISH)
- 6.3. Market Analysis, Insights and Forecast - by Application
- 6.3.1. Cancer
- 6.3.2. Infectious Diseases
- 6.3.3. Others
- 6.4. Market Analysis, Insights and Forecast - by End User
- 6.4.1. Diagnostics Laboratories
- 6.4.2. Academic and Research Institutions
- 6.4.3. Contract Research Organizations (CROs)
- 6.1. Market Analysis, Insights and Forecast - by Product
- 7. North America In-Situ Hybridization Industry Analysis, Insights and Forecast, 2020-2032
- 7.1. Market Analysis, Insights and Forecast - by Product
- 7.1.1. Analytical Instruments
- 7.1.2. Kits and Reagents
- 7.1.3. Software and Services
- 7.1.4. Other Products
- 7.2. Market Analysis, Insights and Forecast - by Technique
- 7.2.1. Fluoresence In Situ Hybridization (FISH)
- 7.2.2. Chromogenic In Situ hybridization (CISH)
- 7.3. Market Analysis, Insights and Forecast - by Application
- 7.3.1. Cancer
- 7.3.2. Infectious Diseases
- 7.3.3. Others
- 7.4. Market Analysis, Insights and Forecast - by End User
- 7.4.1. Diagnostics Laboratories
- 7.4.2. Academic and Research Institutions
- 7.4.3. Contract Research Organizations (CROs)
- 7.1. Market Analysis, Insights and Forecast - by Product
- 8. Europe In-Situ Hybridization Industry Analysis, Insights and Forecast, 2020-2032
- 8.1. Market Analysis, Insights and Forecast - by Product
- 8.1.1. Analytical Instruments
- 8.1.2. Kits and Reagents
- 8.1.3. Software and Services
- 8.1.4. Other Products
- 8.2. Market Analysis, Insights and Forecast - by Technique
- 8.2.1. Fluoresence In Situ Hybridization (FISH)
- 8.2.2. Chromogenic In Situ hybridization (CISH)
- 8.3. Market Analysis, Insights and Forecast - by Application
- 8.3.1. Cancer
- 8.3.2. Infectious Diseases
- 8.3.3. Others
- 8.4. Market Analysis, Insights and Forecast - by End User
- 8.4.1. Diagnostics Laboratories
- 8.4.2. Academic and Research Institutions
- 8.4.3. Contract Research Organizations (CROs)
- 8.1. Market Analysis, Insights and Forecast - by Product
- 9. Asia Pacific In-Situ Hybridization Industry Analysis, Insights and Forecast, 2020-2032
- 9.1. Market Analysis, Insights and Forecast - by Product
- 9.1.1. Analytical Instruments
- 9.1.2. Kits and Reagents
- 9.1.3. Software and Services
- 9.1.4. Other Products
- 9.2. Market Analysis, Insights and Forecast - by Technique
- 9.2.1. Fluoresence In Situ Hybridization (FISH)
- 9.2.2. Chromogenic In Situ hybridization (CISH)
- 9.3. Market Analysis, Insights and Forecast - by Application
- 9.3.1. Cancer
- 9.3.2. Infectious Diseases
- 9.3.3. Others
- 9.4. Market Analysis, Insights and Forecast - by End User
- 9.4.1. Diagnostics Laboratories
- 9.4.2. Academic and Research Institutions
- 9.4.3. Contract Research Organizations (CROs)
- 9.1. Market Analysis, Insights and Forecast - by Product
- 10. Middle East and Africa In-Situ Hybridization Industry Analysis, Insights and Forecast, 2020-2032
- 10.1. Market Analysis, Insights and Forecast - by Product
- 10.1.1. Analytical Instruments
- 10.1.2. Kits and Reagents
- 10.1.3. Software and Services
- 10.1.4. Other Products
- 10.2. Market Analysis, Insights and Forecast - by Technique
- 10.2.1. Fluoresence In Situ Hybridization (FISH)
- 10.2.2. Chromogenic In Situ hybridization (CISH)
- 10.3. Market Analysis, Insights and Forecast - by Application
- 10.3.1. Cancer
- 10.3.2. Infectious Diseases
- 10.3.3. Others
- 10.4. Market Analysis, Insights and Forecast - by End User
- 10.4.1. Diagnostics Laboratories
- 10.4.2. Academic and Research Institutions
- 10.4.3. Contract Research Organizations (CROs)
- 10.1. Market Analysis, Insights and Forecast - by Product
- 11. South America In-Situ Hybridization Industry Analysis, Insights and Forecast, 2020-2032
- 11.1. Market Analysis, Insights and Forecast - by Product
- 11.1.1. Analytical Instruments
- 11.1.2. Kits and Reagents
- 11.1.3. Software and Services
- 11.1.4. Other Products
- 11.2. Market Analysis, Insights and Forecast - by Technique
- 11.2.1. Fluoresence In Situ Hybridization (FISH)
- 11.2.2. Chromogenic In Situ hybridization (CISH)
- 11.3. Market Analysis, Insights and Forecast - by Application
- 11.3.1. Cancer
- 11.3.2. Infectious Diseases
- 11.3.3. Others
- 11.4. Market Analysis, Insights and Forecast - by End User
- 11.4.1. Diagnostics Laboratories
- 11.4.2. Academic and Research Institutions
- 11.4.3. Contract Research Organizations (CROs)
- 11.1. Market Analysis, Insights and Forecast - by Product
- 12. Competitive Analysis
- 12.1. Company Profiles
- 12.1.1 Thermo Fisher Scientific Inc.
- 12.1.1.1. Company Overview
- 12.1.1.2. Products
- 12.1.1.3. Company Financials
- 12.1.1.4. SWOT Analysis
- 12.1.2 Abbott Laboratories Inc.
- 12.1.2.1. Company Overview
- 12.1.2.2. Products
- 12.1.2.3. Company Financials
- 12.1.2.4. SWOT Analysis
- 12.1.3 Agilent Technologies Inc.
- 12.1.3.1. Company Overview
- 12.1.3.2. Products
- 12.1.3.3. Company Financials
- 12.1.3.4. SWOT Analysis
- 12.1.4 Merck KGaA
- 12.1.4.1. Company Overview
- 12.1.4.2. Products
- 12.1.4.3. Company Financials
- 12.1.4.4. SWOT Analysis
- 12.1.5 PerkinElmer Inc.
- 12.1.5.1. Company Overview
- 12.1.5.2. Products
- 12.1.5.3. Company Financials
- 12.1.5.4. SWOT Analysis
- 12.1.6 Bio-Rad Laboratories Inc.
- 12.1.6.1. Company Overview
- 12.1.6.2. Products
- 12.1.6.3. Company Financials
- 12.1.6.4. SWOT Analysis
- 12.1.7 F. Hoffmann-La Roche Ltd
- 12.1.7.1. Company Overview
- 12.1.7.2. Products
- 12.1.7.3. Company Financials
- 12.1.7.4. SWOT Analysis
- 12.1.8 Danaher Corporation
- 12.1.8.1. Company Overview
- 12.1.8.2. Products
- 12.1.8.3. Company Financials
- 12.1.8.4. SWOT Analysis
- 12.1.9 Abnova Corporation
- 12.1.9.1. Company Overview
- 12.1.9.2. Products
- 12.1.9.3. Company Financials
- 12.1.9.4. SWOT Analysis
- 12.1.10 BioGenex Laboratories
- 12.1.10.1. Company Overview
- 12.1.10.2. Products
- 12.1.10.3. Company Financials
- 12.1.10.4. SWOT Analysis
- 12.1.1 Thermo Fisher Scientific Inc.
- 12.2. Market Entropy
- 12.2.1 Company's Key Areas Served
- 12.2.2 Recent Developments
- 12.3. Company Market Share Analysis 2025
- 12.3.1 Top 5 Companies Market Share Analysis
- 12.3.2 Top 3 Companies Market Share Analysis
- 12.4. List of Potential Customers
- 13. Research Methodology
List of Figures
- Figure 1: Global In-Situ Hybridization Industry Revenue Breakdown (Billion, %) by Region 2025 & 2033
- Figure 2: North America In-Situ Hybridization Industry Revenue (Billion), by Product 2025 & 2033
- Figure 3: North America In-Situ Hybridization Industry Revenue Share (%), by Product 2025 & 2033
- Figure 4: North America In-Situ Hybridization Industry Revenue (Billion), by Technique 2025 & 2033
- Figure 5: North America In-Situ Hybridization Industry Revenue Share (%), by Technique 2025 & 2033
- Figure 6: North America In-Situ Hybridization Industry Revenue (Billion), by Application 2025 & 2033
- Figure 7: North America In-Situ Hybridization Industry Revenue Share (%), by Application 2025 & 2033
- Figure 8: North America In-Situ Hybridization Industry Revenue (Billion), by End User 2025 & 2033
- Figure 9: North America In-Situ Hybridization Industry Revenue Share (%), by End User 2025 & 2033
- Figure 10: North America In-Situ Hybridization Industry Revenue (Billion), by Country 2025 & 2033
- Figure 11: North America In-Situ Hybridization Industry Revenue Share (%), by Country 2025 & 2033
- Figure 12: Europe In-Situ Hybridization Industry Revenue (Billion), by Product 2025 & 2033
- Figure 13: Europe In-Situ Hybridization Industry Revenue Share (%), by Product 2025 & 2033
- Figure 14: Europe In-Situ Hybridization Industry Revenue (Billion), by Technique 2025 & 2033
- Figure 15: Europe In-Situ Hybridization Industry Revenue Share (%), by Technique 2025 & 2033
- Figure 16: Europe In-Situ Hybridization Industry Revenue (Billion), by Application 2025 & 2033
- Figure 17: Europe In-Situ Hybridization Industry Revenue Share (%), by Application 2025 & 2033
- Figure 18: Europe In-Situ Hybridization Industry Revenue (Billion), by End User 2025 & 2033
- Figure 19: Europe In-Situ Hybridization Industry Revenue Share (%), by End User 2025 & 2033
- Figure 20: Europe In-Situ Hybridization Industry Revenue (Billion), by Country 2025 & 2033
- Figure 21: Europe In-Situ Hybridization Industry Revenue Share (%), by Country 2025 & 2033
- Figure 22: Asia Pacific In-Situ Hybridization Industry Revenue (Billion), by Product 2025 & 2033
- Figure 23: Asia Pacific In-Situ Hybridization Industry Revenue Share (%), by Product 2025 & 2033
- Figure 24: Asia Pacific In-Situ Hybridization Industry Revenue (Billion), by Technique 2025 & 2033
- Figure 25: Asia Pacific In-Situ Hybridization Industry Revenue Share (%), by Technique 2025 & 2033
- Figure 26: Asia Pacific In-Situ Hybridization Industry Revenue (Billion), by Application 2025 & 2033
- Figure 27: Asia Pacific In-Situ Hybridization Industry Revenue Share (%), by Application 2025 & 2033
- Figure 28: Asia Pacific In-Situ Hybridization Industry Revenue (Billion), by End User 2025 & 2033
- Figure 29: Asia Pacific In-Situ Hybridization Industry Revenue Share (%), by End User 2025 & 2033
- Figure 30: Asia Pacific In-Situ Hybridization Industry Revenue (Billion), by Country 2025 & 2033
- Figure 31: Asia Pacific In-Situ Hybridization Industry Revenue Share (%), by Country 2025 & 2033
- Figure 32: Middle East and Africa In-Situ Hybridization Industry Revenue (Billion), by Product 2025 & 2033
- Figure 33: Middle East and Africa In-Situ Hybridization Industry Revenue Share (%), by Product 2025 & 2033
- Figure 34: Middle East and Africa In-Situ Hybridization Industry Revenue (Billion), by Technique 2025 & 2033
- Figure 35: Middle East and Africa In-Situ Hybridization Industry Revenue Share (%), by Technique 2025 & 2033
- Figure 36: Middle East and Africa In-Situ Hybridization Industry Revenue (Billion), by Application 2025 & 2033
- Figure 37: Middle East and Africa In-Situ Hybridization Industry Revenue Share (%), by Application 2025 & 2033
- Figure 38: Middle East and Africa In-Situ Hybridization Industry Revenue (Billion), by End User 2025 & 2033
- Figure 39: Middle East and Africa In-Situ Hybridization Industry Revenue Share (%), by End User 2025 & 2033
- Figure 40: Middle East and Africa In-Situ Hybridization Industry Revenue (Billion), by Country 2025 & 2033
- Figure 41: Middle East and Africa In-Situ Hybridization Industry Revenue Share (%), by Country 2025 & 2033
- Figure 42: South America In-Situ Hybridization Industry Revenue (Billion), by Product 2025 & 2033
- Figure 43: South America In-Situ Hybridization Industry Revenue Share (%), by Product 2025 & 2033
- Figure 44: South America In-Situ Hybridization Industry Revenue (Billion), by Technique 2025 & 2033
- Figure 45: South America In-Situ Hybridization Industry Revenue Share (%), by Technique 2025 & 2033
- Figure 46: South America In-Situ Hybridization Industry Revenue (Billion), by Application 2025 & 2033
- Figure 47: South America In-Situ Hybridization Industry Revenue Share (%), by Application 2025 & 2033
- Figure 48: South America In-Situ Hybridization Industry Revenue (Billion), by End User 2025 & 2033
- Figure 49: South America In-Situ Hybridization Industry Revenue Share (%), by End User 2025 & 2033
- Figure 50: South America In-Situ Hybridization Industry Revenue (Billion), by Country 2025 & 2033
- Figure 51: South America In-Situ Hybridization Industry Revenue Share (%), by Country 2025 & 2033
List of Tables
- Table 1: Global In-Situ Hybridization Industry Revenue Billion Forecast, by Product 2020 & 2033
- Table 2: Global In-Situ Hybridization Industry Revenue Billion Forecast, by Technique 2020 & 2033
- Table 3: Global In-Situ Hybridization Industry Revenue Billion Forecast, by Application 2020 & 2033
- Table 4: Global In-Situ Hybridization Industry Revenue Billion Forecast, by End User 2020 & 2033
- Table 5: Global In-Situ Hybridization Industry Revenue Billion Forecast, by Region 2020 & 2033
- Table 6: Global In-Situ Hybridization Industry Revenue Billion Forecast, by Product 2020 & 2033
- Table 7: Global In-Situ Hybridization Industry Revenue Billion Forecast, by Technique 2020 & 2033
- Table 8: Global In-Situ Hybridization Industry Revenue Billion Forecast, by Application 2020 & 2033
- Table 9: Global In-Situ Hybridization Industry Revenue Billion Forecast, by End User 2020 & 2033
- Table 10: Global In-Situ Hybridization Industry Revenue Billion Forecast, by Country 2020 & 2033
- Table 11: United States In-Situ Hybridization Industry Revenue (Billion) Forecast, by Application 2020 & 2033
- Table 12: Canada In-Situ Hybridization Industry Revenue (Billion) Forecast, by Application 2020 & 2033
- Table 13: Mexico In-Situ Hybridization Industry Revenue (Billion) Forecast, by Application 2020 & 2033
- Table 14: Global In-Situ Hybridization Industry Revenue Billion Forecast, by Product 2020 & 2033
- Table 15: Global In-Situ Hybridization Industry Revenue Billion Forecast, by Technique 2020 & 2033
- Table 16: Global In-Situ Hybridization Industry Revenue Billion Forecast, by Application 2020 & 2033
- Table 17: Global In-Situ Hybridization Industry Revenue Billion Forecast, by End User 2020 & 2033
- Table 18: Global In-Situ Hybridization Industry Revenue Billion Forecast, by Country 2020 & 2033
- Table 19: Germany In-Situ Hybridization Industry Revenue (Billion) Forecast, by Application 2020 & 2033
- Table 20: United Kingdom In-Situ Hybridization Industry Revenue (Billion) Forecast, by Application 2020 & 2033
- Table 21: France In-Situ Hybridization Industry Revenue (Billion) Forecast, by Application 2020 & 2033
- Table 22: Italy In-Situ Hybridization Industry Revenue (Billion) Forecast, by Application 2020 & 2033
- Table 23: Spain In-Situ Hybridization Industry Revenue (Billion) Forecast, by Application 2020 & 2033
- Table 24: Rest of Europe In-Situ Hybridization Industry Revenue (Billion) Forecast, by Application 2020 & 2033
- Table 25: Global In-Situ Hybridization Industry Revenue Billion Forecast, by Product 2020 & 2033
- Table 26: Global In-Situ Hybridization Industry Revenue Billion Forecast, by Technique 2020 & 2033
- Table 27: Global In-Situ Hybridization Industry Revenue Billion Forecast, by Application 2020 & 2033
- Table 28: Global In-Situ Hybridization Industry Revenue Billion Forecast, by End User 2020 & 2033
- Table 29: Global In-Situ Hybridization Industry Revenue Billion Forecast, by Country 2020 & 2033
- Table 30: China In-Situ Hybridization Industry Revenue (Billion) Forecast, by Application 2020 & 2033
- Table 31: Japan In-Situ Hybridization Industry Revenue (Billion) Forecast, by Application 2020 & 2033
- Table 32: India In-Situ Hybridization Industry Revenue (Billion) Forecast, by Application 2020 & 2033
- Table 33: Australia In-Situ Hybridization Industry Revenue (Billion) Forecast, by Application 2020 & 2033
- Table 34: South Korea In-Situ Hybridization Industry Revenue (Billion) Forecast, by Application 2020 & 2033
- Table 35: Rest of Asia Pacific In-Situ Hybridization Industry Revenue (Billion) Forecast, by Application 2020 & 2033
- Table 36: Global In-Situ Hybridization Industry Revenue Billion Forecast, by Product 2020 & 2033
- Table 37: Global In-Situ Hybridization Industry Revenue Billion Forecast, by Technique 2020 & 2033
- Table 38: Global In-Situ Hybridization Industry Revenue Billion Forecast, by Application 2020 & 2033
- Table 39: Global In-Situ Hybridization Industry Revenue Billion Forecast, by End User 2020 & 2033
- Table 40: Global In-Situ Hybridization Industry Revenue Billion Forecast, by Country 2020 & 2033
- Table 41: GCC In-Situ Hybridization Industry Revenue (Billion) Forecast, by Application 2020 & 2033
- Table 42: South Africa In-Situ Hybridization Industry Revenue (Billion) Forecast, by Application 2020 & 2033
- Table 43: Rest of Middle East and Africa In-Situ Hybridization Industry Revenue (Billion) Forecast, by Application 2020 & 2033
- Table 44: Global In-Situ Hybridization Industry Revenue Billion Forecast, by Product 2020 & 2033
- Table 45: Global In-Situ Hybridization Industry Revenue Billion Forecast, by Technique 2020 & 2033
- Table 46: Global In-Situ Hybridization Industry Revenue Billion Forecast, by Application 2020 & 2033
- Table 47: Global In-Situ Hybridization Industry Revenue Billion Forecast, by End User 2020 & 2033
- Table 48: Global In-Situ Hybridization Industry Revenue Billion Forecast, by Country 2020 & 2033
- Table 49: Brazil In-Situ Hybridization Industry Revenue (Billion) Forecast, by Application 2020 & 2033
- Table 50: Argentina In-Situ Hybridization Industry Revenue (Billion) Forecast, by Application 2020 & 2033
- Table 51: Rest of South America In-Situ Hybridization Industry Revenue (Billion) Forecast, by Application 2020 & 2033
Frequently Asked Questions
1. What is the projected Compound Annual Growth Rate (CAGR) of the In-Situ Hybridization Industry?
The projected CAGR is approximately 7.20%.
2. Which companies are prominent players in the In-Situ Hybridization Industry?
Key companies in the market include Thermo Fisher Scientific, Inc., Abbott Laboratories, Inc., Agilent Technologies, Inc., Merck KGaA, PerkinElmer, Inc., Bio-Rad Laboratories, Inc., F. Hoffmann-La Roche Ltd, Danaher Corporation, Abnova Corporation, BioGenex Laboratories.
3. What are the main segments of the In-Situ Hybridization Industry?
The market segments include Product, Technique, Application, End User.
4. Can you provide details about the market size?
The market size is estimated to be USD 1.5 Billion as of 2022.
5. What are some drivers contributing to market growth?
Increasing Prevalence of Cancer. Infectious Diseases and Genetic Disorders; Advancements in Diagnostic Tools; Rising Awareness on Cancer Therapeutics.
6. What are the notable trends driving market growth?
The Fluorescence In Situ Hybridization (FISH) is Expected to Witness a Healthy Growth in the Market Over the Forecast Period.
7. Are there any restraints impacting market growth?
Lack of Skilled Personnel.
8. Can you provide examples of recent developments in the market?
September 2022: Vizgen launched Merscope Protein co-detection kits. This kit enables the measurement of subcellular spatial multi-omics by co-detecting RNA and proteins during standard Multiplexed Error-Robust Fluorescence in Situ Hybridization (MERFISH) experiment.
9. What pricing options are available for accessing the report?
Pricing options include single-user, multi-user, and enterprise licenses priced at USD 4750, USD 5250, and USD 8750 respectively.
10. Is the market size provided in terms of value or volume?
The market size is provided in terms of value, measured in Billion.
11. Are there any specific market keywords associated with the report?
Yes, the market keyword associated with the report is "In-Situ Hybridization Industry," which aids in identifying and referencing the specific market segment covered.
12. How do I determine which pricing option suits my needs best?
The pricing options vary based on user requirements and access needs. Individual users may opt for single-user licenses, while businesses requiring broader access may choose multi-user or enterprise licenses for cost-effective access to the report.
13. Are there any additional resources or data provided in the In-Situ Hybridization Industry report?
While the report offers comprehensive insights, it's advisable to review the specific contents or supplementary materials provided to ascertain if additional resources or data are available.
14. How can I stay updated on further developments or reports in the In-Situ Hybridization Industry?
To stay informed about further developments, trends, and reports in the In-Situ Hybridization Industry, consider subscribing to industry newsletters, following relevant companies and organizations, or regularly checking reputable industry news sources and publications.
Methodology
Step 1 - Identification of Relevant Samples Size from Population Database


Step 2 - Approaches for Defining Global Market Size (Value, Volume* & Price*)

Note*: In applicable scenarios
Step 3 - Data Sources
Primary Research
- Web Analytics
- Survey Reports
- Research Institute
- Latest Research Reports
- Opinion Leaders
Secondary Research
- Annual Reports
- White Paper
- Latest Press Release
- Industry Association
- Paid Database
- Investor Presentations

Step 4 - Data Triangulation
Involves using different sources of information in order to increase the validity of a study
These sources are likely to be stakeholders in a program - participants, other researchers, program staff, other community members, and so on.
Then we put all data in single framework & apply various statistical tools to find out the dynamic on the market.
During the analysis stage, feedback from the stakeholder groups would be compared to determine areas of agreement as well as areas of divergence