

Key Insights
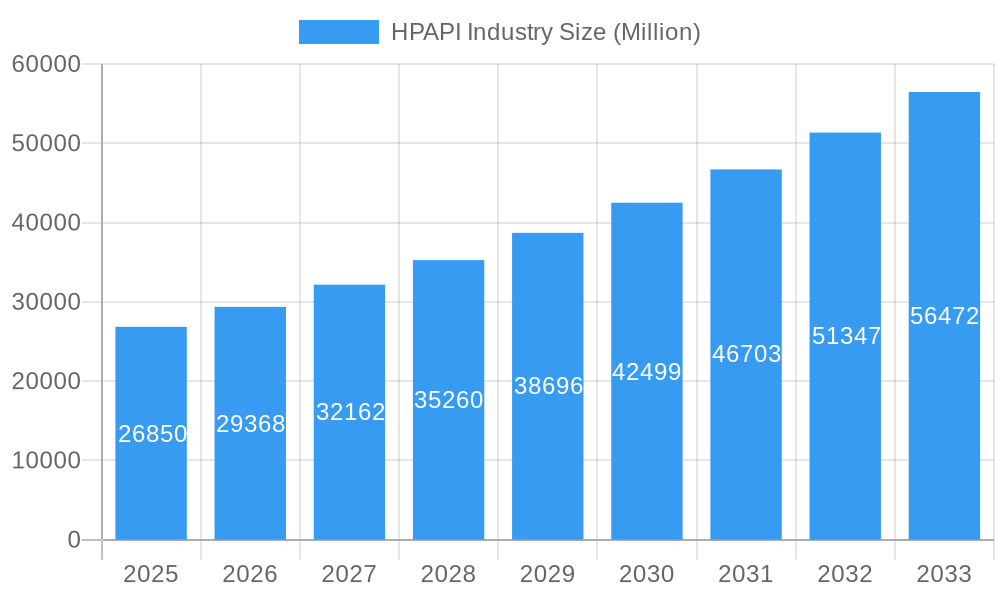
The High-Potency Active Pharmaceutical Ingredients (HPAPI) market is experiencing robust growth, projected to reach \$26.85 billion in 2025 and maintain a Compound Annual Growth Rate (CAGR) of 9.27% from 2025 to 2033. This expansion is driven primarily by the increasing prevalence of chronic diseases like cancer and hormonal imbalances, fueling demand for innovative and effective therapies. The oncology segment significantly contributes to this growth, followed by treatments for hormonal imbalances and glaucoma. The market is witnessing a surge in demand for innovative HPAPIs, reflecting the pharmaceutical industry's focus on developing more potent and targeted drugs. Furthermore, advancements in synthetic and biotechnological manufacturing processes are contributing to improved efficiency and scalability, furthering market expansion. The rise of contract manufacturing organizations (CMOs) specializing in HPAPI production is also a key factor, offering flexibility and cost-effectiveness for pharmaceutical companies. Growth is expected across all geographic regions, with North America and Europe maintaining significant market share due to established healthcare infrastructure and robust research and development activities. However, the Asia-Pacific region is poised for substantial growth, driven by rising disposable incomes, increased healthcare expenditure, and expanding pharmaceutical manufacturing capabilities in countries like India and China.
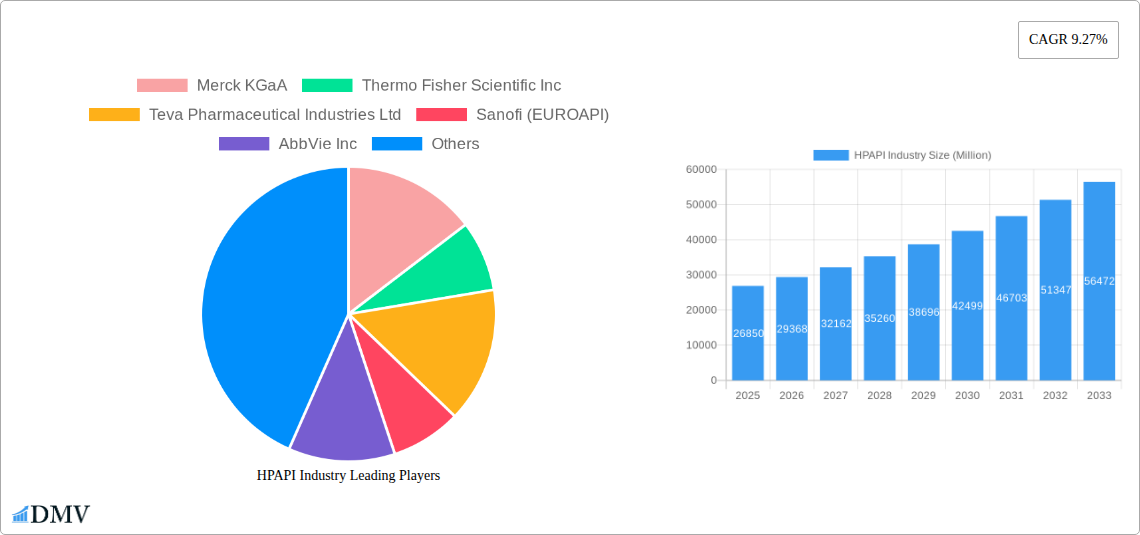
HPAPI Industry Market Size (In Billion)
Despite this positive outlook, the HPAPI market faces challenges. Stringent regulatory requirements for handling and manufacturing HPAPIs due to their inherent toxicity and potency necessitate significant investments in specialized facilities and expertise. This regulatory complexity, coupled with the high cost of research and development, can act as a restraint on market growth. Nevertheless, the long-term outlook remains optimistic. Continuous advancements in drug delivery systems and the increasing focus on personalized medicine are likely to create new opportunities and drive further demand for HPAPIs in the coming years. The growing trend towards outsourcing HPAPI manufacturing to specialized CMOs will also shape the competitive landscape and potentially increase market consolidation.
HPAPI Industry Company Market Share
High-Potency Active Pharmaceutical Ingredients (HPAPI) Industry Report: 2019-2033
This comprehensive report provides an in-depth analysis of the global High-Potency Active Pharmaceutical Ingredients (HPAPI) industry, offering invaluable insights for stakeholders seeking to navigate this dynamic market. The study period covers 2019-2033, with a base year of 2025 and a forecast period of 2025-2033. The report utilizes a robust methodology, incorporating historical data from 2019-2024 to project future market trends accurately. The total market value is predicted to reach xx Million by 2033.
HPAPI Industry Market Composition & Trends
The HPAPI market is characterized by a moderately concentrated landscape, with key players like Merck KGaA, Thermo Fisher Scientific Inc, and Pfizer Inc holding significant market share. The market share distribution among the top 10 players is estimated to be around 60% in 2025, indicating a consolidated but competitive environment. Innovation is a primary driver, fueled by the constant need for more effective and safer drugs, particularly in oncology and hormonal imbalance treatments. Stringent regulatory frameworks, including GMP (Good Manufacturing Practice) guidelines and increasing emphasis on safety protocols, shape industry practices. Substitute products are limited due to the highly specialized nature of HPAPIs; however, continuous technological advancements might introduce new alternatives in the future. End-users primarily consist of pharmaceutical companies engaged in research, development, and manufacturing of various pharmaceutical formulations. The market witnesses consistent M&A activity, with deal values exceeding xx Million in the past five years, reflecting the consolidation trend and pursuit of technological advancements.
- Market Concentration: Moderately concentrated, with top 10 players holding ~60% market share in 2025.
- Innovation Catalysts: Demand for effective treatments for chronic diseases (e.g., oncology), technological advancements in synthesis methods.
- Regulatory Landscape: Stringent GMP guidelines, increasing emphasis on safety and efficacy.
- Substitute Products: Limited due to specialized nature; potential for future alternatives.
- End-User Profile: Primarily pharmaceutical companies involved in R&D and manufacturing.
- M&A Activity: Significant activity, with deal values exceeding xx Million in the last 5 years.
HPAPI Industry Industry Evolution
The HPAPI market has witnessed robust growth throughout the historical period (2019-2024), exhibiting a Compound Annual Growth Rate (CAGR) of xx%. This growth trajectory is anticipated to continue during the forecast period (2025-2033), albeit at a slightly moderated CAGR of xx%, driven by factors including the growing prevalence of chronic diseases necessitating HPAPI-based therapies, increasing R&D investment in new drug development, and the expansion of contract manufacturing organizations (CMOs). Technological advancements, such as continuous flow processing and microreactor technology, are enhancing efficiency and reducing production costs. A notable shift is observed towards personalized medicine, demanding specialized and highly potent APIs tailored to individual patient needs. Consumer demand is also increasing driven by growing awareness of disease management and better healthcare access. The adoption rate of advanced manufacturing techniques is increasing, projected to reach xx% by 2033.
Leading Regions, Countries, or Segments in HPAPI Industry
North America currently dominates the HPAPI market, driven by substantial R&D investments, a robust regulatory framework, and the presence of major pharmaceutical companies. Europe follows closely, with significant manufacturing capabilities and a strong regulatory environment. Within the segments, the Oncology application segment holds the largest market share, followed by Hormonal Imbalance. In terms of manufacturing, Merchant HPAPI Manufacturers are more prominent due to their ability to cater to diverse needs and flexibility. Synthetic HPAPI synthesis accounts for a larger market share than Biotech HPAPI synthesis, reflecting current manufacturing trends.
- Key Drivers (North America): High R&D investment, strong regulatory environment, large pharmaceutical companies.
- Key Drivers (Europe): Strong manufacturing capabilities, robust regulatory framework.
- Dominant Application Segment: Oncology
- Dominant Manufacturing Segment: Merchant HPAPI Manufacturers
- Dominant Synthesis Method: Synthetic HPAPI Synthesis
HPAPI Industry Product Innovations
Recent innovations in HPAPI include the development of novel drug conjugates that enhance drug efficacy and reduce side effects. Advances in continuous flow processing and microreactor technologies are improving manufacturing efficiency, reducing waste, and enabling the production of complex molecules. These innovations contribute to increased potency, improved bioavailability, and enhanced safety profiles, addressing the unique challenges posed by handling highly potent compounds. Moreover, the development of advanced analytical techniques enables precise quality control and ensures product consistency.
Propelling Factors for HPAPI Industry Growth
Several factors propel HPAPI market growth. Technological advancements like continuous flow chemistry and improved containment technologies are improving manufacturing efficiency and safety. Growing prevalence of chronic diseases like cancer and autoimmune disorders fuels demand for innovative HPAPI-based therapies. Stringent regulatory approvals, while posing challenges, simultaneously indicate high safety and efficacy standards, encouraging consumer trust. Furthermore, increasing R&D investments from both pharmaceutical giants and biotech startups contribute significantly to market expansion.
Obstacles in the HPAPI Industry Market
Significant obstacles hinder HPAPI market growth. Stringent regulatory approvals increase time-to-market and development costs. Supply chain disruptions and the complexity of manufacturing HPAPIs can lead to production bottlenecks and increased costs. Intense competition among established players and emerging biotech companies also creates price pressures. Finally, the high cost of developing and manufacturing HPAPIs poses a challenge, particularly for smaller companies.
Future Opportunities in HPAPI Industry
Future opportunities include expanding into emerging markets with increasing healthcare spending. Advances in drug delivery technologies, such as nanoparticles and liposomes, could improve efficacy and reduce side effects. The growing focus on personalized medicine will lead to increased demand for bespoke HPAPIs tailored to individual patient needs. Finally, exploring novel synthesis techniques and sustainable manufacturing processes can reduce costs and environmental impact.
Major Players in the HPAPI Industry Ecosystem
- Merck KGaA
- Thermo Fisher Scientific Inc
- Teva Pharmaceutical Industries Ltd
- Sanofi (EUROAPI)
- AbbVie Inc
- Corden Pharma International
- Viatris Inc
- Sun Pharmaceutical Industries Ltd
- SK Biotek
- Pfizer Inc
Key Developments in HPAPI Industry Industry
- January 2023: Sai Life Sciences completed construction of a new HPAPI manufacturing facility, enhancing its capacity and expertise in HPAPI development.
- February 2023: Piramal Pharma Solutions inaugurated a new API manufacturing plant in the US, specializing in HPAPI production.
Strategic HPAPI Industry Market Forecast
The HPAPI market is poised for significant growth, driven by technological advancements, increasing prevalence of chronic diseases, and rising R&D investments. Emerging markets present significant opportunities for expansion, while innovations in drug delivery and personalized medicine will further fuel market growth. The market's potential is substantial, promising substantial returns for companies that can effectively navigate the regulatory landscape and capitalize on emerging opportunities.
HPAPI Industry Segmentation
-
1. Poduct Type
- 1.1. Innovati
- 1.2. Generic
-
2. Application
- 2.1. Oncology
- 2.2. Hormonal Imbalance
- 2.3. Glaucoma
- 2.4. Other Applications
-
3. Synthesis
- 3.1. Syntheti
- 3.2. Biotech
-
4. Manufacturer
- 4.1. Captive HPAPI Manufacturers
- 4.2. Merchant HPAPI Manufacturers
HPAPI Industry Segmentation By Geography
-
1. North America
- 1.1. United States
- 1.2. Canada
- 1.3. Mexico
-
2. Europe
- 2.1. Germany
- 2.2. United Kingdom
- 2.3. France
- 2.4. Italy
- 2.5. Spain
- 2.6. Rest of Europe
-
3. Asia Pacific
- 3.1. China
- 3.2. Japan
- 3.3. India
- 3.4. Australia
- 3.5. South Korea
- 3.6. Rest of Asia Pacific
-
4. Middle East and Africa
- 4.1. GCC
- 4.2. South Africa
- 4.3. Rest of Middle East and Africa
-
5. South America
- 5.1. Brazil
- 5.2. Argentina
- 5.3. Rest of South America
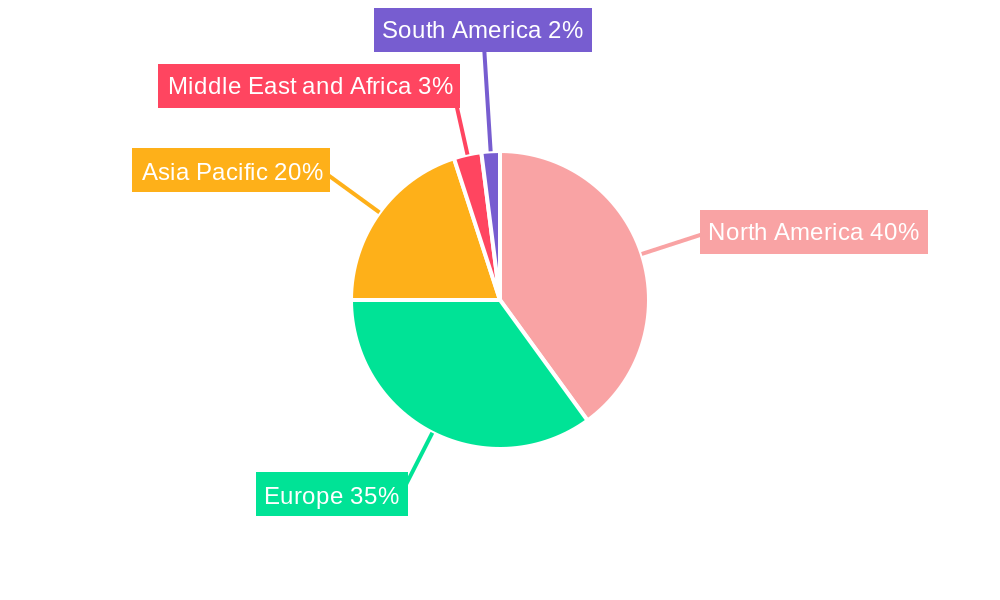
HPAPI Industry Regional Market Share
Geographic Coverage of HPAPI Industry
HPAPI Industry REPORT HIGHLIGHTS
| Aspects | Details |
|---|---|
| Study Period | 2020-2034 |
| Base Year | 2025 |
| Estimated Year | 2026 |
| Forecast Period | 2026-2034 |
| Historical Period | 2020-2025 |
| Growth Rate | CAGR of 9.27% from 2020-2034 |
| Segmentation |
|
Table of Contents
- 1. Introduction
- 1.1. Research Scope
- 1.2. Market Segmentation
- 1.3. Research Methodology
- 1.4. Definitions and Assumptions
- 2. Executive Summary
- 2.1. Introduction
- 3. Market Dynamics
- 3.1. Introduction
- 3.2. Market Drivers
- 3.2.1. Increasing Demand for Pharmaceutical Drugs; Increasing Focus on Precision Medicine and High-potency APIs; Technological Advancements in High-potency API Manufacturing
- 3.3. Market Restrains
- 3.3.1. Huge Capital Investment; Ever Changing Industry Standards and Guidelines
- 3.4. Market Trends
- 3.4.1. Generic High-potency Active Pharmaceutical Ingredients Segment is Expected to Record Significant Growth
- 4. Market Factor Analysis
- 4.1. Porters Five Forces
- 4.2. Supply/Value Chain
- 4.3. PESTEL analysis
- 4.4. Market Entropy
- 4.5. Patent/Trademark Analysis
- 5. Global HPAPI Industry Analysis, Insights and Forecast, 2020-2032
- 5.1. Market Analysis, Insights and Forecast - by Poduct Type
- 5.1.1. Innovati
- 5.1.2. Generic
- 5.2. Market Analysis, Insights and Forecast - by Application
- 5.2.1. Oncology
- 5.2.2. Hormonal Imbalance
- 5.2.3. Glaucoma
- 5.2.4. Other Applications
- 5.3. Market Analysis, Insights and Forecast - by Synthesis
- 5.3.1. Syntheti
- 5.3.2. Biotech
- 5.4. Market Analysis, Insights and Forecast - by Manufacturer
- 5.4.1. Captive HPAPI Manufacturers
- 5.4.2. Merchant HPAPI Manufacturers
- 5.5. Market Analysis, Insights and Forecast - by Region
- 5.5.1. North America
- 5.5.2. Europe
- 5.5.3. Asia Pacific
- 5.5.4. Middle East and Africa
- 5.5.5. South America
- 5.1. Market Analysis, Insights and Forecast - by Poduct Type
- 6. North America HPAPI Industry Analysis, Insights and Forecast, 2020-2032
- 6.1. Market Analysis, Insights and Forecast - by Poduct Type
- 6.1.1. Innovati
- 6.1.2. Generic
- 6.2. Market Analysis, Insights and Forecast - by Application
- 6.2.1. Oncology
- 6.2.2. Hormonal Imbalance
- 6.2.3. Glaucoma
- 6.2.4. Other Applications
- 6.3. Market Analysis, Insights and Forecast - by Synthesis
- 6.3.1. Syntheti
- 6.3.2. Biotech
- 6.4. Market Analysis, Insights and Forecast - by Manufacturer
- 6.4.1. Captive HPAPI Manufacturers
- 6.4.2. Merchant HPAPI Manufacturers
- 6.1. Market Analysis, Insights and Forecast - by Poduct Type
- 7. Europe HPAPI Industry Analysis, Insights and Forecast, 2020-2032
- 7.1. Market Analysis, Insights and Forecast - by Poduct Type
- 7.1.1. Innovati
- 7.1.2. Generic
- 7.2. Market Analysis, Insights and Forecast - by Application
- 7.2.1. Oncology
- 7.2.2. Hormonal Imbalance
- 7.2.3. Glaucoma
- 7.2.4. Other Applications
- 7.3. Market Analysis, Insights and Forecast - by Synthesis
- 7.3.1. Syntheti
- 7.3.2. Biotech
- 7.4. Market Analysis, Insights and Forecast - by Manufacturer
- 7.4.1. Captive HPAPI Manufacturers
- 7.4.2. Merchant HPAPI Manufacturers
- 7.1. Market Analysis, Insights and Forecast - by Poduct Type
- 8. Asia Pacific HPAPI Industry Analysis, Insights and Forecast, 2020-2032
- 8.1. Market Analysis, Insights and Forecast - by Poduct Type
- 8.1.1. Innovati
- 8.1.2. Generic
- 8.2. Market Analysis, Insights and Forecast - by Application
- 8.2.1. Oncology
- 8.2.2. Hormonal Imbalance
- 8.2.3. Glaucoma
- 8.2.4. Other Applications
- 8.3. Market Analysis, Insights and Forecast - by Synthesis
- 8.3.1. Syntheti
- 8.3.2. Biotech
- 8.4. Market Analysis, Insights and Forecast - by Manufacturer
- 8.4.1. Captive HPAPI Manufacturers
- 8.4.2. Merchant HPAPI Manufacturers
- 8.1. Market Analysis, Insights and Forecast - by Poduct Type
- 9. Middle East and Africa HPAPI Industry Analysis, Insights and Forecast, 2020-2032
- 9.1. Market Analysis, Insights and Forecast - by Poduct Type
- 9.1.1. Innovati
- 9.1.2. Generic
- 9.2. Market Analysis, Insights and Forecast - by Application
- 9.2.1. Oncology
- 9.2.2. Hormonal Imbalance
- 9.2.3. Glaucoma
- 9.2.4. Other Applications
- 9.3. Market Analysis, Insights and Forecast - by Synthesis
- 9.3.1. Syntheti
- 9.3.2. Biotech
- 9.4. Market Analysis, Insights and Forecast - by Manufacturer
- 9.4.1. Captive HPAPI Manufacturers
- 9.4.2. Merchant HPAPI Manufacturers
- 9.1. Market Analysis, Insights and Forecast - by Poduct Type
- 10. South America HPAPI Industry Analysis, Insights and Forecast, 2020-2032
- 10.1. Market Analysis, Insights and Forecast - by Poduct Type
- 10.1.1. Innovati
- 10.1.2. Generic
- 10.2. Market Analysis, Insights and Forecast - by Application
- 10.2.1. Oncology
- 10.2.2. Hormonal Imbalance
- 10.2.3. Glaucoma
- 10.2.4. Other Applications
- 10.3. Market Analysis, Insights and Forecast - by Synthesis
- 10.3.1. Syntheti
- 10.3.2. Biotech
- 10.4. Market Analysis, Insights and Forecast - by Manufacturer
- 10.4.1. Captive HPAPI Manufacturers
- 10.4.2. Merchant HPAPI Manufacturers
- 10.1. Market Analysis, Insights and Forecast - by Poduct Type
- 11. Competitive Analysis
- 11.1. Global Market Share Analysis 2025
- 11.2. Company Profiles
- 11.2.1 Merck KGaA
- 11.2.1.1. Overview
- 11.2.1.2. Products
- 11.2.1.3. SWOT Analysis
- 11.2.1.4. Recent Developments
- 11.2.1.5. Financials (Based on Availability)
- 11.2.2 Thermo Fisher Scientific Inc
- 11.2.2.1. Overview
- 11.2.2.2. Products
- 11.2.2.3. SWOT Analysis
- 11.2.2.4. Recent Developments
- 11.2.2.5. Financials (Based on Availability)
- 11.2.3 Teva Pharmaceutical Industries Ltd
- 11.2.3.1. Overview
- 11.2.3.2. Products
- 11.2.3.3. SWOT Analysis
- 11.2.3.4. Recent Developments
- 11.2.3.5. Financials (Based on Availability)
- 11.2.4 Sanofi (EUROAPI)
- 11.2.4.1. Overview
- 11.2.4.2. Products
- 11.2.4.3. SWOT Analysis
- 11.2.4.4. Recent Developments
- 11.2.4.5. Financials (Based on Availability)
- 11.2.5 AbbVie Inc
- 11.2.5.1. Overview
- 11.2.5.2. Products
- 11.2.5.3. SWOT Analysis
- 11.2.5.4. Recent Developments
- 11.2.5.5. Financials (Based on Availability)
- 11.2.6 Corden Pharma International
- 11.2.6.1. Overview
- 11.2.6.2. Products
- 11.2.6.3. SWOT Analysis
- 11.2.6.4. Recent Developments
- 11.2.6.5. Financials (Based on Availability)
- 11.2.7 Viatris Inc
- 11.2.7.1. Overview
- 11.2.7.2. Products
- 11.2.7.3. SWOT Analysis
- 11.2.7.4. Recent Developments
- 11.2.7.5. Financials (Based on Availability)
- 11.2.8 Sun Pharmaceutical Industries Ltd
- 11.2.8.1. Overview
- 11.2.8.2. Products
- 11.2.8.3. SWOT Analysis
- 11.2.8.4. Recent Developments
- 11.2.8.5. Financials (Based on Availability)
- 11.2.9 SK Biotek
- 11.2.9.1. Overview
- 11.2.9.2. Products
- 11.2.9.3. SWOT Analysis
- 11.2.9.4. Recent Developments
- 11.2.9.5. Financials (Based on Availability)
- 11.2.10 Pfizer Inc
- 11.2.10.1. Overview
- 11.2.10.2. Products
- 11.2.10.3. SWOT Analysis
- 11.2.10.4. Recent Developments
- 11.2.10.5. Financials (Based on Availability)
- 11.2.1 Merck KGaA
List of Figures
- Figure 1: Global HPAPI Industry Revenue Breakdown (Million, %) by Region 2025 & 2033
- Figure 2: Global HPAPI Industry Volume Breakdown (K Unit, %) by Region 2025 & 2033
- Figure 3: North America HPAPI Industry Revenue (Million), by Poduct Type 2025 & 2033
- Figure 4: North America HPAPI Industry Volume (K Unit), by Poduct Type 2025 & 2033
- Figure 5: North America HPAPI Industry Revenue Share (%), by Poduct Type 2025 & 2033
- Figure 6: North America HPAPI Industry Volume Share (%), by Poduct Type 2025 & 2033
- Figure 7: North America HPAPI Industry Revenue (Million), by Application 2025 & 2033
- Figure 8: North America HPAPI Industry Volume (K Unit), by Application 2025 & 2033
- Figure 9: North America HPAPI Industry Revenue Share (%), by Application 2025 & 2033
- Figure 10: North America HPAPI Industry Volume Share (%), by Application 2025 & 2033
- Figure 11: North America HPAPI Industry Revenue (Million), by Synthesis 2025 & 2033
- Figure 12: North America HPAPI Industry Volume (K Unit), by Synthesis 2025 & 2033
- Figure 13: North America HPAPI Industry Revenue Share (%), by Synthesis 2025 & 2033
- Figure 14: North America HPAPI Industry Volume Share (%), by Synthesis 2025 & 2033
- Figure 15: North America HPAPI Industry Revenue (Million), by Manufacturer 2025 & 2033
- Figure 16: North America HPAPI Industry Volume (K Unit), by Manufacturer 2025 & 2033
- Figure 17: North America HPAPI Industry Revenue Share (%), by Manufacturer 2025 & 2033
- Figure 18: North America HPAPI Industry Volume Share (%), by Manufacturer 2025 & 2033
- Figure 19: North America HPAPI Industry Revenue (Million), by Country 2025 & 2033
- Figure 20: North America HPAPI Industry Volume (K Unit), by Country 2025 & 2033
- Figure 21: North America HPAPI Industry Revenue Share (%), by Country 2025 & 2033
- Figure 22: North America HPAPI Industry Volume Share (%), by Country 2025 & 2033
- Figure 23: Europe HPAPI Industry Revenue (Million), by Poduct Type 2025 & 2033
- Figure 24: Europe HPAPI Industry Volume (K Unit), by Poduct Type 2025 & 2033
- Figure 25: Europe HPAPI Industry Revenue Share (%), by Poduct Type 2025 & 2033
- Figure 26: Europe HPAPI Industry Volume Share (%), by Poduct Type 2025 & 2033
- Figure 27: Europe HPAPI Industry Revenue (Million), by Application 2025 & 2033
- Figure 28: Europe HPAPI Industry Volume (K Unit), by Application 2025 & 2033
- Figure 29: Europe HPAPI Industry Revenue Share (%), by Application 2025 & 2033
- Figure 30: Europe HPAPI Industry Volume Share (%), by Application 2025 & 2033
- Figure 31: Europe HPAPI Industry Revenue (Million), by Synthesis 2025 & 2033
- Figure 32: Europe HPAPI Industry Volume (K Unit), by Synthesis 2025 & 2033
- Figure 33: Europe HPAPI Industry Revenue Share (%), by Synthesis 2025 & 2033
- Figure 34: Europe HPAPI Industry Volume Share (%), by Synthesis 2025 & 2033
- Figure 35: Europe HPAPI Industry Revenue (Million), by Manufacturer 2025 & 2033
- Figure 36: Europe HPAPI Industry Volume (K Unit), by Manufacturer 2025 & 2033
- Figure 37: Europe HPAPI Industry Revenue Share (%), by Manufacturer 2025 & 2033
- Figure 38: Europe HPAPI Industry Volume Share (%), by Manufacturer 2025 & 2033
- Figure 39: Europe HPAPI Industry Revenue (Million), by Country 2025 & 2033
- Figure 40: Europe HPAPI Industry Volume (K Unit), by Country 2025 & 2033
- Figure 41: Europe HPAPI Industry Revenue Share (%), by Country 2025 & 2033
- Figure 42: Europe HPAPI Industry Volume Share (%), by Country 2025 & 2033
- Figure 43: Asia Pacific HPAPI Industry Revenue (Million), by Poduct Type 2025 & 2033
- Figure 44: Asia Pacific HPAPI Industry Volume (K Unit), by Poduct Type 2025 & 2033
- Figure 45: Asia Pacific HPAPI Industry Revenue Share (%), by Poduct Type 2025 & 2033
- Figure 46: Asia Pacific HPAPI Industry Volume Share (%), by Poduct Type 2025 & 2033
- Figure 47: Asia Pacific HPAPI Industry Revenue (Million), by Application 2025 & 2033
- Figure 48: Asia Pacific HPAPI Industry Volume (K Unit), by Application 2025 & 2033
- Figure 49: Asia Pacific HPAPI Industry Revenue Share (%), by Application 2025 & 2033
- Figure 50: Asia Pacific HPAPI Industry Volume Share (%), by Application 2025 & 2033
- Figure 51: Asia Pacific HPAPI Industry Revenue (Million), by Synthesis 2025 & 2033
- Figure 52: Asia Pacific HPAPI Industry Volume (K Unit), by Synthesis 2025 & 2033
- Figure 53: Asia Pacific HPAPI Industry Revenue Share (%), by Synthesis 2025 & 2033
- Figure 54: Asia Pacific HPAPI Industry Volume Share (%), by Synthesis 2025 & 2033
- Figure 55: Asia Pacific HPAPI Industry Revenue (Million), by Manufacturer 2025 & 2033
- Figure 56: Asia Pacific HPAPI Industry Volume (K Unit), by Manufacturer 2025 & 2033
- Figure 57: Asia Pacific HPAPI Industry Revenue Share (%), by Manufacturer 2025 & 2033
- Figure 58: Asia Pacific HPAPI Industry Volume Share (%), by Manufacturer 2025 & 2033
- Figure 59: Asia Pacific HPAPI Industry Revenue (Million), by Country 2025 & 2033
- Figure 60: Asia Pacific HPAPI Industry Volume (K Unit), by Country 2025 & 2033
- Figure 61: Asia Pacific HPAPI Industry Revenue Share (%), by Country 2025 & 2033
- Figure 62: Asia Pacific HPAPI Industry Volume Share (%), by Country 2025 & 2033
- Figure 63: Middle East and Africa HPAPI Industry Revenue (Million), by Poduct Type 2025 & 2033
- Figure 64: Middle East and Africa HPAPI Industry Volume (K Unit), by Poduct Type 2025 & 2033
- Figure 65: Middle East and Africa HPAPI Industry Revenue Share (%), by Poduct Type 2025 & 2033
- Figure 66: Middle East and Africa HPAPI Industry Volume Share (%), by Poduct Type 2025 & 2033
- Figure 67: Middle East and Africa HPAPI Industry Revenue (Million), by Application 2025 & 2033
- Figure 68: Middle East and Africa HPAPI Industry Volume (K Unit), by Application 2025 & 2033
- Figure 69: Middle East and Africa HPAPI Industry Revenue Share (%), by Application 2025 & 2033
- Figure 70: Middle East and Africa HPAPI Industry Volume Share (%), by Application 2025 & 2033
- Figure 71: Middle East and Africa HPAPI Industry Revenue (Million), by Synthesis 2025 & 2033
- Figure 72: Middle East and Africa HPAPI Industry Volume (K Unit), by Synthesis 2025 & 2033
- Figure 73: Middle East and Africa HPAPI Industry Revenue Share (%), by Synthesis 2025 & 2033
- Figure 74: Middle East and Africa HPAPI Industry Volume Share (%), by Synthesis 2025 & 2033
- Figure 75: Middle East and Africa HPAPI Industry Revenue (Million), by Manufacturer 2025 & 2033
- Figure 76: Middle East and Africa HPAPI Industry Volume (K Unit), by Manufacturer 2025 & 2033
- Figure 77: Middle East and Africa HPAPI Industry Revenue Share (%), by Manufacturer 2025 & 2033
- Figure 78: Middle East and Africa HPAPI Industry Volume Share (%), by Manufacturer 2025 & 2033
- Figure 79: Middle East and Africa HPAPI Industry Revenue (Million), by Country 2025 & 2033
- Figure 80: Middle East and Africa HPAPI Industry Volume (K Unit), by Country 2025 & 2033
- Figure 81: Middle East and Africa HPAPI Industry Revenue Share (%), by Country 2025 & 2033
- Figure 82: Middle East and Africa HPAPI Industry Volume Share (%), by Country 2025 & 2033
- Figure 83: South America HPAPI Industry Revenue (Million), by Poduct Type 2025 & 2033
- Figure 84: South America HPAPI Industry Volume (K Unit), by Poduct Type 2025 & 2033
- Figure 85: South America HPAPI Industry Revenue Share (%), by Poduct Type 2025 & 2033
- Figure 86: South America HPAPI Industry Volume Share (%), by Poduct Type 2025 & 2033
- Figure 87: South America HPAPI Industry Revenue (Million), by Application 2025 & 2033
- Figure 88: South America HPAPI Industry Volume (K Unit), by Application 2025 & 2033
- Figure 89: South America HPAPI Industry Revenue Share (%), by Application 2025 & 2033
- Figure 90: South America HPAPI Industry Volume Share (%), by Application 2025 & 2033
- Figure 91: South America HPAPI Industry Revenue (Million), by Synthesis 2025 & 2033
- Figure 92: South America HPAPI Industry Volume (K Unit), by Synthesis 2025 & 2033
- Figure 93: South America HPAPI Industry Revenue Share (%), by Synthesis 2025 & 2033
- Figure 94: South America HPAPI Industry Volume Share (%), by Synthesis 2025 & 2033
- Figure 95: South America HPAPI Industry Revenue (Million), by Manufacturer 2025 & 2033
- Figure 96: South America HPAPI Industry Volume (K Unit), by Manufacturer 2025 & 2033
- Figure 97: South America HPAPI Industry Revenue Share (%), by Manufacturer 2025 & 2033
- Figure 98: South America HPAPI Industry Volume Share (%), by Manufacturer 2025 & 2033
- Figure 99: South America HPAPI Industry Revenue (Million), by Country 2025 & 2033
- Figure 100: South America HPAPI Industry Volume (K Unit), by Country 2025 & 2033
- Figure 101: South America HPAPI Industry Revenue Share (%), by Country 2025 & 2033
- Figure 102: South America HPAPI Industry Volume Share (%), by Country 2025 & 2033
List of Tables
- Table 1: Global HPAPI Industry Revenue Million Forecast, by Poduct Type 2020 & 2033
- Table 2: Global HPAPI Industry Volume K Unit Forecast, by Poduct Type 2020 & 2033
- Table 3: Global HPAPI Industry Revenue Million Forecast, by Application 2020 & 2033
- Table 4: Global HPAPI Industry Volume K Unit Forecast, by Application 2020 & 2033
- Table 5: Global HPAPI Industry Revenue Million Forecast, by Synthesis 2020 & 2033
- Table 6: Global HPAPI Industry Volume K Unit Forecast, by Synthesis 2020 & 2033
- Table 7: Global HPAPI Industry Revenue Million Forecast, by Manufacturer 2020 & 2033
- Table 8: Global HPAPI Industry Volume K Unit Forecast, by Manufacturer 2020 & 2033
- Table 9: Global HPAPI Industry Revenue Million Forecast, by Region 2020 & 2033
- Table 10: Global HPAPI Industry Volume K Unit Forecast, by Region 2020 & 2033
- Table 11: Global HPAPI Industry Revenue Million Forecast, by Poduct Type 2020 & 2033
- Table 12: Global HPAPI Industry Volume K Unit Forecast, by Poduct Type 2020 & 2033
- Table 13: Global HPAPI Industry Revenue Million Forecast, by Application 2020 & 2033
- Table 14: Global HPAPI Industry Volume K Unit Forecast, by Application 2020 & 2033
- Table 15: Global HPAPI Industry Revenue Million Forecast, by Synthesis 2020 & 2033
- Table 16: Global HPAPI Industry Volume K Unit Forecast, by Synthesis 2020 & 2033
- Table 17: Global HPAPI Industry Revenue Million Forecast, by Manufacturer 2020 & 2033
- Table 18: Global HPAPI Industry Volume K Unit Forecast, by Manufacturer 2020 & 2033
- Table 19: Global HPAPI Industry Revenue Million Forecast, by Country 2020 & 2033
- Table 20: Global HPAPI Industry Volume K Unit Forecast, by Country 2020 & 2033
- Table 21: United States HPAPI Industry Revenue (Million) Forecast, by Application 2020 & 2033
- Table 22: United States HPAPI Industry Volume (K Unit) Forecast, by Application 2020 & 2033
- Table 23: Canada HPAPI Industry Revenue (Million) Forecast, by Application 2020 & 2033
- Table 24: Canada HPAPI Industry Volume (K Unit) Forecast, by Application 2020 & 2033
- Table 25: Mexico HPAPI Industry Revenue (Million) Forecast, by Application 2020 & 2033
- Table 26: Mexico HPAPI Industry Volume (K Unit) Forecast, by Application 2020 & 2033
- Table 27: Global HPAPI Industry Revenue Million Forecast, by Poduct Type 2020 & 2033
- Table 28: Global HPAPI Industry Volume K Unit Forecast, by Poduct Type 2020 & 2033
- Table 29: Global HPAPI Industry Revenue Million Forecast, by Application 2020 & 2033
- Table 30: Global HPAPI Industry Volume K Unit Forecast, by Application 2020 & 2033
- Table 31: Global HPAPI Industry Revenue Million Forecast, by Synthesis 2020 & 2033
- Table 32: Global HPAPI Industry Volume K Unit Forecast, by Synthesis 2020 & 2033
- Table 33: Global HPAPI Industry Revenue Million Forecast, by Manufacturer 2020 & 2033
- Table 34: Global HPAPI Industry Volume K Unit Forecast, by Manufacturer 2020 & 2033
- Table 35: Global HPAPI Industry Revenue Million Forecast, by Country 2020 & 2033
- Table 36: Global HPAPI Industry Volume K Unit Forecast, by Country 2020 & 2033
- Table 37: Germany HPAPI Industry Revenue (Million) Forecast, by Application 2020 & 2033
- Table 38: Germany HPAPI Industry Volume (K Unit) Forecast, by Application 2020 & 2033
- Table 39: United Kingdom HPAPI Industry Revenue (Million) Forecast, by Application 2020 & 2033
- Table 40: United Kingdom HPAPI Industry Volume (K Unit) Forecast, by Application 2020 & 2033
- Table 41: France HPAPI Industry Revenue (Million) Forecast, by Application 2020 & 2033
- Table 42: France HPAPI Industry Volume (K Unit) Forecast, by Application 2020 & 2033
- Table 43: Italy HPAPI Industry Revenue (Million) Forecast, by Application 2020 & 2033
- Table 44: Italy HPAPI Industry Volume (K Unit) Forecast, by Application 2020 & 2033
- Table 45: Spain HPAPI Industry Revenue (Million) Forecast, by Application 2020 & 2033
- Table 46: Spain HPAPI Industry Volume (K Unit) Forecast, by Application 2020 & 2033
- Table 47: Rest of Europe HPAPI Industry Revenue (Million) Forecast, by Application 2020 & 2033
- Table 48: Rest of Europe HPAPI Industry Volume (K Unit) Forecast, by Application 2020 & 2033
- Table 49: Global HPAPI Industry Revenue Million Forecast, by Poduct Type 2020 & 2033
- Table 50: Global HPAPI Industry Volume K Unit Forecast, by Poduct Type 2020 & 2033
- Table 51: Global HPAPI Industry Revenue Million Forecast, by Application 2020 & 2033
- Table 52: Global HPAPI Industry Volume K Unit Forecast, by Application 2020 & 2033
- Table 53: Global HPAPI Industry Revenue Million Forecast, by Synthesis 2020 & 2033
- Table 54: Global HPAPI Industry Volume K Unit Forecast, by Synthesis 2020 & 2033
- Table 55: Global HPAPI Industry Revenue Million Forecast, by Manufacturer 2020 & 2033
- Table 56: Global HPAPI Industry Volume K Unit Forecast, by Manufacturer 2020 & 2033
- Table 57: Global HPAPI Industry Revenue Million Forecast, by Country 2020 & 2033
- Table 58: Global HPAPI Industry Volume K Unit Forecast, by Country 2020 & 2033
- Table 59: China HPAPI Industry Revenue (Million) Forecast, by Application 2020 & 2033
- Table 60: China HPAPI Industry Volume (K Unit) Forecast, by Application 2020 & 2033
- Table 61: Japan HPAPI Industry Revenue (Million) Forecast, by Application 2020 & 2033
- Table 62: Japan HPAPI Industry Volume (K Unit) Forecast, by Application 2020 & 2033
- Table 63: India HPAPI Industry Revenue (Million) Forecast, by Application 2020 & 2033
- Table 64: India HPAPI Industry Volume (K Unit) Forecast, by Application 2020 & 2033
- Table 65: Australia HPAPI Industry Revenue (Million) Forecast, by Application 2020 & 2033
- Table 66: Australia HPAPI Industry Volume (K Unit) Forecast, by Application 2020 & 2033
- Table 67: South Korea HPAPI Industry Revenue (Million) Forecast, by Application 2020 & 2033
- Table 68: South Korea HPAPI Industry Volume (K Unit) Forecast, by Application 2020 & 2033
- Table 69: Rest of Asia Pacific HPAPI Industry Revenue (Million) Forecast, by Application 2020 & 2033
- Table 70: Rest of Asia Pacific HPAPI Industry Volume (K Unit) Forecast, by Application 2020 & 2033
- Table 71: Global HPAPI Industry Revenue Million Forecast, by Poduct Type 2020 & 2033
- Table 72: Global HPAPI Industry Volume K Unit Forecast, by Poduct Type 2020 & 2033
- Table 73: Global HPAPI Industry Revenue Million Forecast, by Application 2020 & 2033
- Table 74: Global HPAPI Industry Volume K Unit Forecast, by Application 2020 & 2033
- Table 75: Global HPAPI Industry Revenue Million Forecast, by Synthesis 2020 & 2033
- Table 76: Global HPAPI Industry Volume K Unit Forecast, by Synthesis 2020 & 2033
- Table 77: Global HPAPI Industry Revenue Million Forecast, by Manufacturer 2020 & 2033
- Table 78: Global HPAPI Industry Volume K Unit Forecast, by Manufacturer 2020 & 2033
- Table 79: Global HPAPI Industry Revenue Million Forecast, by Country 2020 & 2033
- Table 80: Global HPAPI Industry Volume K Unit Forecast, by Country 2020 & 2033
- Table 81: GCC HPAPI Industry Revenue (Million) Forecast, by Application 2020 & 2033
- Table 82: GCC HPAPI Industry Volume (K Unit) Forecast, by Application 2020 & 2033
- Table 83: South Africa HPAPI Industry Revenue (Million) Forecast, by Application 2020 & 2033
- Table 84: South Africa HPAPI Industry Volume (K Unit) Forecast, by Application 2020 & 2033
- Table 85: Rest of Middle East and Africa HPAPI Industry Revenue (Million) Forecast, by Application 2020 & 2033
- Table 86: Rest of Middle East and Africa HPAPI Industry Volume (K Unit) Forecast, by Application 2020 & 2033
- Table 87: Global HPAPI Industry Revenue Million Forecast, by Poduct Type 2020 & 2033
- Table 88: Global HPAPI Industry Volume K Unit Forecast, by Poduct Type 2020 & 2033
- Table 89: Global HPAPI Industry Revenue Million Forecast, by Application 2020 & 2033
- Table 90: Global HPAPI Industry Volume K Unit Forecast, by Application 2020 & 2033
- Table 91: Global HPAPI Industry Revenue Million Forecast, by Synthesis 2020 & 2033
- Table 92: Global HPAPI Industry Volume K Unit Forecast, by Synthesis 2020 & 2033
- Table 93: Global HPAPI Industry Revenue Million Forecast, by Manufacturer 2020 & 2033
- Table 94: Global HPAPI Industry Volume K Unit Forecast, by Manufacturer 2020 & 2033
- Table 95: Global HPAPI Industry Revenue Million Forecast, by Country 2020 & 2033
- Table 96: Global HPAPI Industry Volume K Unit Forecast, by Country 2020 & 2033
- Table 97: Brazil HPAPI Industry Revenue (Million) Forecast, by Application 2020 & 2033
- Table 98: Brazil HPAPI Industry Volume (K Unit) Forecast, by Application 2020 & 2033
- Table 99: Argentina HPAPI Industry Revenue (Million) Forecast, by Application 2020 & 2033
- Table 100: Argentina HPAPI Industry Volume (K Unit) Forecast, by Application 2020 & 2033
- Table 101: Rest of South America HPAPI Industry Revenue (Million) Forecast, by Application 2020 & 2033
- Table 102: Rest of South America HPAPI Industry Volume (K Unit) Forecast, by Application 2020 & 2033
Frequently Asked Questions
1. What is the projected Compound Annual Growth Rate (CAGR) of the HPAPI Industry?
The projected CAGR is approximately 9.27%.
2. Which companies are prominent players in the HPAPI Industry?
Key companies in the market include Merck KGaA, Thermo Fisher Scientific Inc, Teva Pharmaceutical Industries Ltd, Sanofi (EUROAPI), AbbVie Inc, Corden Pharma International, Viatris Inc , Sun Pharmaceutical Industries Ltd, SK Biotek, Pfizer Inc.
3. What are the main segments of the HPAPI Industry?
The market segments include Poduct Type, Application, Synthesis, Manufacturer.
4. Can you provide details about the market size?
The market size is estimated to be USD 26.85 Million as of 2022.
5. What are some drivers contributing to market growth?
Increasing Demand for Pharmaceutical Drugs; Increasing Focus on Precision Medicine and High-potency APIs; Technological Advancements in High-potency API Manufacturing.
6. What are the notable trends driving market growth?
Generic High-potency Active Pharmaceutical Ingredients Segment is Expected to Record Significant Growth.
7. Are there any restraints impacting market growth?
Huge Capital Investment; Ever Changing Industry Standards and Guidelines.
8. Can you provide examples of recent developments in the market?
January 2023: Sai Life Sciences completed the construction of a new High-Potency API (HPAPI) manufacturing facility at its cGMP API Manufacturing site in Bidar, India. This addition significantly enhances the company's expertise in HPAPI development and production, providing customers with an expedited route for New Chemical Entity (NCE) development.
9. What pricing options are available for accessing the report?
Pricing options include single-user, multi-user, and enterprise licenses priced at USD 4750, USD 5250, and USD 8750 respectively.
10. Is the market size provided in terms of value or volume?
The market size is provided in terms of value, measured in Million and volume, measured in K Unit.
11. Are there any specific market keywords associated with the report?
Yes, the market keyword associated with the report is "HPAPI Industry," which aids in identifying and referencing the specific market segment covered.
12. How do I determine which pricing option suits my needs best?
The pricing options vary based on user requirements and access needs. Individual users may opt for single-user licenses, while businesses requiring broader access may choose multi-user or enterprise licenses for cost-effective access to the report.
13. Are there any additional resources or data provided in the HPAPI Industry report?
While the report offers comprehensive insights, it's advisable to review the specific contents or supplementary materials provided to ascertain if additional resources or data are available.
14. How can I stay updated on further developments or reports in the HPAPI Industry?
To stay informed about further developments, trends, and reports in the HPAPI Industry, consider subscribing to industry newsletters, following relevant companies and organizations, or regularly checking reputable industry news sources and publications.
Methodology
Step 1 - Identification of Relevant Samples Size from Population Database


Step 2 - Approaches for Defining Global Market Size (Value, Volume* & Price*)

Note*: In applicable scenarios
Step 3 - Data Sources
Primary Research
- Web Analytics
- Survey Reports
- Research Institute
- Latest Research Reports
- Opinion Leaders
Secondary Research
- Annual Reports
- White Paper
- Latest Press Release
- Industry Association
- Paid Database
- Investor Presentations

Step 4 - Data Triangulation
Involves using different sources of information in order to increase the validity of a study
These sources are likely to be stakeholders in a program - participants, other researchers, program staff, other community members, and so on.
Then we put all data in single framework & apply various statistical tools to find out the dynamic on the market.
During the analysis stage, feedback from the stakeholder groups would be compared to determine areas of agreement as well as areas of divergence