

Key Insights
The global chicken health market, encompassing vaccines, parasiticides, anti-infectives, and diagnostic tests, is projected for significant expansion. With a projected market size of 316.77 billion by 2025, the market is expected to grow at a Compound Annual Growth Rate (CAGR) of 8.50% through 2033. This growth is propelled by escalating global poultry consumption, driving demand for enhanced disease prevention and control. Increased awareness of biosecurity and animal welfare, alongside the rising incidence of poultry diseases, necessitates advanced diagnostic tools and prophylactic treatments. Innovations in product development, including novel vaccines and improved diagnostic assays, further fuel market expansion. The market is segmented by product type (vaccines, parasiticides, etc.) and test type (ELISA, PCR, etc.), with vaccines and ELISA tests currently dominating. North America and Europe represent mature markets, while the Asia-Pacific region offers substantial growth potential driven by expanding poultry production and rising disposable incomes. Potential restraints include stringent regulatory approvals and the impact of disease outbreaks. Key industry players, including Zoetis, Elanco, and Boehringer Ingelheim, are actively investing in research and development to drive innovation and meet the evolving needs of the poultry sector.
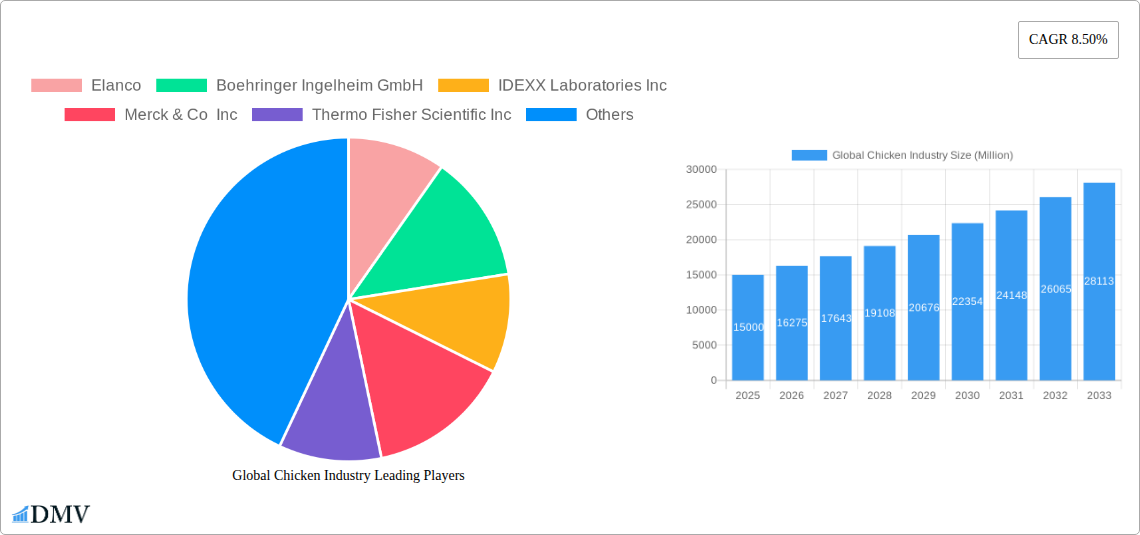
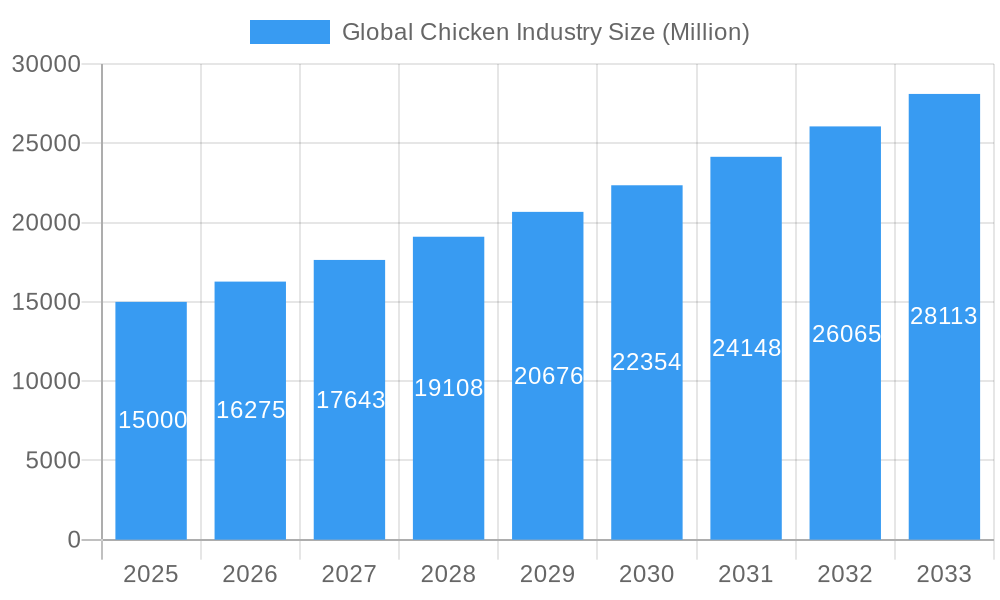
Global Chicken Industry Market Size (In Billion)
Market segmentation presents opportunities for specialized companies focusing on targeted solutions for prevalent poultry diseases. The growing concern over antibiotic resistance is accelerating the adoption of alternative therapies like phage therapy and immunomodulators. Advanced diagnostic technologies, such as PCR and molecular diagnostics, enable rapid and accurate disease detection, facilitating timely intervention and improved management. Government initiatives promoting biosecurity and disease surveillance further support this trend. Intense market competition is characterized by strategic partnerships, mergers, and acquisitions aimed at expanding product portfolios and geographic reach. Continued advancements in veterinary science and a growing emphasis on animal health will shape the future of this dynamic market.
Global Chicken Industry Company Market Share
Global Chicken Industry Market Report: 2019-2033
This comprehensive report provides an in-depth analysis of the global chicken industry, covering market size, segmentation, leading players, technological advancements, and future growth prospects from 2019 to 2033. The report utilizes a robust methodology, incorporating historical data (2019-2024), a base year of 2025, and forecasts extending to 2033, offering valuable insights for stakeholders across the value chain. The study period encompasses significant industry shifts, allowing for a nuanced understanding of current market dynamics and future trajectories.
Global Chicken Industry Market Composition & Trends
This section delves into the intricate structure of the global chicken industry, analyzing market concentration, innovation drivers, regulatory frameworks, substitute products, end-user profiles, and mergers & acquisitions (M&A) activities. The global chicken industry market size in 2025 is estimated at USD xx Million, projected to reach USD xx Million by 2033, exhibiting a CAGR of xx% during the forecast period.
Market Concentration: The industry is characterized by a moderately concentrated market structure, with the top 5 players accounting for approximately xx% of the market share in 2025. Zoetis Inc., Elanco, and Boehringer Ingelheim GmbH are among the leading players, leveraging their extensive product portfolios and global reach.
Innovation Catalysts: Technological advancements in diagnostics (ELISA, PCR, molecular diagnostics) and vaccine development are driving innovation. The increasing prevalence of poultry diseases is spurring the demand for effective preventative and therapeutic solutions.
Regulatory Landscape: Stringent regulatory approvals for veterinary pharmaceuticals and diagnostics influence market entry and product development strategies. Variations in regulations across different geographies impact market access and operational efficiency.
Substitute Products: The availability of alternative disease management strategies and cost-effective feed additives introduces competitive pressure in the market.
End-User Profiles: The primary end-users are commercial poultry farms, integrated poultry producers, and veterinary clinics. The increasing scale of commercial poultry farming influences market demand.
M&A Activities: The industry has witnessed significant M&A activity in recent years, with deal values exceeding USD xx Million in the past five years, driven by expansion strategies and technological integration.
Global Chicken Industry Industry Evolution
This section provides a detailed analysis of the global chicken industry's evolutionary path from 2019 to 2033. The industry has witnessed robust growth, driven by factors such as rising global meat consumption, increasing disposable incomes in developing economies, and the growing demand for cost-effective protein sources. Technological advancements in poultry farming practices, genetics, and disease management have significantly enhanced productivity and efficiency. Consumer preferences are shifting towards healthier and sustainably produced poultry products. This has spurred the development of novel vaccines, disease diagnostics, and feed additives designed to improve bird health, reduce disease outbreaks and enhance the sustainability of poultry production. The market demonstrated an average annual growth rate of xx% between 2019 and 2024 and is expected to maintain a CAGR of xx% from 2025 to 2033. Adoption of advanced diagnostics, such as PCR testing, has increased by xx% from 2019 to 2024, demonstrating a trend toward more precise and rapid disease detection.
Leading Regions, Countries, or Segments in Global Chicken Industry
The North American region is currently the dominant market for chicken industry products, holding xx% of the global market share in 2025, driven by significant investments in advanced poultry farming technologies and robust regulatory frameworks. Asia-Pacific is projected to witness the highest growth rate during the forecast period, fueled by rising demand and expanding poultry production capacity.
By Product Type:
- Vaccines: This segment holds the largest market share (xx%), driven by the increasing prevalence of poultry diseases and stringent biosecurity measures.
- Parasiticides: Significant growth is anticipated due to the growing concerns regarding parasitic infections in poultry.
- Anti-infectives: Market growth is propelled by the increasing incidence of bacterial infections in poultry.
- Medical Feed Additives: Demand is driven by the focus on improving animal health and productivity.
By Test Type:
- ELISA Test: Holds a significant market share, due to its cost-effectiveness and widespread adoption.
- PCR Test: Growing adoption due to its high sensitivity and specificity.
- Molecular Diagnostic Test: The market is expanding due to advancements in technology and increased diagnostic accuracy.
Key Drivers:
- Significant investments in research and development (R&D) are fueling product innovation across segments.
- Favorable regulatory support for the development and adoption of advanced technologies is enhancing market growth.
- Increased government initiatives to prevent and control avian diseases are creating opportunities.
Global Chicken Industry Product Innovations
Recent innovations include the development of more efficacious vaccines against prevalent avian diseases, advanced diagnostic tests that provide faster and more accurate results, and improved feed additives to enhance bird health and production efficiency. These advancements boast unique selling propositions such as improved efficacy, increased speed and accuracy, better disease control and enhanced performance.
Propelling Factors for Global Chicken Industry Growth
Technological advancements in disease diagnostics and vaccine development are key drivers, alongside economic growth driving increased meat consumption and supportive government policies promoting biosecurity and disease control. For example, the increased adoption of automated poultry farming systems contributes to greater efficiency and productivity, thereby boosting the overall growth of the industry.
Obstacles in the Global Chicken Industry Market
Regulatory hurdles related to the approval of new products, supply chain disruptions caused by disease outbreaks or geopolitical instability, and intense competition among industry players pose significant challenges. The impact of these challenges can be quantified through reduced profitability, delays in product launch, and increased operational costs. For example, the Avian Influenza outbreak in 2022 caused significant disruptions to global poultry production.
Future Opportunities in Global Chicken Industry
Emerging markets in developing countries, particularly in Asia and Africa, present significant expansion opportunities. Moreover, the rising consumer preference for sustainable poultry production practices creates demand for eco-friendly solutions. Advancements in precision livestock farming and personalized medicine for poultry offer further avenues for growth.
Major Players in the Global Chicken Industry Ecosystem
- Elanco
- Boehringer Ingelheim GmbH
- IDEXX Laboratories Inc
- Merck & Co Inc
- Thermo Fisher Scientific Inc
- Megacor Diagnostik GmbH
- Provet Pharma Private Limited
- Bimeda Inc
- Ceva Sante Animale
- Indovax
- Zoetis Inc
- Hester Biosciences Limited
Key Developments in Global Chicken Industry Industry
- May 2022: Canada invested over USD 3 Million in two projects to enhance emergency management and mitigate disease outbreaks in the livestock and poultry industries.
- April 2022: Ceva Animal Health launched CEVAC IBird, a live attenuated freeze-dried vaccine for avian infectious bronchitis virus in India.
Strategic Global Chicken Industry Market Forecast
The global chicken industry is poised for sustained growth, driven by several factors, including expanding poultry production, increasing demand for affordable protein, and advancements in disease management. The market is expected to exhibit robust expansion throughout the forecast period, presenting substantial opportunities for industry players who can adapt to evolving consumer preferences and technological advancements.
Global Chicken Industry Segmentation
-
1. Product Type
- 1.1. Vaccines
- 1.2. Parasiticides
- 1.3. Anti Infectives
- 1.4. Medical Feed Additives
- 1.5. Other Product Types
-
2. Test Type
- 2.1. ELISA (Enzyme-Linked Immunosorbent Assay) Test
- 2.2. PCR (Polymerase Chain Reaction) Test
- 2.3. Molecular Diagnostic Test
- 2.4. Other Test Types
Global Chicken Industry Segmentation By Geography
-
1. North America
- 1.1. United States
- 1.2. Canada
- 1.3. Mexico
-
2. Europe
- 2.1. Germany
- 2.2. United Kingdom
- 2.3. France
- 2.4. Italy
- 2.5. Spain
- 2.6. Rest of Europe
-
3. Asia Pacific
- 3.1. China
- 3.2. Japan
- 3.3. India
- 3.4. Australia
- 3.5. South Korea
- 3.6. Rest of Asia Pacific
-
4. Middle East and Africa
- 4.1. GCC
- 4.2. South Africa
- 4.3. Rest of Middle East and Africa
-
5. South America
- 5.1. Brazil
- 5.2. Argentina
- 5.3. Rest of South America
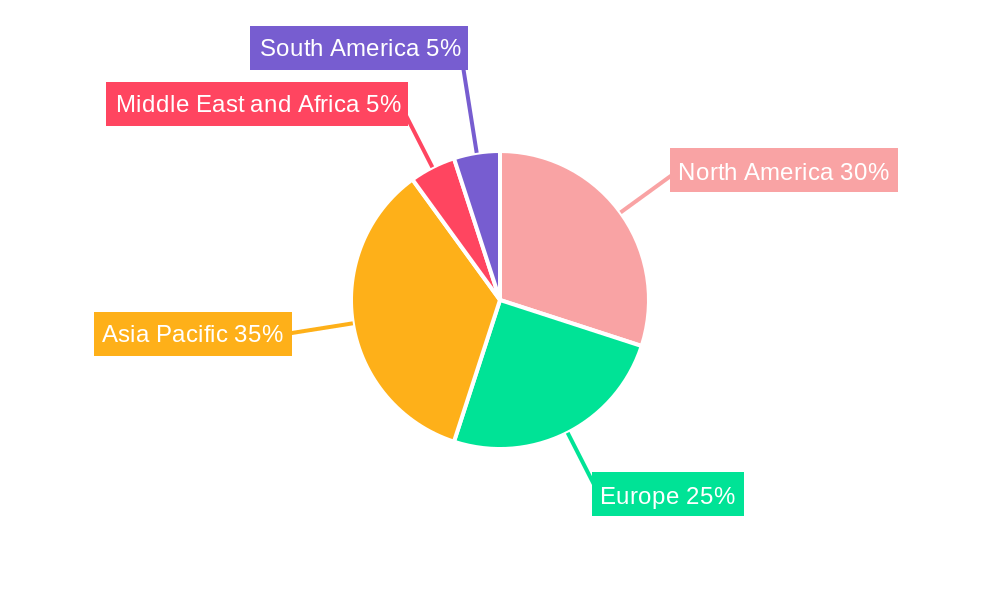
Global Chicken Industry Regional Market Share
Geographic Coverage of Global Chicken Industry
Global Chicken Industry REPORT HIGHLIGHTS
| Aspects | Details |
|---|---|
| Study Period | 2020-2034 |
| Base Year | 2025 |
| Estimated Year | 2026 |
| Forecast Period | 2026-2034 |
| Historical Period | 2020-2025 |
| Growth Rate | CAGR of 2.8% from 2020-2034 |
| Segmentation |
|
Table of Contents
- 1. Introduction
- 1.1. Research Scope
- 1.2. Market Segmentation
- 1.3. Research Objective
- 1.4. Definitions and Assumptions
- 2. Executive Summary
- 2.1. Market Snapshot
- 3. Market Dynamics
- 3.1. Market Drivers
- 3.2. Market Restrains
- 3.3. Market Trends
- 3.4. Market Opportunities
- 4. Market Factor Analysis
- 4.1. Porters Five Forces
- 4.1.1. Bargaining Power of Suppliers
- 4.1.2. Bargaining Power of Buyers
- 4.1.3. Threat of New Entrants
- 4.1.4. Threat of Substitutes
- 4.1.5. Competitive Rivalry
- 4.2. PESTEL analysis
- 4.3. BCG Analysis
- 4.3.1. Stars (High Growth, High Market Share)
- 4.3.2. Cash Cows (Low Growth, High Market Share)
- 4.3.3. Question Mark (High Growth, Low Market Share)
- 4.3.4. Dogs (Low Growth, Low Market Share)
- 4.4. Ansoff Matrix Analysis
- 4.5. Supply Chain Analysis
- 4.6. Regulatory Landscape
- 4.7. Current Market Potential and Opportunity Assessment (TAM–SAM–SOM Framework)
- 4.8. DMV Analyst Note
- 4.1. Porters Five Forces
- 5. Market Analysis, Insights and Forecast 2021-2033
- 5.1. Market Analysis, Insights and Forecast - by Product Type
- 5.1.1. Vaccines
- 5.1.2. Parasiticides
- 5.1.3. Anti Infectives
- 5.1.4. Medical Feed Additives
- 5.1.5. Other Product Types
- 5.2. Market Analysis, Insights and Forecast - by Test Type
- 5.2.1. ELISA (Enzyme-Linked Immunosorbent Assay) Test
- 5.2.2. PCR (Polymerase Chain Reaction) Test
- 5.2.3. Molecular Diagnostic Test
- 5.2.4. Other Test Types
- 5.3. Market Analysis, Insights and Forecast - by Region
- 5.3.1. North America
- 5.3.2. Europe
- 5.3.3. Asia Pacific
- 5.3.4. Middle East and Africa
- 5.3.5. South America
- 5.1. Market Analysis, Insights and Forecast - by Product Type
- 6. Global Chicken Industry Analysis, Insights and Forecast, 2021-2033
- 6.1. Market Analysis, Insights and Forecast - by Product Type
- 6.1.1. Vaccines
- 6.1.2. Parasiticides
- 6.1.3. Anti Infectives
- 6.1.4. Medical Feed Additives
- 6.1.5. Other Product Types
- 6.2. Market Analysis, Insights and Forecast - by Test Type
- 6.2.1. ELISA (Enzyme-Linked Immunosorbent Assay) Test
- 6.2.2. PCR (Polymerase Chain Reaction) Test
- 6.2.3. Molecular Diagnostic Test
- 6.2.4. Other Test Types
- 6.1. Market Analysis, Insights and Forecast - by Product Type
- 7. North America Global Chicken Industry Analysis, Insights and Forecast, 2020-2032
- 7.1. Market Analysis, Insights and Forecast - by Product Type
- 7.1.1. Vaccines
- 7.1.2. Parasiticides
- 7.1.3. Anti Infectives
- 7.1.4. Medical Feed Additives
- 7.1.5. Other Product Types
- 7.2. Market Analysis, Insights and Forecast - by Test Type
- 7.2.1. ELISA (Enzyme-Linked Immunosorbent Assay) Test
- 7.2.2. PCR (Polymerase Chain Reaction) Test
- 7.2.3. Molecular Diagnostic Test
- 7.2.4. Other Test Types
- 7.1. Market Analysis, Insights and Forecast - by Product Type
- 8. Europe Global Chicken Industry Analysis, Insights and Forecast, 2020-2032
- 8.1. Market Analysis, Insights and Forecast - by Product Type
- 8.1.1. Vaccines
- 8.1.2. Parasiticides
- 8.1.3. Anti Infectives
- 8.1.4. Medical Feed Additives
- 8.1.5. Other Product Types
- 8.2. Market Analysis, Insights and Forecast - by Test Type
- 8.2.1. ELISA (Enzyme-Linked Immunosorbent Assay) Test
- 8.2.2. PCR (Polymerase Chain Reaction) Test
- 8.2.3. Molecular Diagnostic Test
- 8.2.4. Other Test Types
- 8.1. Market Analysis, Insights and Forecast - by Product Type
- 9. Asia Pacific Global Chicken Industry Analysis, Insights and Forecast, 2020-2032
- 9.1. Market Analysis, Insights and Forecast - by Product Type
- 9.1.1. Vaccines
- 9.1.2. Parasiticides
- 9.1.3. Anti Infectives
- 9.1.4. Medical Feed Additives
- 9.1.5. Other Product Types
- 9.2. Market Analysis, Insights and Forecast - by Test Type
- 9.2.1. ELISA (Enzyme-Linked Immunosorbent Assay) Test
- 9.2.2. PCR (Polymerase Chain Reaction) Test
- 9.2.3. Molecular Diagnostic Test
- 9.2.4. Other Test Types
- 9.1. Market Analysis, Insights and Forecast - by Product Type
- 10. Middle East and Africa Global Chicken Industry Analysis, Insights and Forecast, 2020-2032
- 10.1. Market Analysis, Insights and Forecast - by Product Type
- 10.1.1. Vaccines
- 10.1.2. Parasiticides
- 10.1.3. Anti Infectives
- 10.1.4. Medical Feed Additives
- 10.1.5. Other Product Types
- 10.2. Market Analysis, Insights and Forecast - by Test Type
- 10.2.1. ELISA (Enzyme-Linked Immunosorbent Assay) Test
- 10.2.2. PCR (Polymerase Chain Reaction) Test
- 10.2.3. Molecular Diagnostic Test
- 10.2.4. Other Test Types
- 10.1. Market Analysis, Insights and Forecast - by Product Type
- 11. South America Global Chicken Industry Analysis, Insights and Forecast, 2020-2032
- 11.1. Market Analysis, Insights and Forecast - by Product Type
- 11.1.1. Vaccines
- 11.1.2. Parasiticides
- 11.1.3. Anti Infectives
- 11.1.4. Medical Feed Additives
- 11.1.5. Other Product Types
- 11.2. Market Analysis, Insights and Forecast - by Test Type
- 11.2.1. ELISA (Enzyme-Linked Immunosorbent Assay) Test
- 11.2.2. PCR (Polymerase Chain Reaction) Test
- 11.2.3. Molecular Diagnostic Test
- 11.2.4. Other Test Types
- 11.1. Market Analysis, Insights and Forecast - by Product Type
- 12. Competitive Analysis
- 12.1. Company Profiles
- 12.1.1 Elanco
- 12.1.1.1. Company Overview
- 12.1.1.2. Products
- 12.1.1.3. Company Financials
- 12.1.1.4. SWOT Analysis
- 12.1.2 Boehringer Ingelheim GmbH
- 12.1.2.1. Company Overview
- 12.1.2.2. Products
- 12.1.2.3. Company Financials
- 12.1.2.4. SWOT Analysis
- 12.1.3 IDEXX Laboratories Inc
- 12.1.3.1. Company Overview
- 12.1.3.2. Products
- 12.1.3.3. Company Financials
- 12.1.3.4. SWOT Analysis
- 12.1.4 Merck & Co Inc
- 12.1.4.1. Company Overview
- 12.1.4.2. Products
- 12.1.4.3. Company Financials
- 12.1.4.4. SWOT Analysis
- 12.1.5 Thermo Fisher Scientific Inc
- 12.1.5.1. Company Overview
- 12.1.5.2. Products
- 12.1.5.3. Company Financials
- 12.1.5.4. SWOT Analysis
- 12.1.6 Megacor Diagnostik GmbH
- 12.1.6.1. Company Overview
- 12.1.6.2. Products
- 12.1.6.3. Company Financials
- 12.1.6.4. SWOT Analysis
- 12.1.7 Provet Pharma Private Limited
- 12.1.7.1. Company Overview
- 12.1.7.2. Products
- 12.1.7.3. Company Financials
- 12.1.7.4. SWOT Analysis
- 12.1.8 Bimeda Inc
- 12.1.8.1. Company Overview
- 12.1.8.2. Products
- 12.1.8.3. Company Financials
- 12.1.8.4. SWOT Analysis
- 12.1.9 Ceva Sante Animale
- 12.1.9.1. Company Overview
- 12.1.9.2. Products
- 12.1.9.3. Company Financials
- 12.1.9.4. SWOT Analysis
- 12.1.10 Indovax
- 12.1.10.1. Company Overview
- 12.1.10.2. Products
- 12.1.10.3. Company Financials
- 12.1.10.4. SWOT Analysis
- 12.1.11 Zoetis Inc
- 12.1.11.1. Company Overview
- 12.1.11.2. Products
- 12.1.11.3. Company Financials
- 12.1.11.4. SWOT Analysis
- 12.1.12 Hester Biosciences Limited
- 12.1.12.1. Company Overview
- 12.1.12.2. Products
- 12.1.12.3. Company Financials
- 12.1.12.4. SWOT Analysis
- 12.1.1 Elanco
- 12.2. Market Entropy
- 12.2.1 Company's Key Areas Served
- 12.2.2 Recent Developments
- 12.3. Company Market Share Analysis 2025
- 12.3.1 Top 5 Companies Market Share Analysis
- 12.3.2 Top 3 Companies Market Share Analysis
- 12.4. List of Potential Customers
- 13. Research Methodology
List of Figures
- Figure 1: Global Global Chicken Industry Revenue Breakdown (billion, %) by Region 2025 & 2033
- Figure 2: Global Global Chicken Industry Volume Breakdown (K Unit, %) by Region 2025 & 2033
- Figure 3: North America Global Chicken Industry Revenue (billion), by Product Type 2025 & 2033
- Figure 4: North America Global Chicken Industry Volume (K Unit), by Product Type 2025 & 2033
- Figure 5: North America Global Chicken Industry Revenue Share (%), by Product Type 2025 & 2033
- Figure 6: North America Global Chicken Industry Volume Share (%), by Product Type 2025 & 2033
- Figure 7: North America Global Chicken Industry Revenue (billion), by Test Type 2025 & 2033
- Figure 8: North America Global Chicken Industry Volume (K Unit), by Test Type 2025 & 2033
- Figure 9: North America Global Chicken Industry Revenue Share (%), by Test Type 2025 & 2033
- Figure 10: North America Global Chicken Industry Volume Share (%), by Test Type 2025 & 2033
- Figure 11: North America Global Chicken Industry Revenue (billion), by Country 2025 & 2033
- Figure 12: North America Global Chicken Industry Volume (K Unit), by Country 2025 & 2033
- Figure 13: North America Global Chicken Industry Revenue Share (%), by Country 2025 & 2033
- Figure 14: North America Global Chicken Industry Volume Share (%), by Country 2025 & 2033
- Figure 15: Europe Global Chicken Industry Revenue (billion), by Product Type 2025 & 2033
- Figure 16: Europe Global Chicken Industry Volume (K Unit), by Product Type 2025 & 2033
- Figure 17: Europe Global Chicken Industry Revenue Share (%), by Product Type 2025 & 2033
- Figure 18: Europe Global Chicken Industry Volume Share (%), by Product Type 2025 & 2033
- Figure 19: Europe Global Chicken Industry Revenue (billion), by Test Type 2025 & 2033
- Figure 20: Europe Global Chicken Industry Volume (K Unit), by Test Type 2025 & 2033
- Figure 21: Europe Global Chicken Industry Revenue Share (%), by Test Type 2025 & 2033
- Figure 22: Europe Global Chicken Industry Volume Share (%), by Test Type 2025 & 2033
- Figure 23: Europe Global Chicken Industry Revenue (billion), by Country 2025 & 2033
- Figure 24: Europe Global Chicken Industry Volume (K Unit), by Country 2025 & 2033
- Figure 25: Europe Global Chicken Industry Revenue Share (%), by Country 2025 & 2033
- Figure 26: Europe Global Chicken Industry Volume Share (%), by Country 2025 & 2033
- Figure 27: Asia Pacific Global Chicken Industry Revenue (billion), by Product Type 2025 & 2033
- Figure 28: Asia Pacific Global Chicken Industry Volume (K Unit), by Product Type 2025 & 2033
- Figure 29: Asia Pacific Global Chicken Industry Revenue Share (%), by Product Type 2025 & 2033
- Figure 30: Asia Pacific Global Chicken Industry Volume Share (%), by Product Type 2025 & 2033
- Figure 31: Asia Pacific Global Chicken Industry Revenue (billion), by Test Type 2025 & 2033
- Figure 32: Asia Pacific Global Chicken Industry Volume (K Unit), by Test Type 2025 & 2033
- Figure 33: Asia Pacific Global Chicken Industry Revenue Share (%), by Test Type 2025 & 2033
- Figure 34: Asia Pacific Global Chicken Industry Volume Share (%), by Test Type 2025 & 2033
- Figure 35: Asia Pacific Global Chicken Industry Revenue (billion), by Country 2025 & 2033
- Figure 36: Asia Pacific Global Chicken Industry Volume (K Unit), by Country 2025 & 2033
- Figure 37: Asia Pacific Global Chicken Industry Revenue Share (%), by Country 2025 & 2033
- Figure 38: Asia Pacific Global Chicken Industry Volume Share (%), by Country 2025 & 2033
- Figure 39: Middle East and Africa Global Chicken Industry Revenue (billion), by Product Type 2025 & 2033
- Figure 40: Middle East and Africa Global Chicken Industry Volume (K Unit), by Product Type 2025 & 2033
- Figure 41: Middle East and Africa Global Chicken Industry Revenue Share (%), by Product Type 2025 & 2033
- Figure 42: Middle East and Africa Global Chicken Industry Volume Share (%), by Product Type 2025 & 2033
- Figure 43: Middle East and Africa Global Chicken Industry Revenue (billion), by Test Type 2025 & 2033
- Figure 44: Middle East and Africa Global Chicken Industry Volume (K Unit), by Test Type 2025 & 2033
- Figure 45: Middle East and Africa Global Chicken Industry Revenue Share (%), by Test Type 2025 & 2033
- Figure 46: Middle East and Africa Global Chicken Industry Volume Share (%), by Test Type 2025 & 2033
- Figure 47: Middle East and Africa Global Chicken Industry Revenue (billion), by Country 2025 & 2033
- Figure 48: Middle East and Africa Global Chicken Industry Volume (K Unit), by Country 2025 & 2033
- Figure 49: Middle East and Africa Global Chicken Industry Revenue Share (%), by Country 2025 & 2033
- Figure 50: Middle East and Africa Global Chicken Industry Volume Share (%), by Country 2025 & 2033
- Figure 51: South America Global Chicken Industry Revenue (billion), by Product Type 2025 & 2033
- Figure 52: South America Global Chicken Industry Volume (K Unit), by Product Type 2025 & 2033
- Figure 53: South America Global Chicken Industry Revenue Share (%), by Product Type 2025 & 2033
- Figure 54: South America Global Chicken Industry Volume Share (%), by Product Type 2025 & 2033
- Figure 55: South America Global Chicken Industry Revenue (billion), by Test Type 2025 & 2033
- Figure 56: South America Global Chicken Industry Volume (K Unit), by Test Type 2025 & 2033
- Figure 57: South America Global Chicken Industry Revenue Share (%), by Test Type 2025 & 2033
- Figure 58: South America Global Chicken Industry Volume Share (%), by Test Type 2025 & 2033
- Figure 59: South America Global Chicken Industry Revenue (billion), by Country 2025 & 2033
- Figure 60: South America Global Chicken Industry Volume (K Unit), by Country 2025 & 2033
- Figure 61: South America Global Chicken Industry Revenue Share (%), by Country 2025 & 2033
- Figure 62: South America Global Chicken Industry Volume Share (%), by Country 2025 & 2033
List of Tables
- Table 1: Global Chicken Industry Revenue billion Forecast, by Product Type 2020 & 2033
- Table 2: Global Chicken Industry Volume K Unit Forecast, by Product Type 2020 & 2033
- Table 3: Global Chicken Industry Revenue billion Forecast, by Test Type 2020 & 2033
- Table 4: Global Chicken Industry Volume K Unit Forecast, by Test Type 2020 & 2033
- Table 5: Global Chicken Industry Revenue billion Forecast, by Region 2020 & 2033
- Table 6: Global Chicken Industry Volume K Unit Forecast, by Region 2020 & 2033
- Table 7: Global Chicken Industry Revenue billion Forecast, by Product Type 2020 & 2033
- Table 8: Global Chicken Industry Volume K Unit Forecast, by Product Type 2020 & 2033
- Table 9: Global Chicken Industry Revenue billion Forecast, by Test Type 2020 & 2033
- Table 10: Global Chicken Industry Volume K Unit Forecast, by Test Type 2020 & 2033
- Table 11: Global Chicken Industry Revenue billion Forecast, by Country 2020 & 2033
- Table 12: Global Chicken Industry Volume K Unit Forecast, by Country 2020 & 2033
- Table 13: United States Global Chicken Industry Revenue (billion) Forecast, by Application 2020 & 2033
- Table 14: United States Global Chicken Industry Volume (K Unit) Forecast, by Application 2020 & 2033
- Table 15: Canada Global Chicken Industry Revenue (billion) Forecast, by Application 2020 & 2033
- Table 16: Canada Global Chicken Industry Volume (K Unit) Forecast, by Application 2020 & 2033
- Table 17: Mexico Global Chicken Industry Revenue (billion) Forecast, by Application 2020 & 2033
- Table 18: Mexico Global Chicken Industry Volume (K Unit) Forecast, by Application 2020 & 2033
- Table 19: Global Chicken Industry Revenue billion Forecast, by Product Type 2020 & 2033
- Table 20: Global Chicken Industry Volume K Unit Forecast, by Product Type 2020 & 2033
- Table 21: Global Chicken Industry Revenue billion Forecast, by Test Type 2020 & 2033
- Table 22: Global Chicken Industry Volume K Unit Forecast, by Test Type 2020 & 2033
- Table 23: Global Chicken Industry Revenue billion Forecast, by Country 2020 & 2033
- Table 24: Global Chicken Industry Volume K Unit Forecast, by Country 2020 & 2033
- Table 25: Germany Global Chicken Industry Revenue (billion) Forecast, by Application 2020 & 2033
- Table 26: Germany Global Chicken Industry Volume (K Unit) Forecast, by Application 2020 & 2033
- Table 27: United Kingdom Global Chicken Industry Revenue (billion) Forecast, by Application 2020 & 2033
- Table 28: United Kingdom Global Chicken Industry Volume (K Unit) Forecast, by Application 2020 & 2033
- Table 29: France Global Chicken Industry Revenue (billion) Forecast, by Application 2020 & 2033
- Table 30: France Global Chicken Industry Volume (K Unit) Forecast, by Application 2020 & 2033
- Table 31: Italy Global Chicken Industry Revenue (billion) Forecast, by Application 2020 & 2033
- Table 32: Italy Global Chicken Industry Volume (K Unit) Forecast, by Application 2020 & 2033
- Table 33: Spain Global Chicken Industry Revenue (billion) Forecast, by Application 2020 & 2033
- Table 34: Spain Global Chicken Industry Volume (K Unit) Forecast, by Application 2020 & 2033
- Table 35: Rest of Europe Global Chicken Industry Revenue (billion) Forecast, by Application 2020 & 2033
- Table 36: Rest of Europe Global Chicken Industry Volume (K Unit) Forecast, by Application 2020 & 2033
- Table 37: Global Chicken Industry Revenue billion Forecast, by Product Type 2020 & 2033
- Table 38: Global Chicken Industry Volume K Unit Forecast, by Product Type 2020 & 2033
- Table 39: Global Chicken Industry Revenue billion Forecast, by Test Type 2020 & 2033
- Table 40: Global Chicken Industry Volume K Unit Forecast, by Test Type 2020 & 2033
- Table 41: Global Chicken Industry Revenue billion Forecast, by Country 2020 & 2033
- Table 42: Global Chicken Industry Volume K Unit Forecast, by Country 2020 & 2033
- Table 43: China Global Chicken Industry Revenue (billion) Forecast, by Application 2020 & 2033
- Table 44: China Global Chicken Industry Volume (K Unit) Forecast, by Application 2020 & 2033
- Table 45: Japan Global Chicken Industry Revenue (billion) Forecast, by Application 2020 & 2033
- Table 46: Japan Global Chicken Industry Volume (K Unit) Forecast, by Application 2020 & 2033
- Table 47: India Global Chicken Industry Revenue (billion) Forecast, by Application 2020 & 2033
- Table 48: India Global Chicken Industry Volume (K Unit) Forecast, by Application 2020 & 2033
- Table 49: Australia Global Chicken Industry Revenue (billion) Forecast, by Application 2020 & 2033
- Table 50: Australia Global Chicken Industry Volume (K Unit) Forecast, by Application 2020 & 2033
- Table 51: South Korea Global Chicken Industry Revenue (billion) Forecast, by Application 2020 & 2033
- Table 52: South Korea Global Chicken Industry Volume (K Unit) Forecast, by Application 2020 & 2033
- Table 53: Rest of Asia Pacific Global Chicken Industry Revenue (billion) Forecast, by Application 2020 & 2033
- Table 54: Rest of Asia Pacific Global Chicken Industry Volume (K Unit) Forecast, by Application 2020 & 2033
- Table 55: Global Chicken Industry Revenue billion Forecast, by Product Type 2020 & 2033
- Table 56: Global Chicken Industry Volume K Unit Forecast, by Product Type 2020 & 2033
- Table 57: Global Chicken Industry Revenue billion Forecast, by Test Type 2020 & 2033
- Table 58: Global Chicken Industry Volume K Unit Forecast, by Test Type 2020 & 2033
- Table 59: Global Chicken Industry Revenue billion Forecast, by Country 2020 & 2033
- Table 60: Global Chicken Industry Volume K Unit Forecast, by Country 2020 & 2033
- Table 61: GCC Global Chicken Industry Revenue (billion) Forecast, by Application 2020 & 2033
- Table 62: GCC Global Chicken Industry Volume (K Unit) Forecast, by Application 2020 & 2033
- Table 63: South Africa Global Chicken Industry Revenue (billion) Forecast, by Application 2020 & 2033
- Table 64: South Africa Global Chicken Industry Volume (K Unit) Forecast, by Application 2020 & 2033
- Table 65: Rest of Middle East and Africa Global Chicken Industry Revenue (billion) Forecast, by Application 2020 & 2033
- Table 66: Rest of Middle East and Africa Global Chicken Industry Volume (K Unit) Forecast, by Application 2020 & 2033
- Table 67: Global Chicken Industry Revenue billion Forecast, by Product Type 2020 & 2033
- Table 68: Global Chicken Industry Volume K Unit Forecast, by Product Type 2020 & 2033
- Table 69: Global Chicken Industry Revenue billion Forecast, by Test Type 2020 & 2033
- Table 70: Global Chicken Industry Volume K Unit Forecast, by Test Type 2020 & 2033
- Table 71: Global Chicken Industry Revenue billion Forecast, by Country 2020 & 2033
- Table 72: Global Chicken Industry Volume K Unit Forecast, by Country 2020 & 2033
- Table 73: Brazil Global Chicken Industry Revenue (billion) Forecast, by Application 2020 & 2033
- Table 74: Brazil Global Chicken Industry Volume (K Unit) Forecast, by Application 2020 & 2033
- Table 75: Argentina Global Chicken Industry Revenue (billion) Forecast, by Application 2020 & 2033
- Table 76: Argentina Global Chicken Industry Volume (K Unit) Forecast, by Application 2020 & 2033
- Table 77: Rest of South America Global Chicken Industry Revenue (billion) Forecast, by Application 2020 & 2033
- Table 78: Rest of South America Global Chicken Industry Volume (K Unit) Forecast, by Application 2020 & 2033
Frequently Asked Questions
1. What is the projected Compound Annual Growth Rate (CAGR) of the Global Chicken Industry?
The projected CAGR is approximately 2.8%.
2. Which companies are prominent players in the Global Chicken Industry?
Key companies in the market include Elanco, Boehringer Ingelheim GmbH, IDEXX Laboratories Inc, Merck & Co Inc, Thermo Fisher Scientific Inc, Megacor Diagnostik GmbH, Provet Pharma Private Limited, Bimeda Inc , Ceva Sante Animale, Indovax, Zoetis Inc, Hester Biosciences Limited.
3. What are the main segments of the Global Chicken Industry?
The market segments include Product Type, Test Type.
4. Can you provide details about the market size?
The market size is estimated to be USD 316.77 billion as of 2022.
5. What are some drivers contributing to market growth?
Increasing Initiatives by Government and Animal Welfare Associations; Rising Occurrence of Zoonotic Diseases; Rise in Demand for Poultry-derived Food Products.
6. What are the notable trends driving market growth?
The Vaccines Segment is Expected to Show Better Growth Over the Forecast Period.
7. Are there any restraints impacting market growth?
Use of Counterfeit Medicines; Lack of Veterinarians and Shortage of Skilled Farm Workers.
8. Can you provide examples of recent developments in the market?
In May 2022, Canada invested over USD 3 million in two projects to enhance emergency management and develop risk assessments and strategies to mitigate disease outbreaks. This project will help enhance the emergency management capabilities of Canada's livestock and poultry industries to remain ready in the face of adverse events and a continually evolving disease landscape.
9. What pricing options are available for accessing the report?
Pricing options include single-user, multi-user, and enterprise licenses priced at USD 4750, USD 5250, and USD 8750 respectively.
10. Is the market size provided in terms of value or volume?
The market size is provided in terms of value, measured in billion and volume, measured in K Unit.
11. Are there any specific market keywords associated with the report?
Yes, the market keyword associated with the report is "Global Chicken Industry," which aids in identifying and referencing the specific market segment covered.
12. How do I determine which pricing option suits my needs best?
The pricing options vary based on user requirements and access needs. Individual users may opt for single-user licenses, while businesses requiring broader access may choose multi-user or enterprise licenses for cost-effective access to the report.
13. Are there any additional resources or data provided in the Global Chicken Industry report?
While the report offers comprehensive insights, it's advisable to review the specific contents or supplementary materials provided to ascertain if additional resources or data are available.
14. How can I stay updated on further developments or reports in the Global Chicken Industry?
To stay informed about further developments, trends, and reports in the Global Chicken Industry, consider subscribing to industry newsletters, following relevant companies and organizations, or regularly checking reputable industry news sources and publications.
Methodology
Step 1 - Identification of Relevant Samples Size from Population Database


Step 2 - Approaches for Defining Global Market Size (Value, Volume* & Price*)

Note*: In applicable scenarios
Step 3 - Data Sources
Primary Research
- Web Analytics
- Survey Reports
- Research Institute
- Latest Research Reports
- Opinion Leaders
Secondary Research
- Annual Reports
- White Paper
- Latest Press Release
- Industry Association
- Paid Database
- Investor Presentations

Step 4 - Data Triangulation
Involves using different sources of information in order to increase the validity of a study
These sources are likely to be stakeholders in a program - participants, other researchers, program staff, other community members, and so on.
Then we put all data in single framework & apply various statistical tools to find out the dynamic on the market.
During the analysis stage, feedback from the stakeholder groups would be compared to determine areas of agreement as well as areas of divergence