

Key Insights
The veterinary biomarker market is experiencing robust growth, projected to reach a substantial size driven by several key factors. The increasing prevalence of chronic diseases in companion animals, coupled with the rising demand for advanced diagnostic tools and personalized medicine, fuels market expansion. Technological advancements in biomarker detection technologies, such as ELISA and PCR, are enhancing diagnostic accuracy and efficiency, further propelling market growth. The rising adoption of companion animals globally and increasing pet owner spending on animal healthcare contribute significantly to market expansion. Furthermore, the development of novel biomarkers specific to various animal species and diseases is creating new opportunities within the market. The market is segmented by application (disease diagnostics, preclinical research, other), disease type (inflammatory & infectious diseases, cardiovascular diseases, skeletal muscle diseases, tumors, other), animal type (companion animals, farm animals), and product type (biomarkers, kits & reagents, biomarker readers). North America and Europe currently hold significant market share due to established healthcare infrastructure and higher pet ownership rates, but the Asia-Pacific region is expected to witness substantial growth in the coming years due to rising pet adoption and increasing investments in veterinary healthcare.
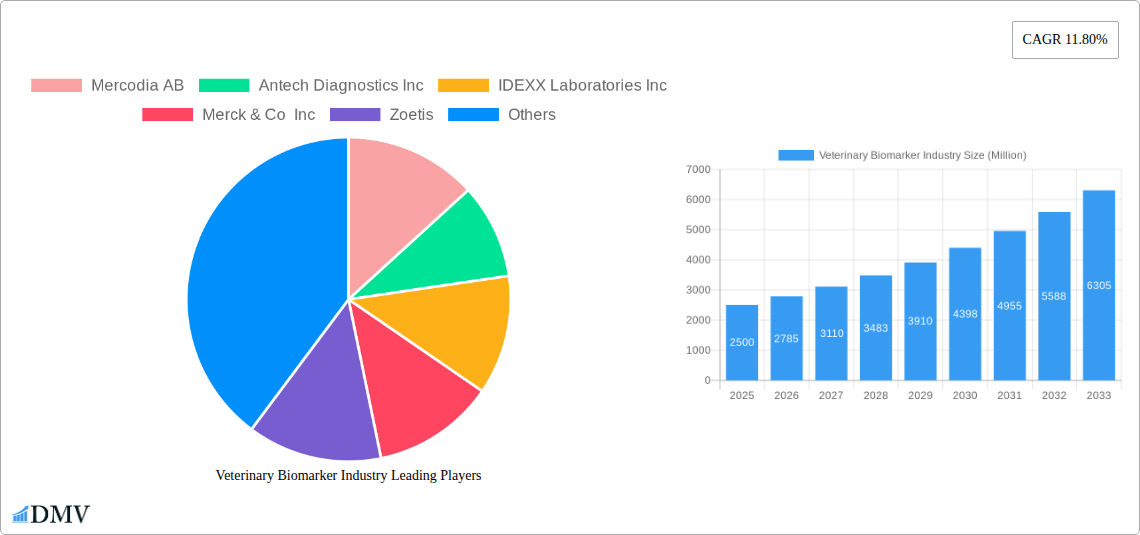
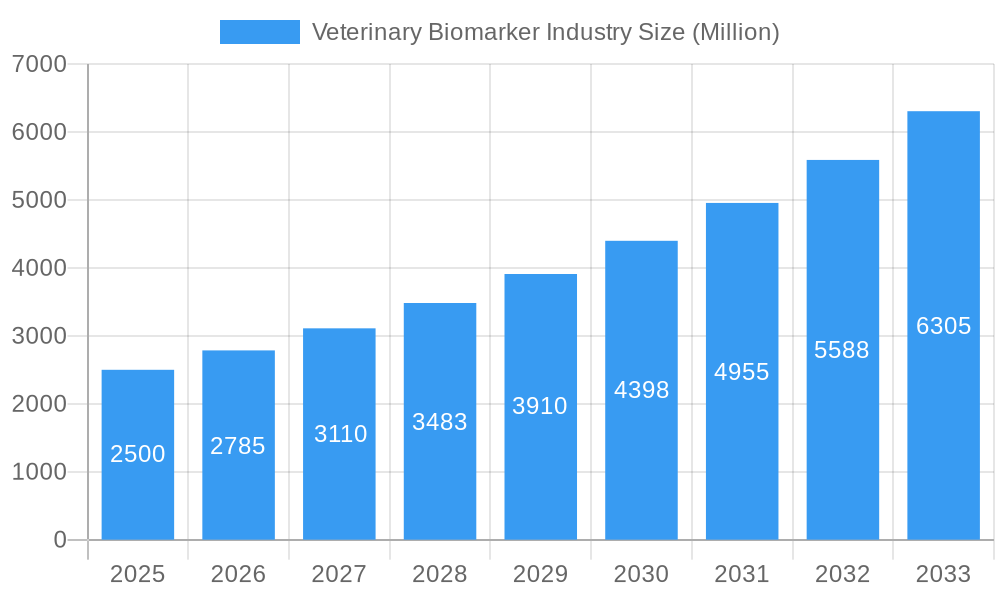
Veterinary Biomarker Industry Market Size (In Billion)
Competition within the veterinary biomarker market is moderately high, with established players like IDEXX Laboratories, Zoetis, and Merck & Co. competing alongside smaller, specialized companies. These companies are focusing on strategic collaborations, acquisitions, and product development to maintain their market positions. Regulatory approvals and reimbursement policies in different regions influence market dynamics. Despite the favorable growth outlook, challenges exist, such as the high cost of some biomarker tests and the need for standardized testing protocols across various veterinary practices. Future growth will depend on the continuous development and validation of new biomarkers, improvements in test accessibility and affordability, and increased awareness among veterinary professionals about the benefits of biomarker testing. The market is poised for significant expansion driven by unmet clinical needs and ongoing technological advancements.
Veterinary Biomarker Industry Company Market Share
Veterinary Biomarker Industry: A Comprehensive Market Report (2019-2033)
This insightful report provides a detailed analysis of the veterinary biomarker industry, projecting a market value of $XX Million by 2033. The study period spans 2019-2033, with 2025 serving as the base and estimated year. The forecast period covers 2025-2033, and the historical period encompasses 2019-2024. This comprehensive document delves into market segmentation, key players, technological advancements, and future growth prospects, equipping stakeholders with the necessary information for strategic decision-making.
Veterinary Biomarker Industry Market Composition & Trends
The veterinary biomarker market is characterized by a moderately concentrated landscape, with key players like IDEXX Laboratories Inc, Zoetis, and Merck & Co Inc holding significant market share. However, the market exhibits substantial potential for growth fueled by continuous innovation in diagnostic techniques and increasing demand for improved animal healthcare. The regulatory landscape, while generally supportive of advancements in veterinary diagnostics, presents some complexities that vary across regions. Substitute products, such as traditional diagnostic methods, continue to exist but face growing competition from the superior accuracy and efficiency offered by biomarkers. The end-user profile predominantly consists of veterinary clinics, research institutions, and pharmaceutical companies. Mergers and acquisitions (M&A) activity in the sector is steadily increasing, with deal values averaging $XX Million in recent years. The report includes a detailed analysis of major M&A deals, examining their impact on market dynamics and competitive structure.
- Market Share Distribution: IDEXX Laboratories Inc: 25%, Zoetis: 20%, Merck & Co Inc: 15%, Others: 40% (Approximate figures)
- M&A Activity: Average deal value: $XX Million (2020-2024)
- Innovation Catalysts: Increasing prevalence of chronic diseases in companion animals, advancements in molecular diagnostics
- Regulatory Landscape: Varied by region, generally supportive but with specific requirements for regulatory approval.
Veterinary Biomarker Industry Industry Evolution
The veterinary biomarker market has witnessed significant growth in recent years, driven by technological advancements and increasing awareness of the benefits of early disease detection. This growth is further fueled by the rising prevalence of chronic diseases in companion animals and increasing investment in animal health research and development. The market has expanded at a Compound Annual Growth Rate (CAGR) of XX% during the historical period (2019-2024) and is expected to maintain a CAGR of XX% during the forecast period (2025-2033). This growth trajectory is primarily driven by factors such as the increasing adoption of advanced diagnostic techniques, like PCR-based assays and ELISA, and rising demand for point-of-care diagnostic solutions. Furthermore, the growing application of biomarkers in preclinical research and drug development contributes to significant market expansion. The increasing demand for personalized medicine in veterinary care is also a major factor. Adoption metrics reveal a strong preference for biomarker-based diagnostics among veterinary professionals due to their high sensitivity and specificity.
Leading Regions, Countries, or Segments in Veterinary Biomarker Industry
The North American region currently dominates the veterinary biomarker market, driven by high veterinary healthcare expenditure, robust research infrastructure, and early adoption of advanced diagnostic technologies. Within this region, the United States holds the largest market share.
- By Application: Disease diagnostics holds the largest market share due to the high prevalence of various diseases in companion animals.
- By Disease Type: Inflammatory and infectious diseases represent a significant market segment, followed by tumors and cardiovascular diseases.
- By Animal Type: Companion animals, particularly dogs and cats, constitute the largest segment, due to higher owner spending and greater access to advanced veterinary care.
- By Product Type: Kits and reagents dominate the product segment, driven by high demand for convenient and cost-effective diagnostic solutions.
Key Drivers:
- High Investment in R&D: Significant funding for the development of new biomarkers and diagnostic technologies.
- Stringent Regulatory Support: Government initiatives supporting the development and adoption of advanced veterinary diagnostics.
- Favorable Reimbursement Policies: Insurance coverage for veterinary diagnostics promoting wider adoption.
Veterinary Biomarker Industry Product Innovations
Recent innovations in the veterinary biomarker industry focus on developing rapid, highly sensitive, and cost-effective diagnostic tools. These include advanced point-of-care tests, microfluidic devices, and multiplex assays. These innovations enable faster diagnosis, facilitating timely interventions and improved patient outcomes. Unique selling propositions include improved accuracy, reduced testing time, and minimally invasive sample collection methods. The integration of artificial intelligence and machine learning into diagnostic platforms further enhances the accuracy and efficiency of biomarker analysis.
Propelling Factors for Veterinary Biomarker Industry Growth
Technological advancements are a major driver of market growth, with improvements in diagnostic techniques leading to better accuracy and efficiency. The rising prevalence of chronic diseases in pets is another significant factor. Increased pet ownership and owner willingness to spend on their pets' health also contribute substantially. Favorable regulatory environments and government initiatives supporting animal health research further fuel market expansion.
Obstacles in the Veterinary Biomarker Industry Market
High costs associated with biomarker development and validation pose a significant challenge. The need for specialized equipment and trained personnel can limit accessibility. Supply chain disruptions and global health crises can negatively impact the availability of reagents and testing supplies. Intense competition among established players also presents a challenge for new entrants.
Future Opportunities in Veterinary Biomarker Industry
The development of novel biomarkers for emerging diseases in companion and farm animals will open new market opportunities. Expansion into developing economies with growing pet ownership will provide significant growth potential. The integration of advanced technologies such as AI and big data analytics will further enhance diagnostic capabilities and efficiency.
Major Players in the Veterinary Biomarker Industry Ecosystem
- Mercodia AB
- Antech Diagnostics Inc
- IDEXX Laboratories Inc
- Merck & Co Inc
- Zoetis
- ACUVET BIOTECH
- Veterinary Biomarkers Inc
- MI:RNA Diagnostics Ltd
- Avacta Animal Health Limited
- Virbac
Key Developments in Veterinary Biomarker Industry Industry
- October 2022: Researchers from Boston University received a USD 4.6 Million grant for developing lung cancer biomarkers. This indicates growing investment in biomarker research and validates the industry's future growth potential.
- October 2021: Zoetis expanded its manufacturing facility, boosting production of veterinary monoclonal antibodies (mAbs). This signifies increased capacity to meet growing market demand and highlights investment in the industry's infrastructure.
Strategic Veterinary Biomarker Industry Market Forecast
The veterinary biomarker market is poised for robust growth, driven by technological advancements, rising pet ownership, and increased awareness of animal health. Continued innovation, particularly in point-of-care diagnostics and personalized medicine, will be crucial for driving future market expansion. The market is expected to see a significant increase in adoption, especially in emerging economies, leading to substantial growth in the coming years. The focus will remain on expanding into new markets, developing novel biomarkers for emerging diseases, and integrating advanced technologies into diagnostic tools.
Veterinary Biomarker Industry Segmentation
-
1. Animal Type
-
1.1. Companion Animals
- 1.1.1. Dogs
- 1.1.2. Cats
- 1.1.3. Other Companion Animals
-
1.2. Farm Animals
- 1.2.1. Cows
- 1.2.2. Pigs
- 1.2.3. Other Farm Animals
-
1.1. Companion Animals
-
2. Product Type
- 2.1. Biomarkers, Kits & Reagents
- 2.2. Biomarker Readers
-
3. Application
- 3.1. Disease Diagnostics
- 3.2. Preclinical Research
- 3.3. Other Applications
-
4. Disease Type
- 4.1. Inflammatory & Infectious Diseases
- 4.2. Cardiovascular Diseases
- 4.3. Skeletal Muscle Diseases
- 4.4. Tumors
- 4.5. Other Disease Types
Veterinary Biomarker Industry Segmentation By Geography
-
1. North America
- 1.1. United States
- 1.2. Canada
- 1.3. Mexico
-
2. Europe
- 2.1. Germany
- 2.2. United Kingdom
- 2.3. France
- 2.4. Italy
- 2.5. Spain
- 2.6. Rest of Europe
-
3. Asia Pacific
- 3.1. China
- 3.2. Japan
- 3.3. India
- 3.4. Australia
- 3.5. South Korea
- 3.6. Rest of Asia Pacific
-
4. Middle East and Africa
- 4.1. GCC
- 4.2. South Africa
- 4.3. Rest of Middle East and Africa
-
5. South America
- 5.1. Brazil
- 5.2. Argentina
- 5.3. Rest of South America
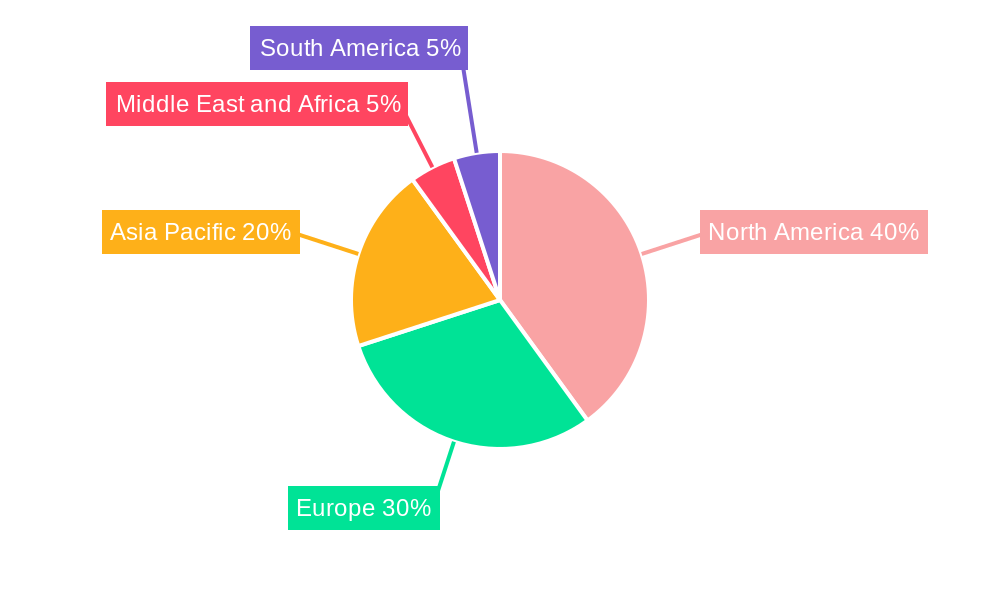
Veterinary Biomarker Industry Regional Market Share
Geographic Coverage of Veterinary Biomarker Industry
Veterinary Biomarker Industry REPORT HIGHLIGHTS
| Aspects | Details |
|---|---|
| Study Period | 2020-2034 |
| Base Year | 2025 |
| Estimated Year | 2026 |
| Forecast Period | 2026-2034 |
| Historical Period | 2020-2025 |
| Growth Rate | CAGR of 8.72% from 2020-2034 |
| Segmentation |
|
Table of Contents
- 1. Introduction
- 1.1. Research Scope
- 1.2. Market Segmentation
- 1.3. Research Objective
- 1.4. Definitions and Assumptions
- 2. Executive Summary
- 2.1. Market Snapshot
- 3. Market Dynamics
- 3.1. Market Drivers
- 3.2. Market Restrains
- 3.3. Market Trends
- 3.4. Market Opportunities
- 4. Market Factor Analysis
- 4.1. Porters Five Forces
- 4.1.1. Bargaining Power of Suppliers
- 4.1.2. Bargaining Power of Buyers
- 4.1.3. Threat of New Entrants
- 4.1.4. Threat of Substitutes
- 4.1.5. Competitive Rivalry
- 4.2. PESTEL analysis
- 4.3. BCG Analysis
- 4.3.1. Stars (High Growth, High Market Share)
- 4.3.2. Cash Cows (Low Growth, High Market Share)
- 4.3.3. Question Mark (High Growth, Low Market Share)
- 4.3.4. Dogs (Low Growth, Low Market Share)
- 4.4. Ansoff Matrix Analysis
- 4.5. Supply Chain Analysis
- 4.6. Regulatory Landscape
- 4.7. Current Market Potential and Opportunity Assessment (TAM–SAM–SOM Framework)
- 4.8. DMV Analyst Note
- 4.1. Porters Five Forces
- 5. Market Analysis, Insights and Forecast 2021-2033
- 5.1. Market Analysis, Insights and Forecast - by Animal Type
- 5.1.1. Companion Animals
- 5.1.1.1. Dogs
- 5.1.1.2. Cats
- 5.1.1.3. Other Companion Animals
- 5.1.2. Farm Animals
- 5.1.2.1. Cows
- 5.1.2.2. Pigs
- 5.1.2.3. Other Farm Animals
- 5.1.1. Companion Animals
- 5.2. Market Analysis, Insights and Forecast - by Product Type
- 5.2.1. Biomarkers, Kits & Reagents
- 5.2.2. Biomarker Readers
- 5.3. Market Analysis, Insights and Forecast - by Application
- 5.3.1. Disease Diagnostics
- 5.3.2. Preclinical Research
- 5.3.3. Other Applications
- 5.4. Market Analysis, Insights and Forecast - by Disease Type
- 5.4.1. Inflammatory & Infectious Diseases
- 5.4.2. Cardiovascular Diseases
- 5.4.3. Skeletal Muscle Diseases
- 5.4.4. Tumors
- 5.4.5. Other Disease Types
- 5.5. Market Analysis, Insights and Forecast - by Region
- 5.5.1. North America
- 5.5.2. Europe
- 5.5.3. Asia Pacific
- 5.5.4. Middle East and Africa
- 5.5.5. South America
- 5.1. Market Analysis, Insights and Forecast - by Animal Type
- 6. Global Veterinary Biomarker Industry Analysis, Insights and Forecast, 2021-2033
- 6.1. Market Analysis, Insights and Forecast - by Animal Type
- 6.1.1. Companion Animals
- 6.1.1.1. Dogs
- 6.1.1.2. Cats
- 6.1.1.3. Other Companion Animals
- 6.1.2. Farm Animals
- 6.1.2.1. Cows
- 6.1.2.2. Pigs
- 6.1.2.3. Other Farm Animals
- 6.1.1. Companion Animals
- 6.2. Market Analysis, Insights and Forecast - by Product Type
- 6.2.1. Biomarkers, Kits & Reagents
- 6.2.2. Biomarker Readers
- 6.3. Market Analysis, Insights and Forecast - by Application
- 6.3.1. Disease Diagnostics
- 6.3.2. Preclinical Research
- 6.3.3. Other Applications
- 6.4. Market Analysis, Insights and Forecast - by Disease Type
- 6.4.1. Inflammatory & Infectious Diseases
- 6.4.2. Cardiovascular Diseases
- 6.4.3. Skeletal Muscle Diseases
- 6.4.4. Tumors
- 6.4.5. Other Disease Types
- 6.1. Market Analysis, Insights and Forecast - by Animal Type
- 7. North America Veterinary Biomarker Industry Analysis, Insights and Forecast, 2020-2032
- 7.1. Market Analysis, Insights and Forecast - by Animal Type
- 7.1.1. Companion Animals
- 7.1.1.1. Dogs
- 7.1.1.2. Cats
- 7.1.1.3. Other Companion Animals
- 7.1.2. Farm Animals
- 7.1.2.1. Cows
- 7.1.2.2. Pigs
- 7.1.2.3. Other Farm Animals
- 7.1.1. Companion Animals
- 7.2. Market Analysis, Insights and Forecast - by Product Type
- 7.2.1. Biomarkers, Kits & Reagents
- 7.2.2. Biomarker Readers
- 7.3. Market Analysis, Insights and Forecast - by Application
- 7.3.1. Disease Diagnostics
- 7.3.2. Preclinical Research
- 7.3.3. Other Applications
- 7.4. Market Analysis, Insights and Forecast - by Disease Type
- 7.4.1. Inflammatory & Infectious Diseases
- 7.4.2. Cardiovascular Diseases
- 7.4.3. Skeletal Muscle Diseases
- 7.4.4. Tumors
- 7.4.5. Other Disease Types
- 7.1. Market Analysis, Insights and Forecast - by Animal Type
- 8. Europe Veterinary Biomarker Industry Analysis, Insights and Forecast, 2020-2032
- 8.1. Market Analysis, Insights and Forecast - by Animal Type
- 8.1.1. Companion Animals
- 8.1.1.1. Dogs
- 8.1.1.2. Cats
- 8.1.1.3. Other Companion Animals
- 8.1.2. Farm Animals
- 8.1.2.1. Cows
- 8.1.2.2. Pigs
- 8.1.2.3. Other Farm Animals
- 8.1.1. Companion Animals
- 8.2. Market Analysis, Insights and Forecast - by Product Type
- 8.2.1. Biomarkers, Kits & Reagents
- 8.2.2. Biomarker Readers
- 8.3. Market Analysis, Insights and Forecast - by Application
- 8.3.1. Disease Diagnostics
- 8.3.2. Preclinical Research
- 8.3.3. Other Applications
- 8.4. Market Analysis, Insights and Forecast - by Disease Type
- 8.4.1. Inflammatory & Infectious Diseases
- 8.4.2. Cardiovascular Diseases
- 8.4.3. Skeletal Muscle Diseases
- 8.4.4. Tumors
- 8.4.5. Other Disease Types
- 8.1. Market Analysis, Insights and Forecast - by Animal Type
- 9. Asia Pacific Veterinary Biomarker Industry Analysis, Insights and Forecast, 2020-2032
- 9.1. Market Analysis, Insights and Forecast - by Animal Type
- 9.1.1. Companion Animals
- 9.1.1.1. Dogs
- 9.1.1.2. Cats
- 9.1.1.3. Other Companion Animals
- 9.1.2. Farm Animals
- 9.1.2.1. Cows
- 9.1.2.2. Pigs
- 9.1.2.3. Other Farm Animals
- 9.1.1. Companion Animals
- 9.2. Market Analysis, Insights and Forecast - by Product Type
- 9.2.1. Biomarkers, Kits & Reagents
- 9.2.2. Biomarker Readers
- 9.3. Market Analysis, Insights and Forecast - by Application
- 9.3.1. Disease Diagnostics
- 9.3.2. Preclinical Research
- 9.3.3. Other Applications
- 9.4. Market Analysis, Insights and Forecast - by Disease Type
- 9.4.1. Inflammatory & Infectious Diseases
- 9.4.2. Cardiovascular Diseases
- 9.4.3. Skeletal Muscle Diseases
- 9.4.4. Tumors
- 9.4.5. Other Disease Types
- 9.1. Market Analysis, Insights and Forecast - by Animal Type
- 10. Middle East and Africa Veterinary Biomarker Industry Analysis, Insights and Forecast, 2020-2032
- 10.1. Market Analysis, Insights and Forecast - by Animal Type
- 10.1.1. Companion Animals
- 10.1.1.1. Dogs
- 10.1.1.2. Cats
- 10.1.1.3. Other Companion Animals
- 10.1.2. Farm Animals
- 10.1.2.1. Cows
- 10.1.2.2. Pigs
- 10.1.2.3. Other Farm Animals
- 10.1.1. Companion Animals
- 10.2. Market Analysis, Insights and Forecast - by Product Type
- 10.2.1. Biomarkers, Kits & Reagents
- 10.2.2. Biomarker Readers
- 10.3. Market Analysis, Insights and Forecast - by Application
- 10.3.1. Disease Diagnostics
- 10.3.2. Preclinical Research
- 10.3.3. Other Applications
- 10.4. Market Analysis, Insights and Forecast - by Disease Type
- 10.4.1. Inflammatory & Infectious Diseases
- 10.4.2. Cardiovascular Diseases
- 10.4.3. Skeletal Muscle Diseases
- 10.4.4. Tumors
- 10.4.5. Other Disease Types
- 10.1. Market Analysis, Insights and Forecast - by Animal Type
- 11. South America Veterinary Biomarker Industry Analysis, Insights and Forecast, 2020-2032
- 11.1. Market Analysis, Insights and Forecast - by Animal Type
- 11.1.1. Companion Animals
- 11.1.1.1. Dogs
- 11.1.1.2. Cats
- 11.1.1.3. Other Companion Animals
- 11.1.2. Farm Animals
- 11.1.2.1. Cows
- 11.1.2.2. Pigs
- 11.1.2.3. Other Farm Animals
- 11.1.1. Companion Animals
- 11.2. Market Analysis, Insights and Forecast - by Product Type
- 11.2.1. Biomarkers, Kits & Reagents
- 11.2.2. Biomarker Readers
- 11.3. Market Analysis, Insights and Forecast - by Application
- 11.3.1. Disease Diagnostics
- 11.3.2. Preclinical Research
- 11.3.3. Other Applications
- 11.4. Market Analysis, Insights and Forecast - by Disease Type
- 11.4.1. Inflammatory & Infectious Diseases
- 11.4.2. Cardiovascular Diseases
- 11.4.3. Skeletal Muscle Diseases
- 11.4.4. Tumors
- 11.4.5. Other Disease Types
- 11.1. Market Analysis, Insights and Forecast - by Animal Type
- 12. Competitive Analysis
- 12.1. Company Profiles
- 12.1.1 Mercodia AB
- 12.1.1.1. Company Overview
- 12.1.1.2. Products
- 12.1.1.3. Company Financials
- 12.1.1.4. SWOT Analysis
- 12.1.2 Antech Diagnostics Inc
- 12.1.2.1. Company Overview
- 12.1.2.2. Products
- 12.1.2.3. Company Financials
- 12.1.2.4. SWOT Analysis
- 12.1.3 IDEXX Laboratories Inc
- 12.1.3.1. Company Overview
- 12.1.3.2. Products
- 12.1.3.3. Company Financials
- 12.1.3.4. SWOT Analysis
- 12.1.4 Merck & Co Inc
- 12.1.4.1. Company Overview
- 12.1.4.2. Products
- 12.1.4.3. Company Financials
- 12.1.4.4. SWOT Analysis
- 12.1.5 Zoetis
- 12.1.5.1. Company Overview
- 12.1.5.2. Products
- 12.1.5.3. Company Financials
- 12.1.5.4. SWOT Analysis
- 12.1.6 ACUVET BIOTECH
- 12.1.6.1. Company Overview
- 12.1.6.2. Products
- 12.1.6.3. Company Financials
- 12.1.6.4. SWOT Analysis
- 12.1.7 Veterinary Biomarkers Inc
- 12.1.7.1. Company Overview
- 12.1.7.2. Products
- 12.1.7.3. Company Financials
- 12.1.7.4. SWOT Analysis
- 12.1.8 MI
- 12.1.8.1. Company Overview
- 12.1.8.2. Products
- 12.1.8.3. Company Financials
- 12.1.8.4. SWOT Analysis
- 12.1.1 Mercodia AB
- 12.2. Market Entropy
- 12.2.1 Company's Key Areas Served
- 12.2.2 Recent Developments
- 12.3. Company Market Share Analysis 2025
- 12.3.1 Top 5 Companies Market Share Analysis
- 12.3.2 Top 3 Companies Market Share Analysis
- 12.4. List of Potential Customers
- 13. Research Methodology
List of Figures
- Figure 1: Global Veterinary Biomarker Industry Revenue Breakdown (billion, %) by Region 2025 & 2033
- Figure 2: North America Veterinary Biomarker Industry Revenue (billion), by Animal Type 2025 & 2033
- Figure 3: North America Veterinary Biomarker Industry Revenue Share (%), by Animal Type 2025 & 2033
- Figure 4: North America Veterinary Biomarker Industry Revenue (billion), by Product Type 2025 & 2033
- Figure 5: North America Veterinary Biomarker Industry Revenue Share (%), by Product Type 2025 & 2033
- Figure 6: North America Veterinary Biomarker Industry Revenue (billion), by Application 2025 & 2033
- Figure 7: North America Veterinary Biomarker Industry Revenue Share (%), by Application 2025 & 2033
- Figure 8: North America Veterinary Biomarker Industry Revenue (billion), by Disease Type 2025 & 2033
- Figure 9: North America Veterinary Biomarker Industry Revenue Share (%), by Disease Type 2025 & 2033
- Figure 10: North America Veterinary Biomarker Industry Revenue (billion), by Country 2025 & 2033
- Figure 11: North America Veterinary Biomarker Industry Revenue Share (%), by Country 2025 & 2033
- Figure 12: Europe Veterinary Biomarker Industry Revenue (billion), by Animal Type 2025 & 2033
- Figure 13: Europe Veterinary Biomarker Industry Revenue Share (%), by Animal Type 2025 & 2033
- Figure 14: Europe Veterinary Biomarker Industry Revenue (billion), by Product Type 2025 & 2033
- Figure 15: Europe Veterinary Biomarker Industry Revenue Share (%), by Product Type 2025 & 2033
- Figure 16: Europe Veterinary Biomarker Industry Revenue (billion), by Application 2025 & 2033
- Figure 17: Europe Veterinary Biomarker Industry Revenue Share (%), by Application 2025 & 2033
- Figure 18: Europe Veterinary Biomarker Industry Revenue (billion), by Disease Type 2025 & 2033
- Figure 19: Europe Veterinary Biomarker Industry Revenue Share (%), by Disease Type 2025 & 2033
- Figure 20: Europe Veterinary Biomarker Industry Revenue (billion), by Country 2025 & 2033
- Figure 21: Europe Veterinary Biomarker Industry Revenue Share (%), by Country 2025 & 2033
- Figure 22: Asia Pacific Veterinary Biomarker Industry Revenue (billion), by Animal Type 2025 & 2033
- Figure 23: Asia Pacific Veterinary Biomarker Industry Revenue Share (%), by Animal Type 2025 & 2033
- Figure 24: Asia Pacific Veterinary Biomarker Industry Revenue (billion), by Product Type 2025 & 2033
- Figure 25: Asia Pacific Veterinary Biomarker Industry Revenue Share (%), by Product Type 2025 & 2033
- Figure 26: Asia Pacific Veterinary Biomarker Industry Revenue (billion), by Application 2025 & 2033
- Figure 27: Asia Pacific Veterinary Biomarker Industry Revenue Share (%), by Application 2025 & 2033
- Figure 28: Asia Pacific Veterinary Biomarker Industry Revenue (billion), by Disease Type 2025 & 2033
- Figure 29: Asia Pacific Veterinary Biomarker Industry Revenue Share (%), by Disease Type 2025 & 2033
- Figure 30: Asia Pacific Veterinary Biomarker Industry Revenue (billion), by Country 2025 & 2033
- Figure 31: Asia Pacific Veterinary Biomarker Industry Revenue Share (%), by Country 2025 & 2033
- Figure 32: Middle East and Africa Veterinary Biomarker Industry Revenue (billion), by Animal Type 2025 & 2033
- Figure 33: Middle East and Africa Veterinary Biomarker Industry Revenue Share (%), by Animal Type 2025 & 2033
- Figure 34: Middle East and Africa Veterinary Biomarker Industry Revenue (billion), by Product Type 2025 & 2033
- Figure 35: Middle East and Africa Veterinary Biomarker Industry Revenue Share (%), by Product Type 2025 & 2033
- Figure 36: Middle East and Africa Veterinary Biomarker Industry Revenue (billion), by Application 2025 & 2033
- Figure 37: Middle East and Africa Veterinary Biomarker Industry Revenue Share (%), by Application 2025 & 2033
- Figure 38: Middle East and Africa Veterinary Biomarker Industry Revenue (billion), by Disease Type 2025 & 2033
- Figure 39: Middle East and Africa Veterinary Biomarker Industry Revenue Share (%), by Disease Type 2025 & 2033
- Figure 40: Middle East and Africa Veterinary Biomarker Industry Revenue (billion), by Country 2025 & 2033
- Figure 41: Middle East and Africa Veterinary Biomarker Industry Revenue Share (%), by Country 2025 & 2033
- Figure 42: South America Veterinary Biomarker Industry Revenue (billion), by Animal Type 2025 & 2033
- Figure 43: South America Veterinary Biomarker Industry Revenue Share (%), by Animal Type 2025 & 2033
- Figure 44: South America Veterinary Biomarker Industry Revenue (billion), by Product Type 2025 & 2033
- Figure 45: South America Veterinary Biomarker Industry Revenue Share (%), by Product Type 2025 & 2033
- Figure 46: South America Veterinary Biomarker Industry Revenue (billion), by Application 2025 & 2033
- Figure 47: South America Veterinary Biomarker Industry Revenue Share (%), by Application 2025 & 2033
- Figure 48: South America Veterinary Biomarker Industry Revenue (billion), by Disease Type 2025 & 2033
- Figure 49: South America Veterinary Biomarker Industry Revenue Share (%), by Disease Type 2025 & 2033
- Figure 50: South America Veterinary Biomarker Industry Revenue (billion), by Country 2025 & 2033
- Figure 51: South America Veterinary Biomarker Industry Revenue Share (%), by Country 2025 & 2033
List of Tables
- Table 1: Global Veterinary Biomarker Industry Revenue billion Forecast, by Animal Type 2020 & 2033
- Table 2: Global Veterinary Biomarker Industry Revenue billion Forecast, by Product Type 2020 & 2033
- Table 3: Global Veterinary Biomarker Industry Revenue billion Forecast, by Application 2020 & 2033
- Table 4: Global Veterinary Biomarker Industry Revenue billion Forecast, by Disease Type 2020 & 2033
- Table 5: Global Veterinary Biomarker Industry Revenue billion Forecast, by Region 2020 & 2033
- Table 6: Global Veterinary Biomarker Industry Revenue billion Forecast, by Animal Type 2020 & 2033
- Table 7: Global Veterinary Biomarker Industry Revenue billion Forecast, by Product Type 2020 & 2033
- Table 8: Global Veterinary Biomarker Industry Revenue billion Forecast, by Application 2020 & 2033
- Table 9: Global Veterinary Biomarker Industry Revenue billion Forecast, by Disease Type 2020 & 2033
- Table 10: Global Veterinary Biomarker Industry Revenue billion Forecast, by Country 2020 & 2033
- Table 11: United States Veterinary Biomarker Industry Revenue (billion) Forecast, by Application 2020 & 2033
- Table 12: Canada Veterinary Biomarker Industry Revenue (billion) Forecast, by Application 2020 & 2033
- Table 13: Mexico Veterinary Biomarker Industry Revenue (billion) Forecast, by Application 2020 & 2033
- Table 14: Global Veterinary Biomarker Industry Revenue billion Forecast, by Animal Type 2020 & 2033
- Table 15: Global Veterinary Biomarker Industry Revenue billion Forecast, by Product Type 2020 & 2033
- Table 16: Global Veterinary Biomarker Industry Revenue billion Forecast, by Application 2020 & 2033
- Table 17: Global Veterinary Biomarker Industry Revenue billion Forecast, by Disease Type 2020 & 2033
- Table 18: Global Veterinary Biomarker Industry Revenue billion Forecast, by Country 2020 & 2033
- Table 19: Germany Veterinary Biomarker Industry Revenue (billion) Forecast, by Application 2020 & 2033
- Table 20: United Kingdom Veterinary Biomarker Industry Revenue (billion) Forecast, by Application 2020 & 2033
- Table 21: France Veterinary Biomarker Industry Revenue (billion) Forecast, by Application 2020 & 2033
- Table 22: Italy Veterinary Biomarker Industry Revenue (billion) Forecast, by Application 2020 & 2033
- Table 23: Spain Veterinary Biomarker Industry Revenue (billion) Forecast, by Application 2020 & 2033
- Table 24: Rest of Europe Veterinary Biomarker Industry Revenue (billion) Forecast, by Application 2020 & 2033
- Table 25: Global Veterinary Biomarker Industry Revenue billion Forecast, by Animal Type 2020 & 2033
- Table 26: Global Veterinary Biomarker Industry Revenue billion Forecast, by Product Type 2020 & 2033
- Table 27: Global Veterinary Biomarker Industry Revenue billion Forecast, by Application 2020 & 2033
- Table 28: Global Veterinary Biomarker Industry Revenue billion Forecast, by Disease Type 2020 & 2033
- Table 29: Global Veterinary Biomarker Industry Revenue billion Forecast, by Country 2020 & 2033
- Table 30: China Veterinary Biomarker Industry Revenue (billion) Forecast, by Application 2020 & 2033
- Table 31: Japan Veterinary Biomarker Industry Revenue (billion) Forecast, by Application 2020 & 2033
- Table 32: India Veterinary Biomarker Industry Revenue (billion) Forecast, by Application 2020 & 2033
- Table 33: Australia Veterinary Biomarker Industry Revenue (billion) Forecast, by Application 2020 & 2033
- Table 34: South Korea Veterinary Biomarker Industry Revenue (billion) Forecast, by Application 2020 & 2033
- Table 35: Rest of Asia Pacific Veterinary Biomarker Industry Revenue (billion) Forecast, by Application 2020 & 2033
- Table 36: Global Veterinary Biomarker Industry Revenue billion Forecast, by Animal Type 2020 & 2033
- Table 37: Global Veterinary Biomarker Industry Revenue billion Forecast, by Product Type 2020 & 2033
- Table 38: Global Veterinary Biomarker Industry Revenue billion Forecast, by Application 2020 & 2033
- Table 39: Global Veterinary Biomarker Industry Revenue billion Forecast, by Disease Type 2020 & 2033
- Table 40: Global Veterinary Biomarker Industry Revenue billion Forecast, by Country 2020 & 2033
- Table 41: GCC Veterinary Biomarker Industry Revenue (billion) Forecast, by Application 2020 & 2033
- Table 42: South Africa Veterinary Biomarker Industry Revenue (billion) Forecast, by Application 2020 & 2033
- Table 43: Rest of Middle East and Africa Veterinary Biomarker Industry Revenue (billion) Forecast, by Application 2020 & 2033
- Table 44: Global Veterinary Biomarker Industry Revenue billion Forecast, by Animal Type 2020 & 2033
- Table 45: Global Veterinary Biomarker Industry Revenue billion Forecast, by Product Type 2020 & 2033
- Table 46: Global Veterinary Biomarker Industry Revenue billion Forecast, by Application 2020 & 2033
- Table 47: Global Veterinary Biomarker Industry Revenue billion Forecast, by Disease Type 2020 & 2033
- Table 48: Global Veterinary Biomarker Industry Revenue billion Forecast, by Country 2020 & 2033
- Table 49: Brazil Veterinary Biomarker Industry Revenue (billion) Forecast, by Application 2020 & 2033
- Table 50: Argentina Veterinary Biomarker Industry Revenue (billion) Forecast, by Application 2020 & 2033
- Table 51: Rest of South America Veterinary Biomarker Industry Revenue (billion) Forecast, by Application 2020 & 2033
Frequently Asked Questions
1. What is the projected Compound Annual Growth Rate (CAGR) of the Veterinary Biomarker Industry?
The projected CAGR is approximately 8.72%.
2. Which companies are prominent players in the Veterinary Biomarker Industry?
Key companies in the market include Mercodia AB, Antech Diagnostics Inc, IDEXX Laboratories Inc, Merck & Co Inc, Zoetis, ACUVET BIOTECH, Veterinary Biomarkers Inc, MI:RNA Diagnostics Ltd, Avacta Animal Health Limited, Virbac.
3. What are the main segments of the Veterinary Biomarker Industry?
The market segments include Animal Type, Product Type, Application, Disease Type.
4. Can you provide details about the market size?
The market size is estimated to be USD 9.65 billion as of 2022.
5. What are some drivers contributing to market growth?
High Prevalence of Chronic Diseases in Animals; Implementation of Innovative R&D Strategies by Prominent Players; Rising Pet Adoption Rates.
6. What are the notable trends driving market growth?
Biomarkers. Kits & Reagents Segment is Expected to Witness Significant Growth Over the Forecast Period.
7. Are there any restraints impacting market growth?
Expanding Pet Care Costs.
8. Can you provide examples of recent developments in the market?
In October 2022, researchers from Boston University Chobanian & Avedisian School of Medicine received USD 4.6 million grant from the National Institutes of Health for the development and validation of innovative biomarkers for lung cancer.
9. What pricing options are available for accessing the report?
Pricing options include single-user, multi-user, and enterprise licenses priced at USD 4750, USD 5250, and USD 8750 respectively.
10. Is the market size provided in terms of value or volume?
The market size is provided in terms of value, measured in billion.
11. Are there any specific market keywords associated with the report?
Yes, the market keyword associated with the report is "Veterinary Biomarker Industry," which aids in identifying and referencing the specific market segment covered.
12. How do I determine which pricing option suits my needs best?
The pricing options vary based on user requirements and access needs. Individual users may opt for single-user licenses, while businesses requiring broader access may choose multi-user or enterprise licenses for cost-effective access to the report.
13. Are there any additional resources or data provided in the Veterinary Biomarker Industry report?
While the report offers comprehensive insights, it's advisable to review the specific contents or supplementary materials provided to ascertain if additional resources or data are available.
14. How can I stay updated on further developments or reports in the Veterinary Biomarker Industry?
To stay informed about further developments, trends, and reports in the Veterinary Biomarker Industry, consider subscribing to industry newsletters, following relevant companies and organizations, or regularly checking reputable industry news sources and publications.
Methodology
Step 1 - Identification of Relevant Samples Size from Population Database


Step 2 - Approaches for Defining Global Market Size (Value, Volume* & Price*)

Note*: In applicable scenarios
Step 3 - Data Sources
Primary Research
- Web Analytics
- Survey Reports
- Research Institute
- Latest Research Reports
- Opinion Leaders
Secondary Research
- Annual Reports
- White Paper
- Latest Press Release
- Industry Association
- Paid Database
- Investor Presentations

Step 4 - Data Triangulation
Involves using different sources of information in order to increase the validity of a study
These sources are likely to be stakeholders in a program - participants, other researchers, program staff, other community members, and so on.
Then we put all data in single framework & apply various statistical tools to find out the dynamic on the market.
During the analysis stage, feedback from the stakeholder groups would be compared to determine areas of agreement as well as areas of divergence