

Key Insights
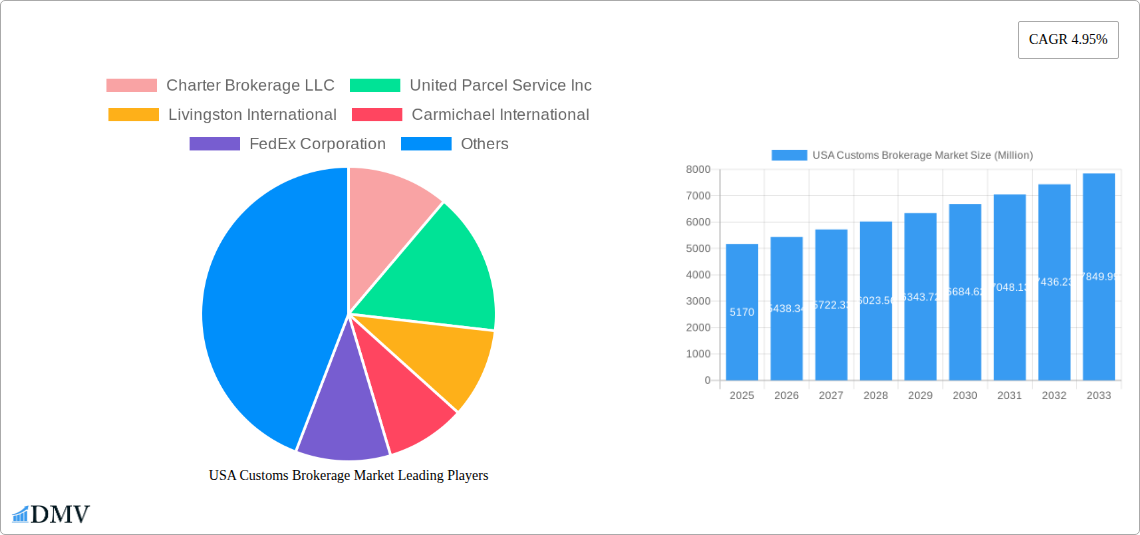
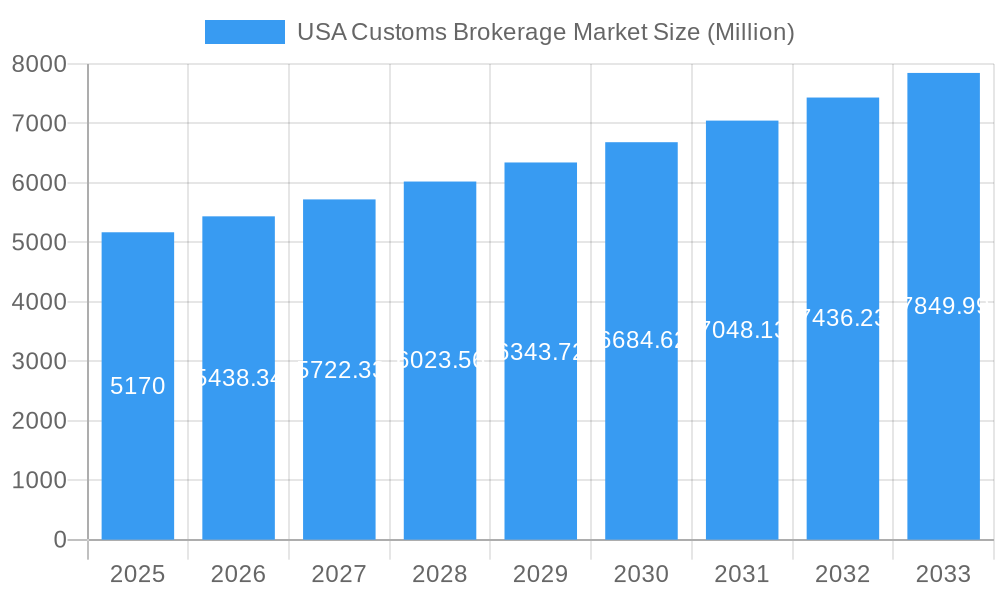
The US Customs Brokerage market, valued at $5.17 billion in 2025, is projected to experience robust growth, driven by a Compound Annual Growth Rate (CAGR) of 4.95% from 2025 to 2033. This expansion is fueled by several key factors. The increasing volume of international trade, particularly e-commerce, necessitates efficient customs clearance processes, boosting demand for brokerage services. Furthermore, stricter regulatory compliance requirements and the complexity of navigating customs procedures encourage businesses to outsource these functions to specialized brokers. The growth is also underpinned by the ongoing expansion of global supply chains, particularly within the North American Free Trade Agreement (NAFTA) region, leading to a greater need for seamless cross-border logistics. Technological advancements such as automation and digital platforms are streamlining operations and improving efficiency, contributing to market expansion. While potential restraints such as economic downturns and fluctuating trade policies exist, the overall market outlook remains positive due to the fundamental need for customs brokerage in international trade.
USA Customs Brokerage Market Market Size (In Billion)
The market is segmented by mode of transport, encompassing sea, air, and cross-border land transport. Sea transport likely holds the largest market share due to the high volume of goods shipped via this mode. Regional analysis reveals a strong presence across the United States, with varying levels of activity in the Northeast, Southeast, Midwest, Southwest, and West regions, reflecting differences in economic activity and port infrastructure. Key players like FedEx, UPS, DHL, and numerous specialized brokerage firms are intensely competitive, driving innovation and service differentiation. The forecast period of 2025-2033 suggests continued growth, driven by factors mentioned above, implying significant opportunities for established players and new entrants alike. The historical period (2019-2024) likely experienced similar growth trends, providing a solid base for the projected future expansion.
USA Customs Brokerage Market Company Market Share
USA Customs Brokerage Market: A Comprehensive Report (2019-2033)
This insightful report provides a detailed analysis of the USA Customs Brokerage Market, offering a comprehensive overview of its current state, future trajectory, and key players. With a study period spanning 2019-2033, a base year of 2025, and a forecast period of 2025-2033, this report is an invaluable resource for stakeholders seeking to understand and capitalize on the opportunities within this dynamic market. The market size is projected to reach xx Million by 2033.
USA Customs Brokerage Market Composition & Trends
This section delves into the intricate composition of the USA Customs Brokerage Market, examining market concentration, innovation, regulatory influences, and competitive dynamics. We analyze the market share distribution among key players, revealing the competitive landscape. The report also explores the impact of mergers and acquisitions (M&A) activities, providing insights into deal values and their influence on market structure. The current market is characterized by a moderately consolidated structure, with several large players commanding significant market share. However, smaller, specialized firms continue to thrive by offering niche services.
- Market Concentration: The top 5 players hold approximately xx% of the market share in 2025, indicating a moderately consolidated market.
- Innovation Catalysts: Technological advancements in automation, AI, and data analytics are driving efficiency and transparency in customs brokerage.
- Regulatory Landscape: Evolving customs regulations and compliance requirements significantly impact market operations and necessitate continuous adaptation.
- Substitute Products: Limited direct substitutes exist; however, the rise of self-service customs platforms presents some indirect competition.
- End-User Profiles: The market caters to a diverse range of industries, including manufacturing, retail, e-commerce, and technology.
- M&A Activities: Recent M&A activity, valued at approximately xx Million in 2024, demonstrates industry consolidation and expansion strategies. Examples include Kuehne+Nagel's acquisition of Farrow (November 2023) and Rock-It Global's acquisition of Dell Will (October 2023).
USA Customs Brokerage Market Industry Evolution
This section provides a detailed analysis of the USA Customs Brokerage Market's evolutionary path, encompassing market growth trajectories, technological advancements, and evolving consumer demands. We analyze historical trends (2019-2024) and project future growth (2025-2033), identifying key drivers shaping the market's evolution. The market experienced a Compound Annual Growth Rate (CAGR) of xx% during the historical period (2019-2024). This growth is projected to continue, albeit at a moderated pace, driven by factors such as increasing global trade, the growth of e-commerce, and the need for efficient and compliant customs processes. The adoption of advanced technologies, such as blockchain and AI-powered platforms, is also accelerating industry evolution, promising increased speed and accuracy in customs clearance. A shift towards greater transparency and automation in customs procedures is also a prominent trend, leading to improved efficiency and compliance.
Leading Regions, Countries, or Segments in USA Customs Brokerage Market
This section focuses on identifying the dominant segment within the USA Customs Brokerage Market based on the mode of transport (Sea, Air, Cross-border Land Transport). While data may vary, the sea freight segment generally accounts for the largest share of the market.
- Key Drivers for Sea Freight Dominance:
- High volume of international seaborne trade into and out of the USA.
- Established infrastructure for handling sea freight.
- Mature and well-developed customs procedures for sea freight.
- Air Freight: The air freight segment is characterized by faster transit times but generally commands higher prices. The growth in e-commerce is driving the demand for air freight, leading to a significant share increase.
- Cross-border Land Transport: This segment faces challenges related to border complexities and security protocols. However, increasing cross-border trade, particularly with Mexico and Canada, fuels growth in this segment.
The dominance of sea freight is attributable to a confluence of factors, including the large volume of international trade conducted via sea, the established infrastructure for sea freight handling in major US ports, and the comparatively well-developed customs procedures for this mode of transport. However, the air freight segment is experiencing rapid growth due to the increasing reliance on air transport for e-commerce shipments and time-sensitive goods.
USA Customs Brokerage Market Product Innovations
The USA Customs Brokerage Market is witnessing a wave of product innovations aimed at improving efficiency, transparency, and compliance. These innovations range from automated customs declaration platforms leveraging AI and machine learning to secure data management solutions that streamline the process. The focus on user-friendly interfaces and real-time tracking capabilities enhances customer experience. Unique selling propositions are often centred around speed, accuracy, and cost savings. Such innovations not only facilitate efficient customs clearance but also contribute to reducing delays and operational costs for clients.
Propelling Factors for USA Customs Brokerage Market Growth
The growth of the USA Customs Brokerage Market is fueled by a confluence of factors. The increasing volume of global trade, particularly the exponential rise of e-commerce, necessitates efficient customs brokerage services. Furthermore, the ongoing technological advancements in automation and data analytics are improving processing speed and accuracy. Stringent regulatory compliance requirements also create a higher demand for specialized brokerage expertise. The expansion of trade routes and the growth of cross-border e-commerce continue to drive market expansion.
Obstacles in the USA Customs Brokerage Market
The USA Customs Brokerage Market navigates a complex landscape of challenges that can impede its growth trajectory. A primary hurdle is the **ever-evolving regulatory environment**. Frequent amendments and intricate interpretations of customs laws and trade policies demand constant vigilance and significant investment in compliance training and technology. This regulatory maze can lead to costly errors and delays, impacting operational efficiency and profitability. Furthermore, **global supply chain volatility**, amplified by geopolitical events, natural disasters, and unexpected demand shifts, introduces unpredictability. These disruptions can lead to extended transit times, increased demurrage charges, and a heightened need for agile and adaptable brokerage solutions. The market is also characterized by **intense competition**. Established global players vie with nimble, specialized firms and emerging tech-driven entrants. This dynamic environment necessitates continuous innovation in service offerings, technology adoption, and cost management to maintain a competitive edge. The inherent risks associated with customs compliance, including potential penalties and reputational damage, further underscore the need for robust risk mitigation strategies. For instance, anticipating the impact of regulatory shifts, we project that evolving trade agreements and digital customs initiatives in 2024 could lead to an estimated $150 Million to $200 Million increase in industry-wide compliance and technology adoption costs, requiring strategic investment in modernization and training.
Future Opportunities in USA Customs Brokerage Market
The USA Customs Brokerage Market is poised for significant expansion, driven by several compelling future opportunities. The relentless growth of **e-commerce, particularly cross-border online retail**, continues to fuel demand for seamless and efficient customs clearance. As consumers increasingly purchase goods from international sellers, the need for brokers who can navigate complex import/export regulations and provide timely delivery is paramount. A transformative opportunity lies in the **digitalization and automation of customs processes**. The adoption of advanced technologies like Artificial Intelligence (AI), Machine Learning (ML), and blockchain offers the potential to dramatically streamline operations, enhance data accuracy, reduce manual errors, and improve overall supply chain visibility and security. These technologies can enable predictive analytics for risk assessment and automate documentation, freeing up human resources for more strategic tasks. Furthermore, the growing complexity of global trade and the increasing demand for specialized products are creating fertile ground for **niche market specialization**. Firms that can offer tailored expertise in specific industries, such as pharmaceuticals, automotive, or high-tech goods, and understand their unique regulatory requirements, will find a distinct advantage. The push for greater sustainability and ethical sourcing also presents opportunities for brokers to offer value-added services related to compliance and documentation in these areas. These evolving market dynamics highlight the potential for innovation and strategic growth within the USA Customs Brokerage sector.
Major Players in the USA Customs Brokerage Market Ecosystem
- Charter Brokerage LLC
- United Parcel Service Inc
- Livingston International
- Carmichael International
- FedEx Corporation
- Deutsche Post DHL group
- Trans American Customhouse Brokers Inc
- GHY International
- Flexport Inc
- Purolator International
- Samuel Shapiro & Company Inc
- Scarbrough International Ltd
- Expeditors International
- A N Deringer
- C H Robinson
- CH Powell Company
- 8 Other Companies (Key Information/Overview) - Specific details on these companies require further research.
Key Developments in USA Customs Brokerage Market Industry
- November 2023: Kuehne+Nagel's acquisition of Farrow, a prominent Canada-based customs broker, significantly bolsters its cross-border capabilities. This strategic move enhances its capacity to facilitate smoother and more integrated trade flows between the USA, Canada, and Mexico, addressing the growing demand for unified North American logistics solutions.
- October 2023: Rock-It Global's acquisition of customs broker Dell Will underscores the increasing demand for specialized customs brokerage services. This acquisition, aimed at expanding Rock-It Global's presence in the motorsports sector, exemplifies the trend of custom-tailored solutions catering to the unique logistical and regulatory needs of specific industries.
- September 2023: A major customs brokerage firm announced a significant investment in AI-powered automated documentation processing, aiming to reduce clearance times by up to 30% and improve accuracy. This development signals the industry's commitment to leveraging technology to overcome efficiency challenges and enhance client service.
- August 2023: The U.S. Customs and Border Protection (CBP) continued its rollout of enhanced ACE (Automated Commercial Environment) functionalities, encouraging greater data standardization and electronic submissions. Brokers are adapting by upgrading their systems to fully leverage these advancements, paving the way for more integrated and transparent trade processes.
Strategic USA Customs Brokerage Market Forecast
The USA Customs Brokerage Market is poised for continued growth, driven by persistent increases in global trade, the rise of e-commerce, and ongoing technological advancements. While regulatory challenges and competitive pressures remain, the market's future prospects are positive. Opportunities lie in leveraging technology to enhance efficiency, specializing in niche markets, and expanding into emerging e-commerce regions. This dynamic market offers considerable potential for both established players and new entrants.
USA Customs Brokerage Market Segmentation
-
1. Mode of Transport
- 1.1. Sea
- 1.2. Air
- 1.3. Cross-border Land Transport
USA Customs Brokerage Market Segmentation By Geography
-
1. North America
- 1.1. United States
- 1.2. Canada
- 1.3. Mexico
-
2. South America
- 2.1. Brazil
- 2.2. Argentina
- 2.3. Rest of South America
-
3. Europe
- 3.1. United Kingdom
- 3.2. Germany
- 3.3. France
- 3.4. Italy
- 3.5. Spain
- 3.6. Russia
- 3.7. Benelux
- 3.8. Nordics
- 3.9. Rest of Europe
-
4. Middle East & Africa
- 4.1. Turkey
- 4.2. Israel
- 4.3. GCC
- 4.4. North Africa
- 4.5. South Africa
- 4.6. Rest of Middle East & Africa
-
5. Asia Pacific
- 5.1. China
- 5.2. India
- 5.3. Japan
- 5.4. South Korea
- 5.5. ASEAN
- 5.6. Oceania
- 5.7. Rest of Asia Pacific
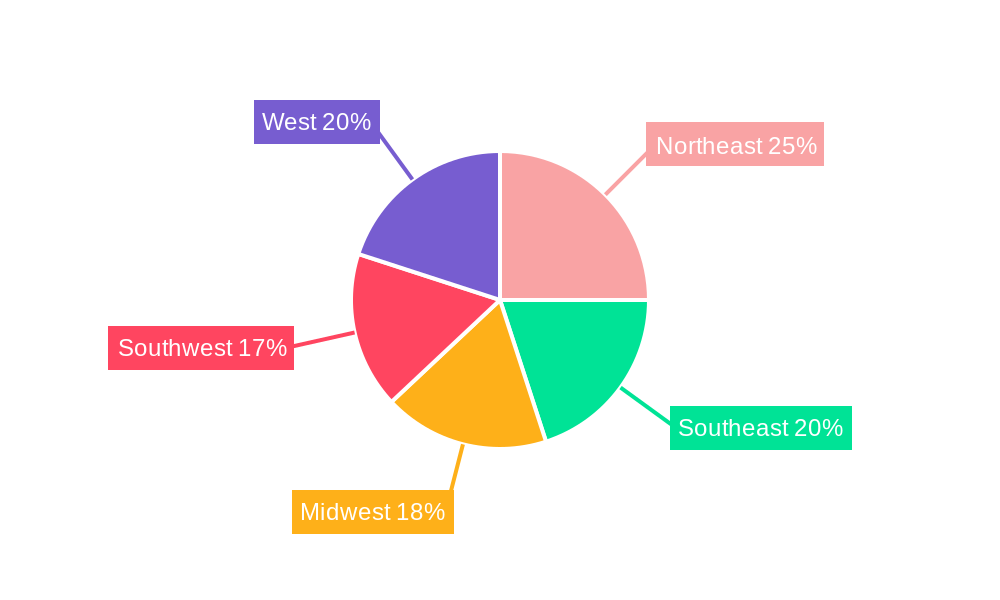
USA Customs Brokerage Market Regional Market Share
Geographic Coverage of USA Customs Brokerage Market
USA Customs Brokerage Market REPORT HIGHLIGHTS
| Aspects | Details |
|---|---|
| Study Period | 2020-2034 |
| Base Year | 2025 |
| Estimated Year | 2026 |
| Forecast Period | 2026-2034 |
| Historical Period | 2020-2025 |
| Growth Rate | CAGR of 4.95% from 2020-2034 |
| Segmentation |
|
Table of Contents
- 1. Introduction
- 1.1. Research Scope
- 1.2. Market Segmentation
- 1.3. Research Objective
- 1.4. Definitions and Assumptions
- 2. Executive Summary
- 2.1. Market Snapshot
- 3. Market Dynamics
- 3.1. Market Drivers
- 3.2. Market Restrains
- 3.3. Market Trends
- 3.4. Market Opportunities
- 4. Market Factor Analysis
- 4.1. Porters Five Forces
- 4.1.1. Bargaining Power of Suppliers
- 4.1.2. Bargaining Power of Buyers
- 4.1.3. Threat of New Entrants
- 4.1.4. Threat of Substitutes
- 4.1.5. Competitive Rivalry
- 4.2. PESTEL analysis
- 4.3. BCG Analysis
- 4.3.1. Stars (High Growth, High Market Share)
- 4.3.2. Cash Cows (Low Growth, High Market Share)
- 4.3.3. Question Mark (High Growth, Low Market Share)
- 4.3.4. Dogs (Low Growth, Low Market Share)
- 4.4. Ansoff Matrix Analysis
- 4.5. Supply Chain Analysis
- 4.6. Regulatory Landscape
- 4.7. Current Market Potential and Opportunity Assessment (TAM–SAM–SOM Framework)
- 4.8. DMV Analyst Note
- 4.1. Porters Five Forces
- 5. Market Analysis, Insights and Forecast 2021-2033
- 5.1. Market Analysis, Insights and Forecast - by Mode of Transport
- 5.1.1. Sea
- 5.1.2. Air
- 5.1.3. Cross-border Land Transport
- 5.2. Market Analysis, Insights and Forecast - by Region
- 5.2.1. North America
- 5.2.2. South America
- 5.2.3. Europe
- 5.2.4. Middle East & Africa
- 5.2.5. Asia Pacific
- 5.1. Market Analysis, Insights and Forecast - by Mode of Transport
- 6. Global USA Customs Brokerage Market Analysis, Insights and Forecast, 2021-2033
- 6.1. Market Analysis, Insights and Forecast - by Mode of Transport
- 6.1.1. Sea
- 6.1.2. Air
- 6.1.3. Cross-border Land Transport
- 6.1. Market Analysis, Insights and Forecast - by Mode of Transport
- 7. North America USA Customs Brokerage Market Analysis, Insights and Forecast, 2020-2032
- 7.1. Market Analysis, Insights and Forecast - by Mode of Transport
- 7.1.1. Sea
- 7.1.2. Air
- 7.1.3. Cross-border Land Transport
- 7.1. Market Analysis, Insights and Forecast - by Mode of Transport
- 8. South America USA Customs Brokerage Market Analysis, Insights and Forecast, 2020-2032
- 8.1. Market Analysis, Insights and Forecast - by Mode of Transport
- 8.1.1. Sea
- 8.1.2. Air
- 8.1.3. Cross-border Land Transport
- 8.1. Market Analysis, Insights and Forecast - by Mode of Transport
- 9. Europe USA Customs Brokerage Market Analysis, Insights and Forecast, 2020-2032
- 9.1. Market Analysis, Insights and Forecast - by Mode of Transport
- 9.1.1. Sea
- 9.1.2. Air
- 9.1.3. Cross-border Land Transport
- 9.1. Market Analysis, Insights and Forecast - by Mode of Transport
- 10. Middle East & Africa USA Customs Brokerage Market Analysis, Insights and Forecast, 2020-2032
- 10.1. Market Analysis, Insights and Forecast - by Mode of Transport
- 10.1.1. Sea
- 10.1.2. Air
- 10.1.3. Cross-border Land Transport
- 10.1. Market Analysis, Insights and Forecast - by Mode of Transport
- 11. Asia Pacific USA Customs Brokerage Market Analysis, Insights and Forecast, 2020-2032
- 11.1. Market Analysis, Insights and Forecast - by Mode of Transport
- 11.1.1. Sea
- 11.1.2. Air
- 11.1.3. Cross-border Land Transport
- 11.1. Market Analysis, Insights and Forecast - by Mode of Transport
- 12. Competitive Analysis
- 12.1. Company Profiles
- 12.1.1 Charter Brokerage LLC
- 12.1.1.1. Company Overview
- 12.1.1.2. Products
- 12.1.1.3. Company Financials
- 12.1.1.4. SWOT Analysis
- 12.1.2 United Parcel Service Inc
- 12.1.2.1. Company Overview
- 12.1.2.2. Products
- 12.1.2.3. Company Financials
- 12.1.2.4. SWOT Analysis
- 12.1.3 Livingston International
- 12.1.3.1. Company Overview
- 12.1.3.2. Products
- 12.1.3.3. Company Financials
- 12.1.3.4. SWOT Analysis
- 12.1.4 Carmichael International
- 12.1.4.1. Company Overview
- 12.1.4.2. Products
- 12.1.4.3. Company Financials
- 12.1.4.4. SWOT Analysis
- 12.1.5 FedEx Corporation
- 12.1.5.1. Company Overview
- 12.1.5.2. Products
- 12.1.5.3. Company Financials
- 12.1.5.4. SWOT Analysis
- 12.1.6 Deutsche Post DHL group
- 12.1.6.1. Company Overview
- 12.1.6.2. Products
- 12.1.6.3. Company Financials
- 12.1.6.4. SWOT Analysis
- 12.1.7 Trans American Customhouse Brokers Inc GHY International Flexport Inc Purolator International Samuel Shapiro & Company Inc Scarbrough International Ltd
- 12.1.7.1. Company Overview
- 12.1.7.2. Products
- 12.1.7.3. Company Financials
- 12.1.7.4. SWOT Analysis
- 12.1.8 Expeditors International
- 12.1.8.1. Company Overview
- 12.1.8.2. Products
- 12.1.8.3. Company Financials
- 12.1.8.4. SWOT Analysis
- 12.1.9 A N Deringer
- 12.1.9.1. Company Overview
- 12.1.9.2. Products
- 12.1.9.3. Company Financials
- 12.1.9.4. SWOT Analysis
- 12.1.10 C H Robinson
- 12.1.10.1. Company Overview
- 12.1.10.2. Products
- 12.1.10.3. Company Financials
- 12.1.10.4. SWOT Analysis
- 12.1.11 CH Powell Company**List Not Exhaustive 8 3 Other Companies (Key Information/Overview)
- 12.1.11.1. Company Overview
- 12.1.11.2. Products
- 12.1.11.3. Company Financials
- 12.1.11.4. SWOT Analysis
- 12.1.1 Charter Brokerage LLC
- 12.2. Market Entropy
- 12.2.1 Company's Key Areas Served
- 12.2.2 Recent Developments
- 12.3. Company Market Share Analysis 2025
- 12.3.1 Top 5 Companies Market Share Analysis
- 12.3.2 Top 3 Companies Market Share Analysis
- 12.4. List of Potential Customers
- 13. Research Methodology
List of Figures
- Figure 1: Global USA Customs Brokerage Market Revenue Breakdown (Million, %) by Region 2025 & 2033
- Figure 2: North America USA Customs Brokerage Market Revenue (Million), by Mode of Transport 2025 & 2033
- Figure 3: North America USA Customs Brokerage Market Revenue Share (%), by Mode of Transport 2025 & 2033
- Figure 4: North America USA Customs Brokerage Market Revenue (Million), by Country 2025 & 2033
- Figure 5: North America USA Customs Brokerage Market Revenue Share (%), by Country 2025 & 2033
- Figure 6: South America USA Customs Brokerage Market Revenue (Million), by Mode of Transport 2025 & 2033
- Figure 7: South America USA Customs Brokerage Market Revenue Share (%), by Mode of Transport 2025 & 2033
- Figure 8: South America USA Customs Brokerage Market Revenue (Million), by Country 2025 & 2033
- Figure 9: South America USA Customs Brokerage Market Revenue Share (%), by Country 2025 & 2033
- Figure 10: Europe USA Customs Brokerage Market Revenue (Million), by Mode of Transport 2025 & 2033
- Figure 11: Europe USA Customs Brokerage Market Revenue Share (%), by Mode of Transport 2025 & 2033
- Figure 12: Europe USA Customs Brokerage Market Revenue (Million), by Country 2025 & 2033
- Figure 13: Europe USA Customs Brokerage Market Revenue Share (%), by Country 2025 & 2033
- Figure 14: Middle East & Africa USA Customs Brokerage Market Revenue (Million), by Mode of Transport 2025 & 2033
- Figure 15: Middle East & Africa USA Customs Brokerage Market Revenue Share (%), by Mode of Transport 2025 & 2033
- Figure 16: Middle East & Africa USA Customs Brokerage Market Revenue (Million), by Country 2025 & 2033
- Figure 17: Middle East & Africa USA Customs Brokerage Market Revenue Share (%), by Country 2025 & 2033
- Figure 18: Asia Pacific USA Customs Brokerage Market Revenue (Million), by Mode of Transport 2025 & 2033
- Figure 19: Asia Pacific USA Customs Brokerage Market Revenue Share (%), by Mode of Transport 2025 & 2033
- Figure 20: Asia Pacific USA Customs Brokerage Market Revenue (Million), by Country 2025 & 2033
- Figure 21: Asia Pacific USA Customs Brokerage Market Revenue Share (%), by Country 2025 & 2033
List of Tables
- Table 1: Global USA Customs Brokerage Market Revenue Million Forecast, by Mode of Transport 2020 & 2033
- Table 2: Global USA Customs Brokerage Market Revenue Million Forecast, by Region 2020 & 2033
- Table 3: Global USA Customs Brokerage Market Revenue Million Forecast, by Mode of Transport 2020 & 2033
- Table 4: Global USA Customs Brokerage Market Revenue Million Forecast, by Country 2020 & 2033
- Table 5: United States USA Customs Brokerage Market Revenue (Million) Forecast, by Application 2020 & 2033
- Table 6: Canada USA Customs Brokerage Market Revenue (Million) Forecast, by Application 2020 & 2033
- Table 7: Mexico USA Customs Brokerage Market Revenue (Million) Forecast, by Application 2020 & 2033
- Table 8: Global USA Customs Brokerage Market Revenue Million Forecast, by Mode of Transport 2020 & 2033
- Table 9: Global USA Customs Brokerage Market Revenue Million Forecast, by Country 2020 & 2033
- Table 10: Brazil USA Customs Brokerage Market Revenue (Million) Forecast, by Application 2020 & 2033
- Table 11: Argentina USA Customs Brokerage Market Revenue (Million) Forecast, by Application 2020 & 2033
- Table 12: Rest of South America USA Customs Brokerage Market Revenue (Million) Forecast, by Application 2020 & 2033
- Table 13: Global USA Customs Brokerage Market Revenue Million Forecast, by Mode of Transport 2020 & 2033
- Table 14: Global USA Customs Brokerage Market Revenue Million Forecast, by Country 2020 & 2033
- Table 15: United Kingdom USA Customs Brokerage Market Revenue (Million) Forecast, by Application 2020 & 2033
- Table 16: Germany USA Customs Brokerage Market Revenue (Million) Forecast, by Application 2020 & 2033
- Table 17: France USA Customs Brokerage Market Revenue (Million) Forecast, by Application 2020 & 2033
- Table 18: Italy USA Customs Brokerage Market Revenue (Million) Forecast, by Application 2020 & 2033
- Table 19: Spain USA Customs Brokerage Market Revenue (Million) Forecast, by Application 2020 & 2033
- Table 20: Russia USA Customs Brokerage Market Revenue (Million) Forecast, by Application 2020 & 2033
- Table 21: Benelux USA Customs Brokerage Market Revenue (Million) Forecast, by Application 2020 & 2033
- Table 22: Nordics USA Customs Brokerage Market Revenue (Million) Forecast, by Application 2020 & 2033
- Table 23: Rest of Europe USA Customs Brokerage Market Revenue (Million) Forecast, by Application 2020 & 2033
- Table 24: Global USA Customs Brokerage Market Revenue Million Forecast, by Mode of Transport 2020 & 2033
- Table 25: Global USA Customs Brokerage Market Revenue Million Forecast, by Country 2020 & 2033
- Table 26: Turkey USA Customs Brokerage Market Revenue (Million) Forecast, by Application 2020 & 2033
- Table 27: Israel USA Customs Brokerage Market Revenue (Million) Forecast, by Application 2020 & 2033
- Table 28: GCC USA Customs Brokerage Market Revenue (Million) Forecast, by Application 2020 & 2033
- Table 29: North Africa USA Customs Brokerage Market Revenue (Million) Forecast, by Application 2020 & 2033
- Table 30: South Africa USA Customs Brokerage Market Revenue (Million) Forecast, by Application 2020 & 2033
- Table 31: Rest of Middle East & Africa USA Customs Brokerage Market Revenue (Million) Forecast, by Application 2020 & 2033
- Table 32: Global USA Customs Brokerage Market Revenue Million Forecast, by Mode of Transport 2020 & 2033
- Table 33: Global USA Customs Brokerage Market Revenue Million Forecast, by Country 2020 & 2033
- Table 34: China USA Customs Brokerage Market Revenue (Million) Forecast, by Application 2020 & 2033
- Table 35: India USA Customs Brokerage Market Revenue (Million) Forecast, by Application 2020 & 2033
- Table 36: Japan USA Customs Brokerage Market Revenue (Million) Forecast, by Application 2020 & 2033
- Table 37: South Korea USA Customs Brokerage Market Revenue (Million) Forecast, by Application 2020 & 2033
- Table 38: ASEAN USA Customs Brokerage Market Revenue (Million) Forecast, by Application 2020 & 2033
- Table 39: Oceania USA Customs Brokerage Market Revenue (Million) Forecast, by Application 2020 & 2033
- Table 40: Rest of Asia Pacific USA Customs Brokerage Market Revenue (Million) Forecast, by Application 2020 & 2033
Frequently Asked Questions
1. What is the projected Compound Annual Growth Rate (CAGR) of the USA Customs Brokerage Market?
The projected CAGR is approximately 4.95%.
2. Which companies are prominent players in the USA Customs Brokerage Market?
Key companies in the market include Charter Brokerage LLC, United Parcel Service Inc, Livingston International, Carmichael International, FedEx Corporation, Deutsche Post DHL group, Trans American Customhouse Brokers Inc GHY International Flexport Inc Purolator International Samuel Shapiro & Company Inc Scarbrough International Ltd, Expeditors International, A N Deringer, C H Robinson, CH Powell Company**List Not Exhaustive 8 3 Other Companies (Key Information/Overview).
3. What are the main segments of the USA Customs Brokerage Market?
The market segments include Mode of Transport.
4. Can you provide details about the market size?
The market size is estimated to be USD 5.17 Million as of 2022.
5. What are some drivers contributing to market growth?
Increasing international trade; Advancements in technology.
6. What are the notable trends driving market growth?
Growth in Imports Driving the US Customs Brokerage Market.
7. Are there any restraints impacting market growth?
Geopolitical uncertainities; Changing trade policies.
8. Can you provide examples of recent developments in the market?
November 2023: Kuehne+Nagel completed the acquisition of Farrow, a Canada-based customs broker. This strategic move enhances cross-border capabilities at the US borders with Canada and Mexico.
9. What pricing options are available for accessing the report?
Pricing options include single-user, multi-user, and enterprise licenses priced at USD 3800, USD 4500, and USD 5800 respectively.
10. Is the market size provided in terms of value or volume?
The market size is provided in terms of value, measured in Million.
11. Are there any specific market keywords associated with the report?
Yes, the market keyword associated with the report is "USA Customs Brokerage Market," which aids in identifying and referencing the specific market segment covered.
12. How do I determine which pricing option suits my needs best?
The pricing options vary based on user requirements and access needs. Individual users may opt for single-user licenses, while businesses requiring broader access may choose multi-user or enterprise licenses for cost-effective access to the report.
13. Are there any additional resources or data provided in the USA Customs Brokerage Market report?
While the report offers comprehensive insights, it's advisable to review the specific contents or supplementary materials provided to ascertain if additional resources or data are available.
14. How can I stay updated on further developments or reports in the USA Customs Brokerage Market?
To stay informed about further developments, trends, and reports in the USA Customs Brokerage Market, consider subscribing to industry newsletters, following relevant companies and organizations, or regularly checking reputable industry news sources and publications.
Methodology
Step 1 - Identification of Relevant Samples Size from Population Database


Step 2 - Approaches for Defining Global Market Size (Value, Volume* & Price*)

Note*: In applicable scenarios
Step 3 - Data Sources
Primary Research
- Web Analytics
- Survey Reports
- Research Institute
- Latest Research Reports
- Opinion Leaders
Secondary Research
- Annual Reports
- White Paper
- Latest Press Release
- Industry Association
- Paid Database
- Investor Presentations

Step 4 - Data Triangulation
Involves using different sources of information in order to increase the validity of a study
These sources are likely to be stakeholders in a program - participants, other researchers, program staff, other community members, and so on.
Then we put all data in single framework & apply various statistical tools to find out the dynamic on the market.
During the analysis stage, feedback from the stakeholder groups would be compared to determine areas of agreement as well as areas of divergence