

Key Insights
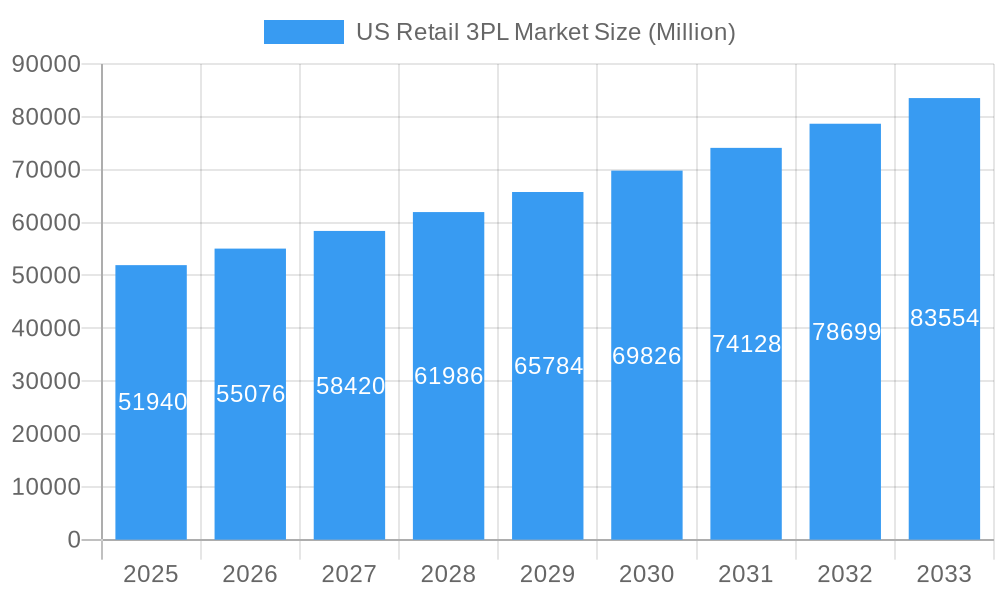
The US retail 3PL (Third-Party Logistics) market, valued at $51.94 billion in 2025, is projected to experience robust growth, driven by the increasing e-commerce penetration and the rising demand for efficient supply chain management. A Compound Annual Growth Rate (CAGR) of 6.00% from 2025 to 2033 indicates a significant expansion of this market. Key growth drivers include the escalating need for retailers to optimize their logistics operations, reduce costs, and enhance delivery speed to meet consumer expectations. The burgeoning demand for omnichannel fulfillment, incorporating both online and offline sales channels, is further fueling the market's expansion. Segmentation reveals significant opportunities within various product categories, with food and beverages, personal and household care, and apparel showing strong growth potential. The distribution channel landscape is also diversifying, with online channels experiencing significant growth alongside traditional channels such as supermarkets/hypermarkets, and convenience stores. While challenges such as fluctuating fuel prices and labor shortages exist, the overall market outlook remains positive, driven by technological advancements such as automation and the adoption of advanced analytics for improved supply chain visibility and efficiency. The presence of major players like J.B. Hunt, DHL Supply Chain, and UPS Supply Chain Solutions underscores the market's maturity and competitiveness, indicating a landscape ripe for further expansion and innovation.
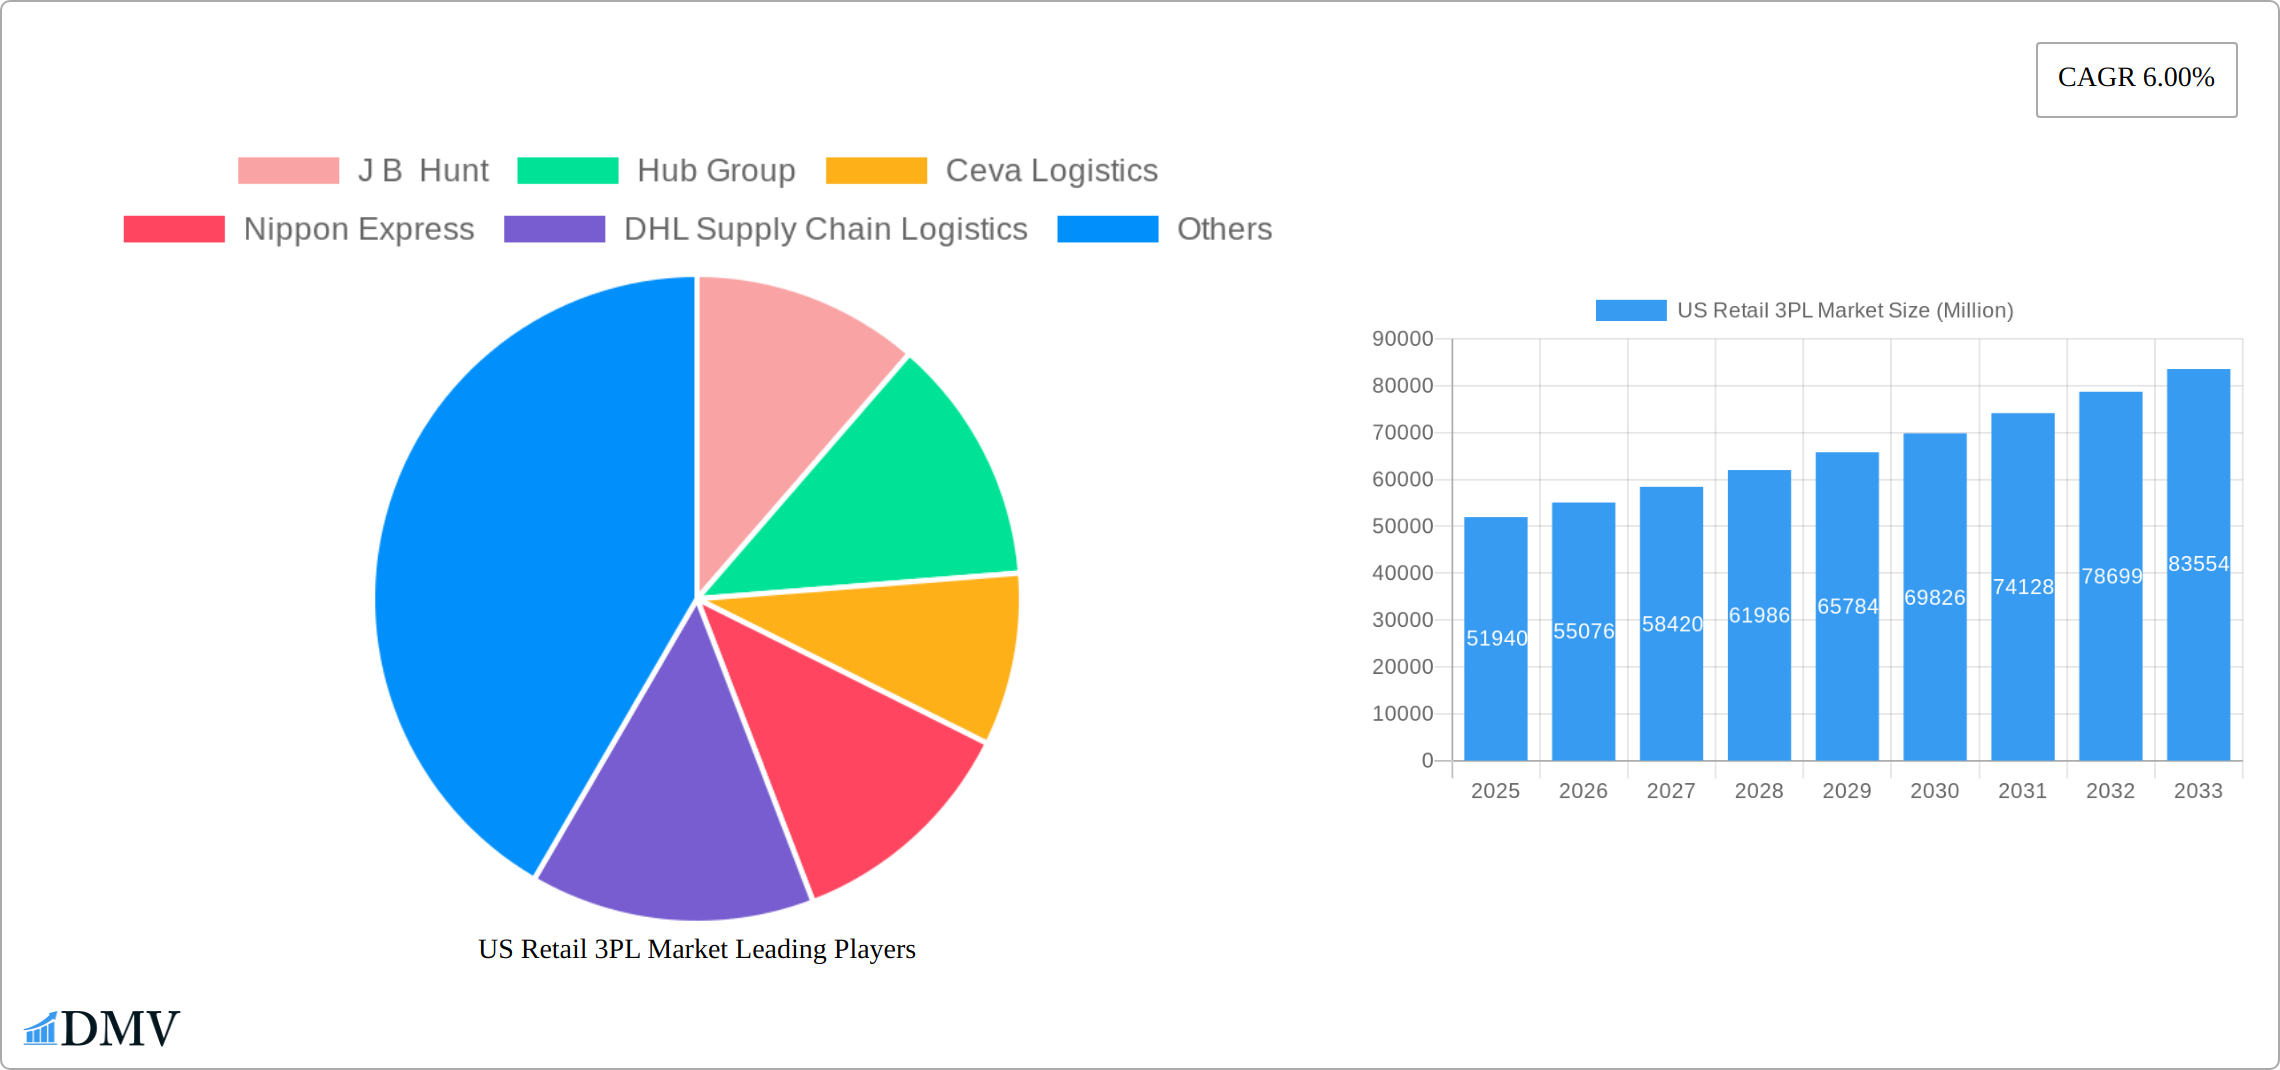
US Retail 3PL Market Market Size (In Billion)
The regional breakdown within the US reveals opportunities across all regions – Northeast, Southeast, Midwest, Southwest, and West – although specific regional growth rates may vary due to factors such as population density, infrastructure, and economic conditions. Competition is fierce amongst established 3PL providers, necessitating continuous innovation and strategic partnerships to maintain a competitive edge. Future market trends will likely focus on sustainable logistics practices, the integration of artificial intelligence (AI) and machine learning (ML) for improved forecasting and route optimization, and a heightened focus on last-mile delivery solutions to address the demands of increasingly impatient consumers. The increasing importance of data analytics to improve decision-making and enhance operational efficiency will also significantly shape the market. This market's growth trajectory strongly suggests substantial opportunities for both existing players and new entrants.
US Retail 3PL Market Company Market Share
US Retail 3PL Market Market Composition & Trends
The US Retail 3PL Market exhibits a dynamic landscape characterized by a blend of high market concentration and burgeoning innovation. Market concentration is predominantly driven by a few leading players such as J B Hunt, DHL Supply Chain, and C H Robinson, which together hold approximately 40% of the market share. This concentration fuels intense competition, spurring innovation as companies strive to differentiate their services. Regulatory landscapes play a pivotal role, with recent updates to transportation and logistics regulations shaping operational strategies. The market also sees the emergence of substitute products like automated warehousing solutions, which challenge traditional 3PL services.
End-user profiles vary widely, from large supermarkets to niche online retailers, each demanding tailored logistics solutions. M&A activities have surged, with notable deals like Knight-Swift's acquisition of U.S. Xpress for 800 Million in July 2023, reflecting a strategy to expand service offerings and geographical reach. Other significant M&A transactions include DSV's acquisitions totaling 350 Million in March 2023. These activities not only consolidate the market but also introduce new technologies and capabilities, fostering a more robust and efficient 3PL ecosystem.
- Market Share Distribution: Top 3 players hold 40% of the market.
- M&A Deal Values: Knight-Swift acquired U.S. Xpress for 800 Million; DSV's acquisitions totaled 350 Million.
- Regulatory Impact: Recent updates to logistics regulations influencing operational strategies.
- Substitute Products: Automated warehousing solutions challenging traditional 3PL services.
US Retail 3PL Market Industry Evolution
The US Retail 3PL Market has undergone significant evolution over the study period of 2019-2033, driven by market growth trajectories, technological advancements, and shifting consumer demands. The market has seen a compound annual growth rate (CAGR) of 5.2% from 2019 to 2024, with projections to reach a CAGR of 6.1% during the forecast period of 2025-2033. This growth is fueled by the increasing demand for efficient and cost-effective logistics solutions across various distribution channels, including supermarkets, convenience stores, and online platforms.
Technological advancements, such as the integration of IoT and AI in logistics operations, have revolutionized the industry. For instance, the adoption of real-time tracking systems has increased by 30% since 2020, enhancing transparency and efficiency in supply chains. Additionally, the rise of e-commerce has shifted consumer demands towards faster and more flexible delivery options, prompting 3PL providers to innovate their service models. The market has also witnessed a surge in demand for specialized logistics solutions, particularly in the food and beverages segment, which grew by 7% annually over the last five years.
The evolution of the US Retail 3PL Market is further characterized by the expansion of service portfolios to include value-added services like reverse logistics and last-mile delivery. These services have become critical as retailers seek to enhance customer satisfaction and streamline operations. The market's adaptability to these changing dynamics underscores its resilience and potential for sustained growth in the coming years.
Leading Regions, Countries, or Segments in US Retail 3PL Market
The US Retail 3PL Market exhibits varying degrees of dominance across different regions, countries, and segments. The online distribution channel has emerged as a leading segment, driven by the exponential growth of e-commerce, which saw a 15% increase in logistics demand in 2023. This segment benefits from significant investments in technology and infrastructure to meet the rising demand for fast and reliable delivery services.
- Key Drivers for Online Distribution Channel:
- Investment in technology and infrastructure.
- Rising consumer demand for fast and reliable delivery.
- Regulatory support for e-commerce logistics.
In terms of product segments, the food and beverages category leads with a market share of 25%, attributed to the need for specialized logistics solutions to handle perishable goods. This segment has seen a growth rate of 7% annually, driven by consumer demand for fresh and timely deliveries.
- Key Drivers for Food and Beverages Segment:
- Need for specialized logistics for perishable goods.
- Growing consumer demand for fresh deliveries.
- Regulatory compliance in food handling and transportation.
The dominance of these segments is further reinforced by their ability to adapt to consumer trends and technological advancements. For instance, the online channel's success is closely tied to the integration of advanced logistics solutions like drone deliveries and automated sorting systems, which enhance efficiency and customer satisfaction. Similarly, the food and beverages segment benefits from innovations in temperature-controlled logistics and real-time tracking, ensuring product quality and safety.
US Retail 3PL Market Product Innovations
The US retail 3PL market is experiencing a surge in innovative product offerings designed to boost efficiency and customer satisfaction. These advancements are revolutionizing the industry, impacting everything from delivery times to supply chain security. For example, AI-powered route optimization is reducing delivery times by up to 20%, while blockchain technology is ensuring transparent and secure supply chain management, fostering trust and accountability. Furthermore, the Internet of Things (IoT) is enabling sophisticated inventory management and predictive maintenance, minimizing downtime and optimizing resource allocation. This proactive approach to technology integration is not just improving operational efficiency but also creating unique selling propositions, such as real-time shipment tracking and enhanced data security, which are highly valued by both businesses and consumers.
Propelling Factors for US Retail 3PL Market Growth
Several interconnected factors are fueling the robust growth of the US retail 3PL market. Technological advancements, particularly the integration of AI and IoT, are streamlining logistics operations, resulting in significant cost reductions. The aforementioned 20% reduction in delivery times via AI-driven route optimization is a prime example of this efficiency boost. Economically, the explosive growth of e-commerce and the critical need for seamless last-mile delivery solutions are driving unprecedented demand for 3PL services. Finally, supportive regulatory influences, such as the FAST Act's focus on improving freight transportation, are bolstering market growth by fostering infrastructure development and operational enhancements. This combination of technological innovation, economic demand, and regulatory support creates a powerful engine for continued market expansion.
Obstacles in the US Retail 3PL Market Market
The US Retail 3PL Market faces several obstacles that could impede its growth. Regulatory challenges, such as compliance with environmental regulations, increase operational costs by an estimated 5%. Supply chain disruptions, exacerbated by global events like pandemics, can lead to delays and increased costs, impacting service quality. Competitive pressures from emerging logistics providers offering lower-cost services also pose a threat, with new entrants capturing up to 10% of the market share in some regions.
Future Opportunities in US Retail 3PL Market
The future of the US retail 3PL market is brimming with exciting opportunities. Expansion into new markets, such as Latin America, driven by increased cross-border trade, presents significant growth potential. Technological advancements continue to shape the industry, with the emergence of drone technology for last-mile delivery offering the promise of faster, more cost-effective solutions. Finally, the growing consumer demand for sustainable and environmentally friendly practices presents a unique opportunity for 3PL providers to differentiate themselves by offering innovative green logistics solutions, capitalizing on the increasing environmental consciousness of both businesses and consumers.
Major Players in the US Retail 3PL Market Ecosystem
Key Developments in US Retail 3PL Market Industry
- July 2023: Knight-Swift Transportation Holdings Inc. completed its acquisition of U.S. Xpress for $800 million, following shareholder approval. This significant merger resulted in the delisting of U.S. Xpress from the New York Stock Exchange and solidified Knight-Swift's position as a major player in the market, significantly expanding its service offerings and operational capacity.
- March 2023: DSV significantly strengthened its North American presence with the acquisition of S&M Moving Systems West and Global Diversity Logistics for a combined total of $350 million. This strategic move bolsters DSV's capabilities, particularly in cross-border services into Latin America, highlighting the growing importance of this region in the global logistics landscape.
Strategic US Retail 3PL Market Market Forecast
The strategic forecast for the US Retail 3PL Market indicates robust growth driven by technological advancements, economic factors, and regulatory support. The market is poised to capitalize on emerging opportunities in new regions and the adoption of innovative logistics solutions. With a projected CAGR of 6.1% during the forecast period of 2025-2033, the market's potential lies in its ability to adapt to changing consumer demands and leverage technological innovations for enhanced service delivery and operational efficiency.
US Retail 3PL Market Segmentation
-
1. Product
- 1.1. Food and Beverages
- 1.2. Personal and Household Care
- 1.3. Apparel, Footwear, and Accessories
- 1.4. Furniture, Toys, and Hobby
- 1.5. Electronic and Household Appliances
- 1.6. Other Products
-
2. Distribution Channel
- 2.1. Supermar
- 2.2. Specialty Stores
- 2.3. Online
- 2.4. Other Distribution Channels
US Retail 3PL Market Segmentation By Geography
-
1. North America
- 1.1. United States
- 1.2. Canada
- 1.3. Mexico
-
2. South America
- 2.1. Brazil
- 2.2. Argentina
- 2.3. Rest of South America
-
3. Europe
- 3.1. United Kingdom
- 3.2. Germany
- 3.3. France
- 3.4. Italy
- 3.5. Spain
- 3.6. Russia
- 3.7. Benelux
- 3.8. Nordics
- 3.9. Rest of Europe
-
4. Middle East & Africa
- 4.1. Turkey
- 4.2. Israel
- 4.3. GCC
- 4.4. North Africa
- 4.5. South Africa
- 4.6. Rest of Middle East & Africa
-
5. Asia Pacific
- 5.1. China
- 5.2. India
- 5.3. Japan
- 5.4. South Korea
- 5.5. ASEAN
- 5.6. Oceania
- 5.7. Rest of Asia Pacific
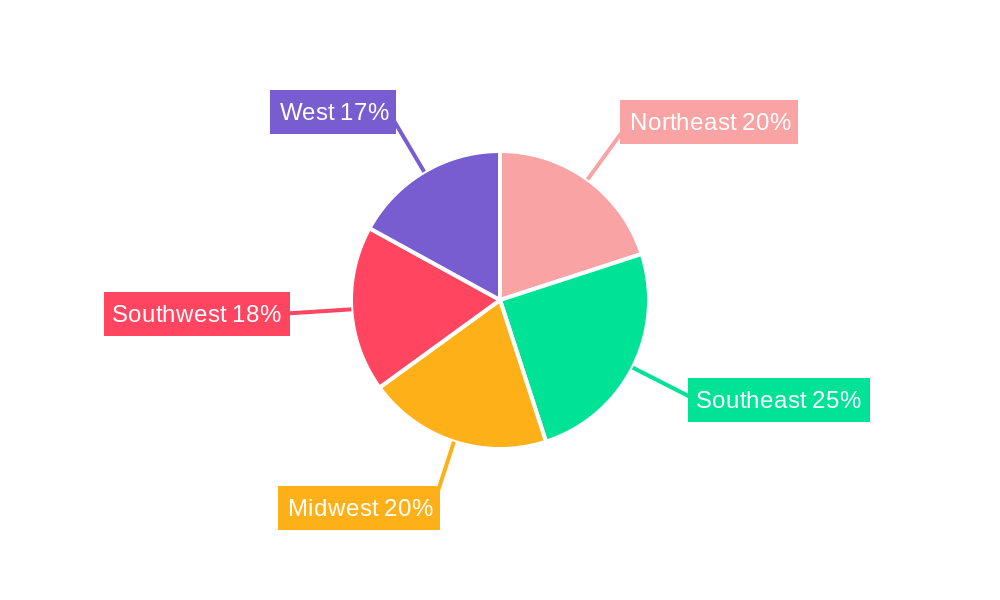
US Retail 3PL Market Regional Market Share
Geographic Coverage of US Retail 3PL Market
US Retail 3PL Market REPORT HIGHLIGHTS
| Aspects | Details |
|---|---|
| Study Period | 2020-2034 |
| Base Year | 2025 |
| Estimated Year | 2026 |
| Forecast Period | 2026-2034 |
| Historical Period | 2020-2025 |
| Growth Rate | CAGR of 6.00% from 2020-2034 |
| Segmentation |
|
Table of Contents
- 1. Introduction
- 1.1. Research Scope
- 1.2. Market Segmentation
- 1.3. Research Objective
- 1.4. Definitions and Assumptions
- 2. Executive Summary
- 2.1. Market Snapshot
- 3. Market Dynamics
- 3.1. Market Drivers
- 3.2. Market Restrains
- 3.3. Market Trends
- 3.4. Market Opportunities
- 4. Market Factor Analysis
- 4.1. Porters Five Forces
- 4.1.1. Bargaining Power of Suppliers
- 4.1.2. Bargaining Power of Buyers
- 4.1.3. Threat of New Entrants
- 4.1.4. Threat of Substitutes
- 4.1.5. Competitive Rivalry
- 4.2. PESTEL analysis
- 4.3. BCG Analysis
- 4.3.1. Stars (High Growth, High Market Share)
- 4.3.2. Cash Cows (Low Growth, High Market Share)
- 4.3.3. Question Mark (High Growth, Low Market Share)
- 4.3.4. Dogs (Low Growth, Low Market Share)
- 4.4. Ansoff Matrix Analysis
- 4.5. Supply Chain Analysis
- 4.6. Regulatory Landscape
- 4.7. Current Market Potential and Opportunity Assessment (TAM–SAM–SOM Framework)
- 4.8. DMV Analyst Note
- 4.1. Porters Five Forces
- 5. Market Analysis, Insights and Forecast 2021-2033
- 5.1. Market Analysis, Insights and Forecast - by Product
- 5.1.1. Food and Beverages
- 5.1.2. Personal and Household Care
- 5.1.3. Apparel, Footwear, and Accessories
- 5.1.4. Furniture, Toys, and Hobby
- 5.1.5. Electronic and Household Appliances
- 5.1.6. Other Products
- 5.2. Market Analysis, Insights and Forecast - by Distribution Channel
- 5.2.1. Supermar
- 5.2.2. Specialty Stores
- 5.2.3. Online
- 5.2.4. Other Distribution Channels
- 5.3. Market Analysis, Insights and Forecast - by Region
- 5.3.1. North America
- 5.3.2. South America
- 5.3.3. Europe
- 5.3.4. Middle East & Africa
- 5.3.5. Asia Pacific
- 5.1. Market Analysis, Insights and Forecast - by Product
- 6. Global US Retail 3PL Market Analysis, Insights and Forecast, 2021-2033
- 6.1. Market Analysis, Insights and Forecast - by Product
- 6.1.1. Food and Beverages
- 6.1.2. Personal and Household Care
- 6.1.3. Apparel, Footwear, and Accessories
- 6.1.4. Furniture, Toys, and Hobby
- 6.1.5. Electronic and Household Appliances
- 6.1.6. Other Products
- 6.2. Market Analysis, Insights and Forecast - by Distribution Channel
- 6.2.1. Supermar
- 6.2.2. Specialty Stores
- 6.2.3. Online
- 6.2.4. Other Distribution Channels
- 6.1. Market Analysis, Insights and Forecast - by Product
- 7. North America US Retail 3PL Market Analysis, Insights and Forecast, 2020-2032
- 7.1. Market Analysis, Insights and Forecast - by Product
- 7.1.1. Food and Beverages
- 7.1.2. Personal and Household Care
- 7.1.3. Apparel, Footwear, and Accessories
- 7.1.4. Furniture, Toys, and Hobby
- 7.1.5. Electronic and Household Appliances
- 7.1.6. Other Products
- 7.2. Market Analysis, Insights and Forecast - by Distribution Channel
- 7.2.1. Supermar
- 7.2.2. Specialty Stores
- 7.2.3. Online
- 7.2.4. Other Distribution Channels
- 7.1. Market Analysis, Insights and Forecast - by Product
- 8. South America US Retail 3PL Market Analysis, Insights and Forecast, 2020-2032
- 8.1. Market Analysis, Insights and Forecast - by Product
- 8.1.1. Food and Beverages
- 8.1.2. Personal and Household Care
- 8.1.3. Apparel, Footwear, and Accessories
- 8.1.4. Furniture, Toys, and Hobby
- 8.1.5. Electronic and Household Appliances
- 8.1.6. Other Products
- 8.2. Market Analysis, Insights and Forecast - by Distribution Channel
- 8.2.1. Supermar
- 8.2.2. Specialty Stores
- 8.2.3. Online
- 8.2.4. Other Distribution Channels
- 8.1. Market Analysis, Insights and Forecast - by Product
- 9. Europe US Retail 3PL Market Analysis, Insights and Forecast, 2020-2032
- 9.1. Market Analysis, Insights and Forecast - by Product
- 9.1.1. Food and Beverages
- 9.1.2. Personal and Household Care
- 9.1.3. Apparel, Footwear, and Accessories
- 9.1.4. Furniture, Toys, and Hobby
- 9.1.5. Electronic and Household Appliances
- 9.1.6. Other Products
- 9.2. Market Analysis, Insights and Forecast - by Distribution Channel
- 9.2.1. Supermar
- 9.2.2. Specialty Stores
- 9.2.3. Online
- 9.2.4. Other Distribution Channels
- 9.1. Market Analysis, Insights and Forecast - by Product
- 10. Middle East & Africa US Retail 3PL Market Analysis, Insights and Forecast, 2020-2032
- 10.1. Market Analysis, Insights and Forecast - by Product
- 10.1.1. Food and Beverages
- 10.1.2. Personal and Household Care
- 10.1.3. Apparel, Footwear, and Accessories
- 10.1.4. Furniture, Toys, and Hobby
- 10.1.5. Electronic and Household Appliances
- 10.1.6. Other Products
- 10.2. Market Analysis, Insights and Forecast - by Distribution Channel
- 10.2.1. Supermar
- 10.2.2. Specialty Stores
- 10.2.3. Online
- 10.2.4. Other Distribution Channels
- 10.1. Market Analysis, Insights and Forecast - by Product
- 11. Asia Pacific US Retail 3PL Market Analysis, Insights and Forecast, 2020-2032
- 11.1. Market Analysis, Insights and Forecast - by Product
- 11.1.1. Food and Beverages
- 11.1.2. Personal and Household Care
- 11.1.3. Apparel, Footwear, and Accessories
- 11.1.4. Furniture, Toys, and Hobby
- 11.1.5. Electronic and Household Appliances
- 11.1.6. Other Products
- 11.2. Market Analysis, Insights and Forecast - by Distribution Channel
- 11.2.1. Supermar
- 11.2.2. Specialty Stores
- 11.2.3. Online
- 11.2.4. Other Distribution Channels
- 11.1. Market Analysis, Insights and Forecast - by Product
- 12. Competitive Analysis
- 12.1. Company Profiles
- 12.1.1 J B Hunt
- 12.1.1.1. Company Overview
- 12.1.1.2. Products
- 12.1.1.3. Company Financials
- 12.1.1.4. SWOT Analysis
- 12.1.2 Hub Group
- 12.1.2.1. Company Overview
- 12.1.2.2. Products
- 12.1.2.3. Company Financials
- 12.1.2.4. SWOT Analysis
- 12.1.3 Ceva Logistics
- 12.1.3.1. Company Overview
- 12.1.3.2. Products
- 12.1.3.3. Company Financials
- 12.1.3.4. SWOT Analysis
- 12.1.4 Nippon Express
- 12.1.4.1. Company Overview
- 12.1.4.2. Products
- 12.1.4.3. Company Financials
- 12.1.4.4. SWOT Analysis
- 12.1.5 DHL Supply Chain Logistics
- 12.1.5.1. Company Overview
- 12.1.5.2. Products
- 12.1.5.3. Company Financials
- 12.1.5.4. SWOT Analysis
- 12.1.6 XPO Logistics
- 12.1.6.1. Company Overview
- 12.1.6.2. Products
- 12.1.6.3. Company Financials
- 12.1.6.4. SWOT Analysis
- 12.1.7 C H Robinson
- 12.1.7.1. Company Overview
- 12.1.7.2. Products
- 12.1.7.3. Company Financials
- 12.1.7.4. SWOT Analysis
- 12.1.8 U S Xpress Enterprises
- 12.1.8.1. Company Overview
- 12.1.8.2. Products
- 12.1.8.3. Company Financials
- 12.1.8.4. SWOT Analysis
- 12.1.9 DHL Supply Chain
- 12.1.9.1. Company Overview
- 12.1.9.2. Products
- 12.1.9.3. Company Financials
- 12.1.9.4. SWOT Analysis
- 12.1.10 UPS Supply Chain Solutions**List Not Exhaustive
- 12.1.10.1. Company Overview
- 12.1.10.2. Products
- 12.1.10.3. Company Financials
- 12.1.10.4. SWOT Analysis
- 12.1.11 DSV Panalpina
- 12.1.11.1. Company Overview
- 12.1.11.2. Products
- 12.1.11.3. Company Financials
- 12.1.11.4. SWOT Analysis
- 12.1.1 J B Hunt
- 12.2. Market Entropy
- 12.2.1 Company's Key Areas Served
- 12.2.2 Recent Developments
- 12.3. Company Market Share Analysis 2025
- 12.3.1 Top 5 Companies Market Share Analysis
- 12.3.2 Top 3 Companies Market Share Analysis
- 12.4. List of Potential Customers
- 13. Research Methodology
List of Figures
- Figure 1: Global US Retail 3PL Market Revenue Breakdown (Million, %) by Region 2025 & 2033
- Figure 2: North America US Retail 3PL Market Revenue (Million), by Product 2025 & 2033
- Figure 3: North America US Retail 3PL Market Revenue Share (%), by Product 2025 & 2033
- Figure 4: North America US Retail 3PL Market Revenue (Million), by Distribution Channel 2025 & 2033
- Figure 5: North America US Retail 3PL Market Revenue Share (%), by Distribution Channel 2025 & 2033
- Figure 6: North America US Retail 3PL Market Revenue (Million), by Country 2025 & 2033
- Figure 7: North America US Retail 3PL Market Revenue Share (%), by Country 2025 & 2033
- Figure 8: South America US Retail 3PL Market Revenue (Million), by Product 2025 & 2033
- Figure 9: South America US Retail 3PL Market Revenue Share (%), by Product 2025 & 2033
- Figure 10: South America US Retail 3PL Market Revenue (Million), by Distribution Channel 2025 & 2033
- Figure 11: South America US Retail 3PL Market Revenue Share (%), by Distribution Channel 2025 & 2033
- Figure 12: South America US Retail 3PL Market Revenue (Million), by Country 2025 & 2033
- Figure 13: South America US Retail 3PL Market Revenue Share (%), by Country 2025 & 2033
- Figure 14: Europe US Retail 3PL Market Revenue (Million), by Product 2025 & 2033
- Figure 15: Europe US Retail 3PL Market Revenue Share (%), by Product 2025 & 2033
- Figure 16: Europe US Retail 3PL Market Revenue (Million), by Distribution Channel 2025 & 2033
- Figure 17: Europe US Retail 3PL Market Revenue Share (%), by Distribution Channel 2025 & 2033
- Figure 18: Europe US Retail 3PL Market Revenue (Million), by Country 2025 & 2033
- Figure 19: Europe US Retail 3PL Market Revenue Share (%), by Country 2025 & 2033
- Figure 20: Middle East & Africa US Retail 3PL Market Revenue (Million), by Product 2025 & 2033
- Figure 21: Middle East & Africa US Retail 3PL Market Revenue Share (%), by Product 2025 & 2033
- Figure 22: Middle East & Africa US Retail 3PL Market Revenue (Million), by Distribution Channel 2025 & 2033
- Figure 23: Middle East & Africa US Retail 3PL Market Revenue Share (%), by Distribution Channel 2025 & 2033
- Figure 24: Middle East & Africa US Retail 3PL Market Revenue (Million), by Country 2025 & 2033
- Figure 25: Middle East & Africa US Retail 3PL Market Revenue Share (%), by Country 2025 & 2033
- Figure 26: Asia Pacific US Retail 3PL Market Revenue (Million), by Product 2025 & 2033
- Figure 27: Asia Pacific US Retail 3PL Market Revenue Share (%), by Product 2025 & 2033
- Figure 28: Asia Pacific US Retail 3PL Market Revenue (Million), by Distribution Channel 2025 & 2033
- Figure 29: Asia Pacific US Retail 3PL Market Revenue Share (%), by Distribution Channel 2025 & 2033
- Figure 30: Asia Pacific US Retail 3PL Market Revenue (Million), by Country 2025 & 2033
- Figure 31: Asia Pacific US Retail 3PL Market Revenue Share (%), by Country 2025 & 2033
List of Tables
- Table 1: Global US Retail 3PL Market Revenue Million Forecast, by Product 2020 & 2033
- Table 2: Global US Retail 3PL Market Revenue Million Forecast, by Distribution Channel 2020 & 2033
- Table 3: Global US Retail 3PL Market Revenue Million Forecast, by Region 2020 & 2033
- Table 4: Global US Retail 3PL Market Revenue Million Forecast, by Product 2020 & 2033
- Table 5: Global US Retail 3PL Market Revenue Million Forecast, by Distribution Channel 2020 & 2033
- Table 6: Global US Retail 3PL Market Revenue Million Forecast, by Country 2020 & 2033
- Table 7: United States US Retail 3PL Market Revenue (Million) Forecast, by Application 2020 & 2033
- Table 8: Canada US Retail 3PL Market Revenue (Million) Forecast, by Application 2020 & 2033
- Table 9: Mexico US Retail 3PL Market Revenue (Million) Forecast, by Application 2020 & 2033
- Table 10: Global US Retail 3PL Market Revenue Million Forecast, by Product 2020 & 2033
- Table 11: Global US Retail 3PL Market Revenue Million Forecast, by Distribution Channel 2020 & 2033
- Table 12: Global US Retail 3PL Market Revenue Million Forecast, by Country 2020 & 2033
- Table 13: Brazil US Retail 3PL Market Revenue (Million) Forecast, by Application 2020 & 2033
- Table 14: Argentina US Retail 3PL Market Revenue (Million) Forecast, by Application 2020 & 2033
- Table 15: Rest of South America US Retail 3PL Market Revenue (Million) Forecast, by Application 2020 & 2033
- Table 16: Global US Retail 3PL Market Revenue Million Forecast, by Product 2020 & 2033
- Table 17: Global US Retail 3PL Market Revenue Million Forecast, by Distribution Channel 2020 & 2033
- Table 18: Global US Retail 3PL Market Revenue Million Forecast, by Country 2020 & 2033
- Table 19: United Kingdom US Retail 3PL Market Revenue (Million) Forecast, by Application 2020 & 2033
- Table 20: Germany US Retail 3PL Market Revenue (Million) Forecast, by Application 2020 & 2033
- Table 21: France US Retail 3PL Market Revenue (Million) Forecast, by Application 2020 & 2033
- Table 22: Italy US Retail 3PL Market Revenue (Million) Forecast, by Application 2020 & 2033
- Table 23: Spain US Retail 3PL Market Revenue (Million) Forecast, by Application 2020 & 2033
- Table 24: Russia US Retail 3PL Market Revenue (Million) Forecast, by Application 2020 & 2033
- Table 25: Benelux US Retail 3PL Market Revenue (Million) Forecast, by Application 2020 & 2033
- Table 26: Nordics US Retail 3PL Market Revenue (Million) Forecast, by Application 2020 & 2033
- Table 27: Rest of Europe US Retail 3PL Market Revenue (Million) Forecast, by Application 2020 & 2033
- Table 28: Global US Retail 3PL Market Revenue Million Forecast, by Product 2020 & 2033
- Table 29: Global US Retail 3PL Market Revenue Million Forecast, by Distribution Channel 2020 & 2033
- Table 30: Global US Retail 3PL Market Revenue Million Forecast, by Country 2020 & 2033
- Table 31: Turkey US Retail 3PL Market Revenue (Million) Forecast, by Application 2020 & 2033
- Table 32: Israel US Retail 3PL Market Revenue (Million) Forecast, by Application 2020 & 2033
- Table 33: GCC US Retail 3PL Market Revenue (Million) Forecast, by Application 2020 & 2033
- Table 34: North Africa US Retail 3PL Market Revenue (Million) Forecast, by Application 2020 & 2033
- Table 35: South Africa US Retail 3PL Market Revenue (Million) Forecast, by Application 2020 & 2033
- Table 36: Rest of Middle East & Africa US Retail 3PL Market Revenue (Million) Forecast, by Application 2020 & 2033
- Table 37: Global US Retail 3PL Market Revenue Million Forecast, by Product 2020 & 2033
- Table 38: Global US Retail 3PL Market Revenue Million Forecast, by Distribution Channel 2020 & 2033
- Table 39: Global US Retail 3PL Market Revenue Million Forecast, by Country 2020 & 2033
- Table 40: China US Retail 3PL Market Revenue (Million) Forecast, by Application 2020 & 2033
- Table 41: India US Retail 3PL Market Revenue (Million) Forecast, by Application 2020 & 2033
- Table 42: Japan US Retail 3PL Market Revenue (Million) Forecast, by Application 2020 & 2033
- Table 43: South Korea US Retail 3PL Market Revenue (Million) Forecast, by Application 2020 & 2033
- Table 44: ASEAN US Retail 3PL Market Revenue (Million) Forecast, by Application 2020 & 2033
- Table 45: Oceania US Retail 3PL Market Revenue (Million) Forecast, by Application 2020 & 2033
- Table 46: Rest of Asia Pacific US Retail 3PL Market Revenue (Million) Forecast, by Application 2020 & 2033
Frequently Asked Questions
1. What is the projected Compound Annual Growth Rate (CAGR) of the US Retail 3PL Market?
The projected CAGR is approximately 6.00%.
2. Which companies are prominent players in the US Retail 3PL Market?
Key companies in the market include J B Hunt, Hub Group, Ceva Logistics, Nippon Express, DHL Supply Chain Logistics, XPO Logistics, C H Robinson, U S Xpress Enterprises, DHL Supply Chain, UPS Supply Chain Solutions**List Not Exhaustive, DSV Panalpina.
3. What are the main segments of the US Retail 3PL Market?
The market segments include Product, Distribution Channel.
4. Can you provide details about the market size?
The market size is estimated to be USD 51.94 Million as of 2022.
5. What are some drivers contributing to market growth?
4.; Increasing E-commerce Sales.
6. What are the notable trends driving market growth?
Growth In E-commerce Driving the Market.
7. Are there any restraints impacting market growth?
4.; Drivers Availability.
8. Can you provide examples of recent developments in the market?
July 2023: Knight-Swift Transportation Holdings Inc. (a transportation company), acquired the United States’ truck carrier U.S. Xpress. following the approval by U.S. Xpress’ shareholders on June 29, 2023. Upon completion of the transaction, U.S. Xpress was de-listed from the New York Stock Exchange.
9. What pricing options are available for accessing the report?
Pricing options include single-user, multi-user, and enterprise licenses priced at USD 3800, USD 4500, and USD 5800 respectively.
10. Is the market size provided in terms of value or volume?
The market size is provided in terms of value, measured in Million.
11. Are there any specific market keywords associated with the report?
Yes, the market keyword associated with the report is "US Retail 3PL Market," which aids in identifying and referencing the specific market segment covered.
12. How do I determine which pricing option suits my needs best?
The pricing options vary based on user requirements and access needs. Individual users may opt for single-user licenses, while businesses requiring broader access may choose multi-user or enterprise licenses for cost-effective access to the report.
13. Are there any additional resources or data provided in the US Retail 3PL Market report?
While the report offers comprehensive insights, it's advisable to review the specific contents or supplementary materials provided to ascertain if additional resources or data are available.
14. How can I stay updated on further developments or reports in the US Retail 3PL Market?
To stay informed about further developments, trends, and reports in the US Retail 3PL Market, consider subscribing to industry newsletters, following relevant companies and organizations, or regularly checking reputable industry news sources and publications.
Methodology
Step 1 - Identification of Relevant Samples Size from Population Database


Step 2 - Approaches for Defining Global Market Size (Value, Volume* & Price*)

Note*: In applicable scenarios
Step 3 - Data Sources
Primary Research
- Web Analytics
- Survey Reports
- Research Institute
- Latest Research Reports
- Opinion Leaders
Secondary Research
- Annual Reports
- White Paper
- Latest Press Release
- Industry Association
- Paid Database
- Investor Presentations

Step 4 - Data Triangulation
Involves using different sources of information in order to increase the validity of a study
These sources are likely to be stakeholders in a program - participants, other researchers, program staff, other community members, and so on.
Then we put all data in single framework & apply various statistical tools to find out the dynamic on the market.
During the analysis stage, feedback from the stakeholder groups would be compared to determine areas of agreement as well as areas of divergence