

Key Insights
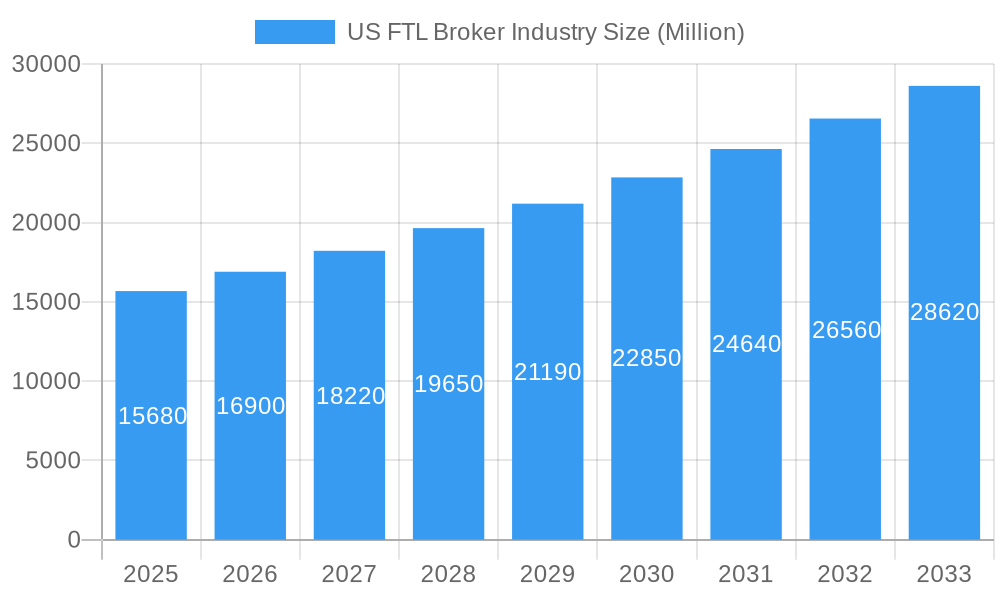
The US Full Truckload (FTL) Brokerage industry is a dynamic market experiencing robust growth, projected to reach a size of $15.68 billion in 2025, with a Compound Annual Growth Rate (CAGR) of 7.86% from 2025 to 2033. This expansion is driven by several key factors. The increasing demand for efficient and cost-effective transportation solutions across diverse sectors, including manufacturing, automotive, oil and gas, and e-commerce, fuels the industry's expansion. Furthermore, technological advancements such as digital freight matching platforms and advanced analytics are optimizing logistics operations, leading to improved efficiency and reduced operational costs. The rise of e-commerce continues to stimulate demand for reliable and timely FTL services, further bolstering market growth. However, challenges such as fluctuating fuel prices, driver shortages, and increasing regulatory compliance costs pose potential constraints. The industry is segmented by end-user, with manufacturing and automotive, oil and gas, and construction representing significant market segments. The competitive landscape is characterized by a mix of large multinational corporations and smaller regional players, leading to intense competition and a focus on innovation and service differentiation. Key players such as Coyote Logistics, Total Quality Logistics, and CH Robinson are leveraging their scale and technological capabilities to gain market share.
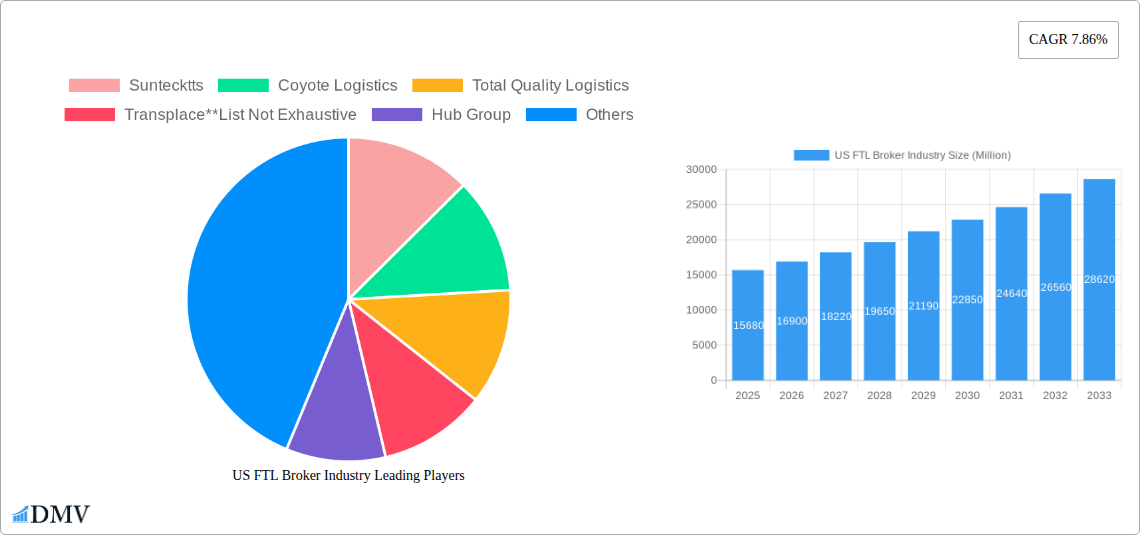
US FTL Broker Industry Market Size (In Billion)
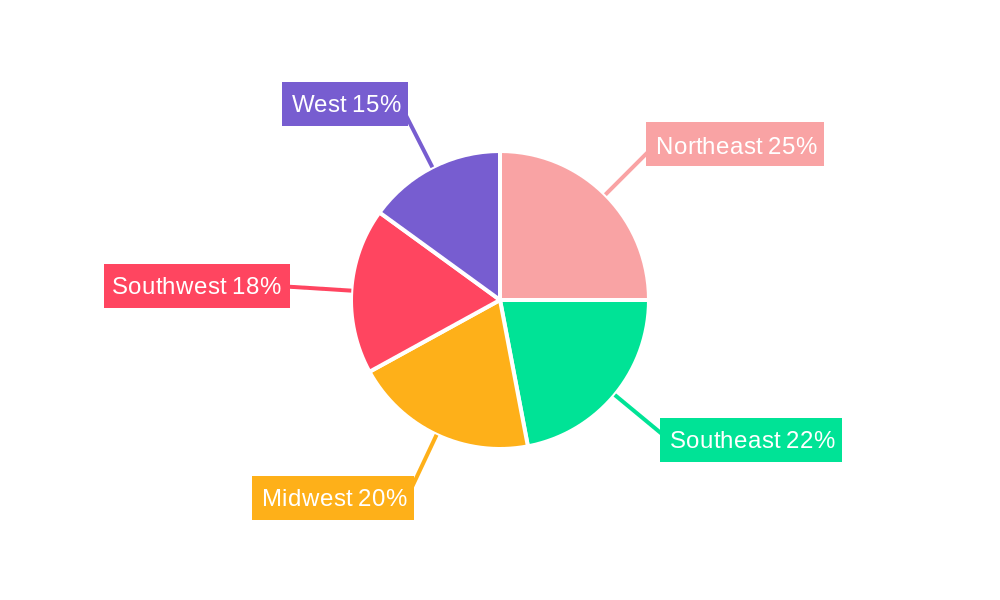
The regional distribution of the US FTL brokerage market reflects the concentration of economic activity. The Northeast, Southeast, Midwest, and West regions all contribute significantly to the overall market size, reflecting the diverse geographic distribution of manufacturing, distribution, and consumer demand. The forecast period of 2025-2033 presents substantial opportunities for industry players who can adapt to evolving market dynamics and effectively address the challenges mentioned above. This includes investing in technology, optimizing operational efficiency, and strategically expanding into high-growth sectors. This will ensure strong profitability and market leadership in this expanding segment of the logistics industry. Future growth will hinge on the ability of brokers to adapt to technological advancements, address driver shortages, and navigate fluctuating fuel prices effectively.
US FTL Broker Industry Company Market Share
US FTL Broker Industry: A Comprehensive Market Report (2019-2033)
This insightful report provides a deep dive into the US Full Truckload (FTL) Broker industry, offering a comprehensive analysis of market trends, leading players, and future growth prospects. The study period spans from 2019 to 2033, with 2025 serving as the base and estimated year. This report is essential for stakeholders seeking to understand the complexities and opportunities within this dynamic sector. The US FTL Broker market is projected to reach xx Million by 2033, showcasing significant growth potential.
US FTL Broker Industry Market Composition & Trends
The US Full Truckload (FTL) Broker market is characterized by a dynamic and evolving landscape, featuring a healthy mix of established giants and agile innovators. While precise market share figures remain proprietary, industry leaders such as Coyote Logistics, CH Robinson, and Total Quality Logistics (TQL) consistently demonstrate significant market influence through their extensive networks and service offerings. The sector's advancement is largely propelled by rapid technological integration, including sophisticated digital freight matching platforms that streamline carrier selection, cutting-edge analytics for optimizing routes and load utilization, and comprehensive Transportation Management Systems (TMS) that enhance visibility and control. The regulatory environment, heavily shaped by the Federal Motor Carrier Safety Administration (FMCSA), plays a crucial role in dictating operational standards and ensuring compliance, influencing everything from driver hours to equipment safety. While FTL brokers are the primary facilitators, they face competition from in-house private fleets managed by large shippers and the more fragmented Less-Than-Truckload (LTL) shipping sector, which caters to smaller shipment needs. The industry is experiencing robust Mergers & Acquisitions (M&A) activity, with annual deal values often reaching into the hundreds of millions of dollars. These acquisitions highlight a strategic trend towards market consolidation, expanding service portfolios, and gaining access to new geographical markets and specialized customer segments.
- Market Concentration: Moderately concentrated, with a few dominant players leading the market, but with ample space for specialized and emerging providers.
- Innovation Catalysts: Digital freight matching, AI-powered advanced analytics for predictive modeling and route optimization, and integrated TMS solutions are key drivers of efficiency and competitive advantage.
- Regulatory Landscape: Primarily governed by FMCSA regulations, emphasizing safety, compliance, and operational transparency, with ongoing adjustments to address evolving industry needs.
- Substitute Products: Private fleets offer shippers direct control, while LTL shipping provides a cost-effective alternative for smaller, consolidated shipments.
- M&A Activity: Significant consolidation is underway, with substantial annual deal values reflecting a strategic push towards market expansion, enhanced service offerings, and acquisition of technological capabilities.
- End-User Profiles: Highly diverse, spanning critical sectors such as manufacturing, automotive, oil & gas, retail, consumer goods, and pharmaceuticals, each with unique logistical demands.
US FTL Broker Industry Industry Evolution
The US FTL Broker industry has experienced substantial growth over the past few years, driven by the increasing demand for efficient and cost-effective transportation solutions. The historical period (2019-2024) witnessed a Compound Annual Growth Rate (CAGR) of xx%, while the forecast period (2025-2033) projects a CAGR of xx%, indicating continued expansion. Technological advancements, including the adoption of digital platforms and AI-powered route optimization, are streamlining operations and enhancing efficiency. Shifts in consumer demand, such as the need for greater transparency and real-time tracking, are influencing industry practices. The rise of e-commerce further fuels growth, requiring more sophisticated logistics solutions. This evolution is also characterized by a growing focus on sustainability and environmental concerns, prompting the adoption of fuel-efficient practices and alternative transportation options. The increasing complexity of supply chains necessitates specialized broker services capable of handling diverse logistics challenges.
Leading Regions, Countries, or Segments in US FTL Broker Industry
The Manufacturing and Automotive sectors stand out as the largest and most influential segments within the US FTL Broker market. This dominance is attributed to the high volume of raw materials, components, and finished goods that require timely and efficient transportation. The intricate supply chains inherent in these industries, coupled with demanding just-in-time production schedules, create a perpetual need for reliable FTL brokerage services.
- Key Drivers for Manufacturing & Automotive Dominance:
- Consistent high shipping volumes driven by production demands.
- Strict just-in-time manufacturing and assembly line requirements necessitating precise delivery schedules.
- Substantial investments by companies in logistics optimization and supply chain visibility.
- A supportive regulatory environment that encourages efficient and interconnected transportation networks to facilitate trade and production.
Beyond these leading sectors, the Oil and Gas industry, with its unique requirements for transporting heavy equipment and specialized materials, and the Distributive Trade sector, encompassing wholesale and retail distribution, represent other significant segments offering substantial opportunities for FTL brokers. Geographically, the market's concentration naturally aligns with regions boasting robust manufacturing bases, major industrial hubs, and extensive transportation infrastructure.
US FTL Broker Industry Product Innovations
Recent innovations focus on enhanced digital platforms offering real-time tracking, predictive analytics for optimized routing, and improved communication between shippers, carriers, and brokers. These innovations offer unique selling propositions like increased transparency, reduced transit times, and improved cost management. The integration of AI and machine learning into these platforms further optimizes efficiency and decision-making.
Propelling Factors for US FTL Broker Industry Growth
The US FTL Broker industry is experiencing robust growth fueled by a confluence of powerful factors. Transformative technological advancements are at the forefront, with digital freight matching platforms revolutionizing carrier procurement and load visibility, while advanced analytics provide actionable insights for optimizing routes, reducing transit times, and improving load fill rates. Integrated TMS solutions offer unparalleled control and transparency across the supply chain. Concurrently, a healthy macroeconomic environment, characterized by sustained economic growth and increasing consumer demand for goods, directly translates into a higher need for efficient and reliable freight transportation services. Furthermore, regulatory frameworks that prioritize safety, environmental stewardship, and streamlined operations indirectly foster industry development by creating a more predictable and secure operating environment. The meteoric rise of e-commerce and the subsequent emphasis on agile and efficient last-mile delivery solutions also significantly contribute to the growing demand for FTL brokerage expertise.
Obstacles in the US FTL Broker Industry Market
The US FTL Broker industry faces challenges, including fluctuating fuel prices, driver shortages, and potential regulatory changes. Supply chain disruptions, such as those experienced in recent years, can significantly impact operations and profitability. Intense competition among established brokers and new entrants creates pricing pressure and necessitates continuous innovation.
Future Opportunities in US FTL Broker Industry
The future for US FTL brokers is rich with opportunities, particularly in capitalizing on emerging trends and expanding into specialized areas. Significant potential lies in the development and adoption of niche market specializations, catering to industries with unique or complex shipping needs, such as temperature-controlled goods or oversized equipment. The integration of emerging technologies like blockchain promises to enhance transparency, security, and traceability throughout the supply chain, offering significant advantages. A growing imperative for sustainable logistics practices presents another avenue for differentiation, with brokers focusing on eco-friendly transportation solutions and carbon footprint reduction. The burgeoning healthcare and pharmaceutical sectors, with their stringent requirements for specialized handling and delivery, represent a lucrative and expanding market. Moreover, the continued growth of cross-border e-commerce necessitates increasingly sophisticated and adaptable logistics solutions, creating ample opportunities for brokers adept at navigating international trade complexities and customs procedures.
Major Players in the US FTL Broker Industry Ecosystem
- Suntecktts
- Coyote Logistics (Coyote Logistics)
- Total Quality Logistics (Total Quality Logistics)
- Transplace (Transplace)
- Hub Group (Hub Group)
- Landstar System Inc (Landstar System Inc)
- CH Robinson (CH Robinson)
- BNSF Logistics LLC (BNSF Logistics LLC)
- XPO Logistics Inc (XPO Logistics Inc)
- Worldwide Express (Worldwide Express)
- Schneider (Schneider)
- Echo Global Logistics (Echo Global Logistics)
- J B Hunt Transport Inc (J B Hunt Transport Inc)
- Kag Logistics Inc
- Globaltranz
Key Developments in US FTL Broker Industry Industry
- September 2023: Rhenus acquires ITS Logistics Hungary KFT, expanding its air freight services in Hungary.
- September 2023: Rhenus Group acquires BLU Logistics, significantly strengthening its presence in LATAM and Asia-LATAM trade lanes.
Strategic US FTL Broker Industry Market Forecast
The US FTL Broker industry is on a trajectory for sustained and dynamic growth, underpinned by a continued wave of technological innovation, the ever-expanding reach of e-commerce, and the increasing intricacy of global supply chains. The industry's future will be significantly shaped by a heightened focus on operational efficiency, end-to-end transparency, and the integration of sustainable logistics practices. These themes will not only drive competitive advantage but also define the value proposition for brokers. For investors and industry participants, this projected growth rate signals a highly promising outlook, ripe with opportunities for strategic partnerships, market expansion, and the implementation of forward-thinking business models. Companies that can effectively leverage technology, adapt to evolving customer demands, and demonstrate a commitment to sustainability are best positioned to thrive in this evolving market.
US FTL Broker Industry Segmentation
-
1. End User
- 1.1. Manufacturing and Automotive
- 1.2. Oil and Gas, Mining, and Quarrying
- 1.3. Agriculture Fishing, and Forestry
- 1.4. Construction
- 1.5. Distributive Trade
- 1.6. Other End Users
US FTL Broker Industry Segmentation By Geography
-
1. North America
- 1.1. United States
- 1.2. Canada
- 1.3. Mexico
-
2. South America
- 2.1. Brazil
- 2.2. Argentina
- 2.3. Rest of South America
-
3. Europe
- 3.1. United Kingdom
- 3.2. Germany
- 3.3. France
- 3.4. Italy
- 3.5. Spain
- 3.6. Russia
- 3.7. Benelux
- 3.8. Nordics
- 3.9. Rest of Europe
-
4. Middle East & Africa
- 4.1. Turkey
- 4.2. Israel
- 4.3. GCC
- 4.4. North Africa
- 4.5. South Africa
- 4.6. Rest of Middle East & Africa
-
5. Asia Pacific
- 5.1. China
- 5.2. India
- 5.3. Japan
- 5.4. South Korea
- 5.5. ASEAN
- 5.6. Oceania
- 5.7. Rest of Asia Pacific
US FTL Broker Industry Regional Market Share
Geographic Coverage of US FTL Broker Industry
US FTL Broker Industry REPORT HIGHLIGHTS
| Aspects | Details |
|---|---|
| Study Period | 2020-2034 |
| Base Year | 2025 |
| Estimated Year | 2026 |
| Forecast Period | 2026-2034 |
| Historical Period | 2020-2025 |
| Growth Rate | CAGR of 7.86% from 2020-2034 |
| Segmentation |
|
Table of Contents
- 1. Introduction
- 1.1. Research Scope
- 1.2. Market Segmentation
- 1.3. Research Objective
- 1.4. Definitions and Assumptions
- 2. Executive Summary
- 2.1. Market Snapshot
- 3. Market Dynamics
- 3.1. Market Drivers
- 3.2. Market Restrains
- 3.3. Market Trends
- 3.4. Market Opportunities
- 4. Market Factor Analysis
- 4.1. Porters Five Forces
- 4.1.1. Bargaining Power of Suppliers
- 4.1.2. Bargaining Power of Buyers
- 4.1.3. Threat of New Entrants
- 4.1.4. Threat of Substitutes
- 4.1.5. Competitive Rivalry
- 4.2. PESTEL analysis
- 4.3. BCG Analysis
- 4.3.1. Stars (High Growth, High Market Share)
- 4.3.2. Cash Cows (Low Growth, High Market Share)
- 4.3.3. Question Mark (High Growth, Low Market Share)
- 4.3.4. Dogs (Low Growth, Low Market Share)
- 4.4. Ansoff Matrix Analysis
- 4.5. Supply Chain Analysis
- 4.6. Regulatory Landscape
- 4.7. Current Market Potential and Opportunity Assessment (TAM–SAM–SOM Framework)
- 4.8. DMV Analyst Note
- 4.1. Porters Five Forces
- 5. Market Analysis, Insights and Forecast 2021-2033
- 5.1. Market Analysis, Insights and Forecast - by End User
- 5.1.1. Manufacturing and Automotive
- 5.1.2. Oil and Gas, Mining, and Quarrying
- 5.1.3. Agriculture Fishing, and Forestry
- 5.1.4. Construction
- 5.1.5. Distributive Trade
- 5.1.6. Other End Users
- 5.2. Market Analysis, Insights and Forecast - by Region
- 5.2.1. North America
- 5.2.2. South America
- 5.2.3. Europe
- 5.2.4. Middle East & Africa
- 5.2.5. Asia Pacific
- 5.1. Market Analysis, Insights and Forecast - by End User
- 6. Global US FTL Broker Industry Analysis, Insights and Forecast, 2021-2033
- 6.1. Market Analysis, Insights and Forecast - by End User
- 6.1.1. Manufacturing and Automotive
- 6.1.2. Oil and Gas, Mining, and Quarrying
- 6.1.3. Agriculture Fishing, and Forestry
- 6.1.4. Construction
- 6.1.5. Distributive Trade
- 6.1.6. Other End Users
- 6.1. Market Analysis, Insights and Forecast - by End User
- 7. North America US FTL Broker Industry Analysis, Insights and Forecast, 2020-2032
- 7.1. Market Analysis, Insights and Forecast - by End User
- 7.1.1. Manufacturing and Automotive
- 7.1.2. Oil and Gas, Mining, and Quarrying
- 7.1.3. Agriculture Fishing, and Forestry
- 7.1.4. Construction
- 7.1.5. Distributive Trade
- 7.1.6. Other End Users
- 7.1. Market Analysis, Insights and Forecast - by End User
- 8. South America US FTL Broker Industry Analysis, Insights and Forecast, 2020-2032
- 8.1. Market Analysis, Insights and Forecast - by End User
- 8.1.1. Manufacturing and Automotive
- 8.1.2. Oil and Gas, Mining, and Quarrying
- 8.1.3. Agriculture Fishing, and Forestry
- 8.1.4. Construction
- 8.1.5. Distributive Trade
- 8.1.6. Other End Users
- 8.1. Market Analysis, Insights and Forecast - by End User
- 9. Europe US FTL Broker Industry Analysis, Insights and Forecast, 2020-2032
- 9.1. Market Analysis, Insights and Forecast - by End User
- 9.1.1. Manufacturing and Automotive
- 9.1.2. Oil and Gas, Mining, and Quarrying
- 9.1.3. Agriculture Fishing, and Forestry
- 9.1.4. Construction
- 9.1.5. Distributive Trade
- 9.1.6. Other End Users
- 9.1. Market Analysis, Insights and Forecast - by End User
- 10. Middle East & Africa US FTL Broker Industry Analysis, Insights and Forecast, 2020-2032
- 10.1. Market Analysis, Insights and Forecast - by End User
- 10.1.1. Manufacturing and Automotive
- 10.1.2. Oil and Gas, Mining, and Quarrying
- 10.1.3. Agriculture Fishing, and Forestry
- 10.1.4. Construction
- 10.1.5. Distributive Trade
- 10.1.6. Other End Users
- 10.1. Market Analysis, Insights and Forecast - by End User
- 11. Asia Pacific US FTL Broker Industry Analysis, Insights and Forecast, 2020-2032
- 11.1. Market Analysis, Insights and Forecast - by End User
- 11.1.1. Manufacturing and Automotive
- 11.1.2. Oil and Gas, Mining, and Quarrying
- 11.1.3. Agriculture Fishing, and Forestry
- 11.1.4. Construction
- 11.1.5. Distributive Trade
- 11.1.6. Other End Users
- 11.1. Market Analysis, Insights and Forecast - by End User
- 12. Competitive Analysis
- 12.1. Company Profiles
- 12.1.1 Suntecktts
- 12.1.1.1. Company Overview
- 12.1.1.2. Products
- 12.1.1.3. Company Financials
- 12.1.1.4. SWOT Analysis
- 12.1.2 Coyote Logistics
- 12.1.2.1. Company Overview
- 12.1.2.2. Products
- 12.1.2.3. Company Financials
- 12.1.2.4. SWOT Analysis
- 12.1.3 Total Quality Logistics
- 12.1.3.1. Company Overview
- 12.1.3.2. Products
- 12.1.3.3. Company Financials
- 12.1.3.4. SWOT Analysis
- 12.1.4 Transplace**List Not Exhaustive
- 12.1.4.1. Company Overview
- 12.1.4.2. Products
- 12.1.4.3. Company Financials
- 12.1.4.4. SWOT Analysis
- 12.1.5 Hub Group
- 12.1.5.1. Company Overview
- 12.1.5.2. Products
- 12.1.5.3. Company Financials
- 12.1.5.4. SWOT Analysis
- 12.1.6 Landstar System Inc
- 12.1.6.1. Company Overview
- 12.1.6.2. Products
- 12.1.6.3. Company Financials
- 12.1.6.4. SWOT Analysis
- 12.1.7 CH Robinson
- 12.1.7.1. Company Overview
- 12.1.7.2. Products
- 12.1.7.3. Company Financials
- 12.1.7.4. SWOT Analysis
- 12.1.8 BNSF Logistics LLC
- 12.1.8.1. Company Overview
- 12.1.8.2. Products
- 12.1.8.3. Company Financials
- 12.1.8.4. SWOT Analysis
- 12.1.9 XPO Logistics Inc
- 12.1.9.1. Company Overview
- 12.1.9.2. Products
- 12.1.9.3. Company Financials
- 12.1.9.4. SWOT Analysis
- 12.1.10 Worldwide Express
- 12.1.10.1. Company Overview
- 12.1.10.2. Products
- 12.1.10.3. Company Financials
- 12.1.10.4. SWOT Analysis
- 12.1.11 Schneider
- 12.1.11.1. Company Overview
- 12.1.11.2. Products
- 12.1.11.3. Company Financials
- 12.1.11.4. SWOT Analysis
- 12.1.12 Echo Global Logistics
- 12.1.12.1. Company Overview
- 12.1.12.2. Products
- 12.1.12.3. Company Financials
- 12.1.12.4. SWOT Analysis
- 12.1.13 J B Hunt Transport Inc
- 12.1.13.1. Company Overview
- 12.1.13.2. Products
- 12.1.13.3. Company Financials
- 12.1.13.4. SWOT Analysis
- 12.1.14 Kag Logistics Inc
- 12.1.14.1. Company Overview
- 12.1.14.2. Products
- 12.1.14.3. Company Financials
- 12.1.14.4. SWOT Analysis
- 12.1.15 Globaltranz
- 12.1.15.1. Company Overview
- 12.1.15.2. Products
- 12.1.15.3. Company Financials
- 12.1.15.4. SWOT Analysis
- 12.1.1 Suntecktts
- 12.2. Market Entropy
- 12.2.1 Company's Key Areas Served
- 12.2.2 Recent Developments
- 12.3. Company Market Share Analysis 2025
- 12.3.1 Top 5 Companies Market Share Analysis
- 12.3.2 Top 3 Companies Market Share Analysis
- 12.4. List of Potential Customers
- 13. Research Methodology
List of Figures
- Figure 1: Global US FTL Broker Industry Revenue Breakdown (Million, %) by Region 2025 & 2033
- Figure 2: North America US FTL Broker Industry Revenue (Million), by End User 2025 & 2033
- Figure 3: North America US FTL Broker Industry Revenue Share (%), by End User 2025 & 2033
- Figure 4: North America US FTL Broker Industry Revenue (Million), by Country 2025 & 2033
- Figure 5: North America US FTL Broker Industry Revenue Share (%), by Country 2025 & 2033
- Figure 6: South America US FTL Broker Industry Revenue (Million), by End User 2025 & 2033
- Figure 7: South America US FTL Broker Industry Revenue Share (%), by End User 2025 & 2033
- Figure 8: South America US FTL Broker Industry Revenue (Million), by Country 2025 & 2033
- Figure 9: South America US FTL Broker Industry Revenue Share (%), by Country 2025 & 2033
- Figure 10: Europe US FTL Broker Industry Revenue (Million), by End User 2025 & 2033
- Figure 11: Europe US FTL Broker Industry Revenue Share (%), by End User 2025 & 2033
- Figure 12: Europe US FTL Broker Industry Revenue (Million), by Country 2025 & 2033
- Figure 13: Europe US FTL Broker Industry Revenue Share (%), by Country 2025 & 2033
- Figure 14: Middle East & Africa US FTL Broker Industry Revenue (Million), by End User 2025 & 2033
- Figure 15: Middle East & Africa US FTL Broker Industry Revenue Share (%), by End User 2025 & 2033
- Figure 16: Middle East & Africa US FTL Broker Industry Revenue (Million), by Country 2025 & 2033
- Figure 17: Middle East & Africa US FTL Broker Industry Revenue Share (%), by Country 2025 & 2033
- Figure 18: Asia Pacific US FTL Broker Industry Revenue (Million), by End User 2025 & 2033
- Figure 19: Asia Pacific US FTL Broker Industry Revenue Share (%), by End User 2025 & 2033
- Figure 20: Asia Pacific US FTL Broker Industry Revenue (Million), by Country 2025 & 2033
- Figure 21: Asia Pacific US FTL Broker Industry Revenue Share (%), by Country 2025 & 2033
List of Tables
- Table 1: Global US FTL Broker Industry Revenue Million Forecast, by End User 2020 & 2033
- Table 2: Global US FTL Broker Industry Revenue Million Forecast, by Region 2020 & 2033
- Table 3: Global US FTL Broker Industry Revenue Million Forecast, by End User 2020 & 2033
- Table 4: Global US FTL Broker Industry Revenue Million Forecast, by Country 2020 & 2033
- Table 5: United States US FTL Broker Industry Revenue (Million) Forecast, by Application 2020 & 2033
- Table 6: Canada US FTL Broker Industry Revenue (Million) Forecast, by Application 2020 & 2033
- Table 7: Mexico US FTL Broker Industry Revenue (Million) Forecast, by Application 2020 & 2033
- Table 8: Global US FTL Broker Industry Revenue Million Forecast, by End User 2020 & 2033
- Table 9: Global US FTL Broker Industry Revenue Million Forecast, by Country 2020 & 2033
- Table 10: Brazil US FTL Broker Industry Revenue (Million) Forecast, by Application 2020 & 2033
- Table 11: Argentina US FTL Broker Industry Revenue (Million) Forecast, by Application 2020 & 2033
- Table 12: Rest of South America US FTL Broker Industry Revenue (Million) Forecast, by Application 2020 & 2033
- Table 13: Global US FTL Broker Industry Revenue Million Forecast, by End User 2020 & 2033
- Table 14: Global US FTL Broker Industry Revenue Million Forecast, by Country 2020 & 2033
- Table 15: United Kingdom US FTL Broker Industry Revenue (Million) Forecast, by Application 2020 & 2033
- Table 16: Germany US FTL Broker Industry Revenue (Million) Forecast, by Application 2020 & 2033
- Table 17: France US FTL Broker Industry Revenue (Million) Forecast, by Application 2020 & 2033
- Table 18: Italy US FTL Broker Industry Revenue (Million) Forecast, by Application 2020 & 2033
- Table 19: Spain US FTL Broker Industry Revenue (Million) Forecast, by Application 2020 & 2033
- Table 20: Russia US FTL Broker Industry Revenue (Million) Forecast, by Application 2020 & 2033
- Table 21: Benelux US FTL Broker Industry Revenue (Million) Forecast, by Application 2020 & 2033
- Table 22: Nordics US FTL Broker Industry Revenue (Million) Forecast, by Application 2020 & 2033
- Table 23: Rest of Europe US FTL Broker Industry Revenue (Million) Forecast, by Application 2020 & 2033
- Table 24: Global US FTL Broker Industry Revenue Million Forecast, by End User 2020 & 2033
- Table 25: Global US FTL Broker Industry Revenue Million Forecast, by Country 2020 & 2033
- Table 26: Turkey US FTL Broker Industry Revenue (Million) Forecast, by Application 2020 & 2033
- Table 27: Israel US FTL Broker Industry Revenue (Million) Forecast, by Application 2020 & 2033
- Table 28: GCC US FTL Broker Industry Revenue (Million) Forecast, by Application 2020 & 2033
- Table 29: North Africa US FTL Broker Industry Revenue (Million) Forecast, by Application 2020 & 2033
- Table 30: South Africa US FTL Broker Industry Revenue (Million) Forecast, by Application 2020 & 2033
- Table 31: Rest of Middle East & Africa US FTL Broker Industry Revenue (Million) Forecast, by Application 2020 & 2033
- Table 32: Global US FTL Broker Industry Revenue Million Forecast, by End User 2020 & 2033
- Table 33: Global US FTL Broker Industry Revenue Million Forecast, by Country 2020 & 2033
- Table 34: China US FTL Broker Industry Revenue (Million) Forecast, by Application 2020 & 2033
- Table 35: India US FTL Broker Industry Revenue (Million) Forecast, by Application 2020 & 2033
- Table 36: Japan US FTL Broker Industry Revenue (Million) Forecast, by Application 2020 & 2033
- Table 37: South Korea US FTL Broker Industry Revenue (Million) Forecast, by Application 2020 & 2033
- Table 38: ASEAN US FTL Broker Industry Revenue (Million) Forecast, by Application 2020 & 2033
- Table 39: Oceania US FTL Broker Industry Revenue (Million) Forecast, by Application 2020 & 2033
- Table 40: Rest of Asia Pacific US FTL Broker Industry Revenue (Million) Forecast, by Application 2020 & 2033
Frequently Asked Questions
1. What is the projected Compound Annual Growth Rate (CAGR) of the US FTL Broker Industry?
The projected CAGR is approximately 7.86%.
2. Which companies are prominent players in the US FTL Broker Industry?
Key companies in the market include Suntecktts, Coyote Logistics, Total Quality Logistics, Transplace**List Not Exhaustive, Hub Group, Landstar System Inc, CH Robinson, BNSF Logistics LLC, XPO Logistics Inc, Worldwide Express, Schneider, Echo Global Logistics, J B Hunt Transport Inc, Kag Logistics Inc, Globaltranz.
3. What are the main segments of the US FTL Broker Industry?
The market segments include End User.
4. Can you provide details about the market size?
The market size is estimated to be USD 15.68 Million as of 2022.
5. What are some drivers contributing to market growth?
4.; Increasing demand for efficient transportation4.; Growing eCommerce industry.
6. What are the notable trends driving market growth?
Fluctuating Fuel prices Hampering the Growth of the Market.
7. Are there any restraints impacting market growth?
4.; Intense competition affecting the market4.; Fluctuating fuel prices.
8. Can you provide examples of recent developments in the market?
Sept 2023: Rhenus continues its growth trajectory with the strategic acquisition of the Hungarian freight forwarder ITS Logistics Hungary KFT. This move will enable them to better serve their customer's needs, particularly in relation to air freight services, while also expanding their reach in the Hungarian market.
9. What pricing options are available for accessing the report?
Pricing options include single-user, multi-user, and enterprise licenses priced at USD 3800, USD 4500, and USD 5800 respectively.
10. Is the market size provided in terms of value or volume?
The market size is provided in terms of value, measured in Million.
11. Are there any specific market keywords associated with the report?
Yes, the market keyword associated with the report is "US FTL Broker Industry," which aids in identifying and referencing the specific market segment covered.
12. How do I determine which pricing option suits my needs best?
The pricing options vary based on user requirements and access needs. Individual users may opt for single-user licenses, while businesses requiring broader access may choose multi-user or enterprise licenses for cost-effective access to the report.
13. Are there any additional resources or data provided in the US FTL Broker Industry report?
While the report offers comprehensive insights, it's advisable to review the specific contents or supplementary materials provided to ascertain if additional resources or data are available.
14. How can I stay updated on further developments or reports in the US FTL Broker Industry?
To stay informed about further developments, trends, and reports in the US FTL Broker Industry, consider subscribing to industry newsletters, following relevant companies and organizations, or regularly checking reputable industry news sources and publications.
Methodology
Step 1 - Identification of Relevant Samples Size from Population Database


Step 2 - Approaches for Defining Global Market Size (Value, Volume* & Price*)

Note*: In applicable scenarios
Step 3 - Data Sources
Primary Research
- Web Analytics
- Survey Reports
- Research Institute
- Latest Research Reports
- Opinion Leaders
Secondary Research
- Annual Reports
- White Paper
- Latest Press Release
- Industry Association
- Paid Database
- Investor Presentations

Step 4 - Data Triangulation
Involves using different sources of information in order to increase the validity of a study
These sources are likely to be stakeholders in a program - participants, other researchers, program staff, other community members, and so on.
Then we put all data in single framework & apply various statistical tools to find out the dynamic on the market.
During the analysis stage, feedback from the stakeholder groups would be compared to determine areas of agreement as well as areas of divergence