

Key Insights
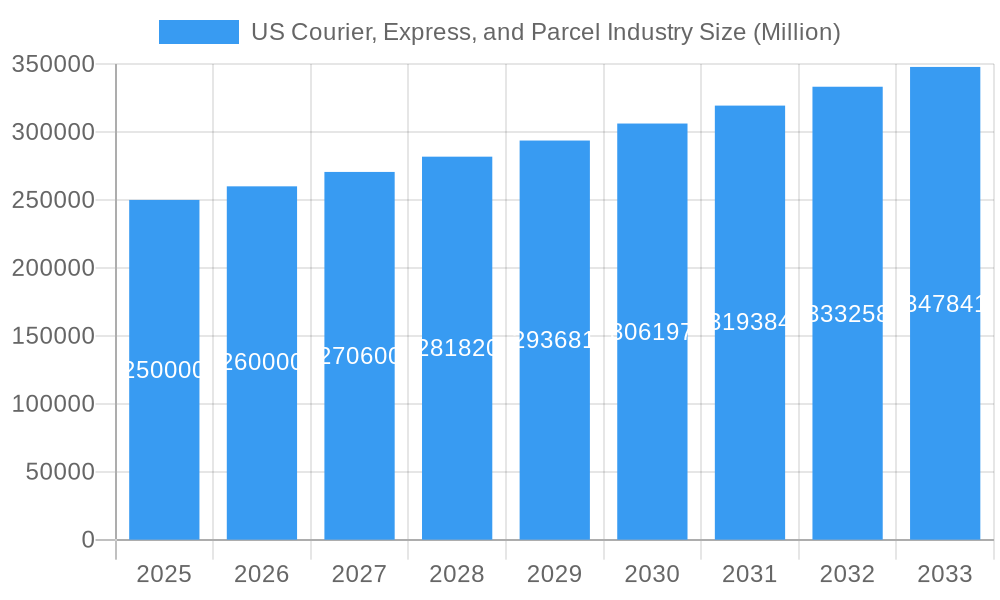
The United States Courier, Express, and Parcel (CEP) industry is a rapidly expanding sector, propelled by the sustained growth of e-commerce and escalating demand for expedited shipping. With a projected market size of $130.55 billion by 2025, the industry is expected to witness a compound annual growth rate (CAGR) of 8.6%. Key growth drivers include the burgeoning online retail landscape, particularly within the Business-to-Consumer (B2C) segment, and the increasing need for swift and dependable logistics solutions from the healthcare and e-commerce sectors. Advancements in automation and data analytics are further streamlining operational efficiencies.
US Courier, Express, and Parcel Industry Market Size (In Billion)
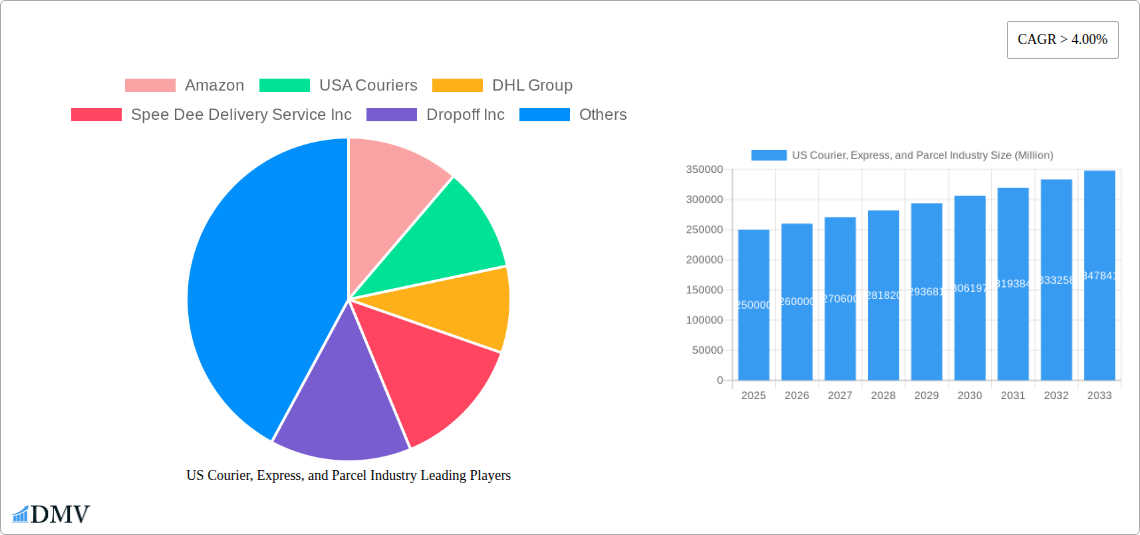
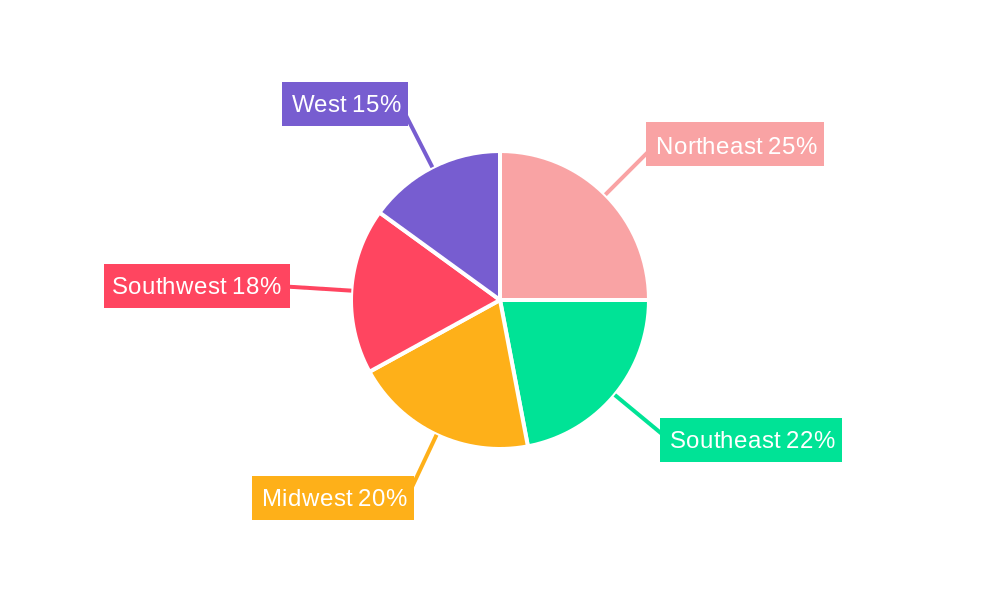
The competitive environment is dominated by major industry leaders such as Amazon, FedEx, UPS, and DHL. Market segmentation highlights express delivery, B2B and B2C models, and lightweight shipments as significant revenue contributors. While heavyweight shipments and Business-to-Consumer (C2C) transactions, fueled by peer-to-peer marketplaces, also play a vital role, regional disparities are evident. The Northeast, West, and Southeast regions are anticipated to hold larger market shares due to higher population densities and robust e-commerce ecosystems.
US Courier, Express, and Parcel Industry Company Market Share
Challenges facing the industry include volatile fuel costs, rising labor expenses, and evolving regulatory frameworks. Nevertheless, emerging innovations such as drone delivery, optimized last-mile logistics, and sustainable shipping practices present promising avenues for future expansion. The continuous integration of technology, coupled with the demand for enhanced transparency and real-time tracking, is fundamentally reshaping the CEP landscape. This necessitates ongoing adaptation and strategic investment from market participants. The long-term outlook for the US CEP industry remains exceptionally positive, with consistent growth anticipated through 2033, driven by the enduring e-commerce surge and evolving consumer expectations for rapid and reliable delivery, presenting compelling investment opportunities.
US Courier, Express, and Parcel Market Analysis: Trends, Growth, and Forecast (2019-2033)
This comprehensive report offers in-depth market analysis of the US courier, express, and parcel industry, providing critical insights for stakeholders and investors. It examines market dynamics, key growth catalysts, competitive strategies, and future industry trajectories from 2019 to 2033, with a specific focus on the 2025 base year. The report's robust methodology integrates historical data (2019-2024), base year estimations, and detailed forecasts (2025-2033). Analysis includes prominent players such as Amazon, FedEx, UPS, DHL, and USPS, offering a granular perspective on this multi-billion dollar market.
US Courier, Express, and Parcel Industry Market Composition & Trends
This section examines the competitive intensity and innovation within the US courier, express, and parcel market. We analyze market share distribution among key players, highlighting the dominance of established giants and the emergence of disruptive players. The influence of regulatory changes, the presence of substitute services, and the evolving profiles of end-users are also thoroughly explored. Furthermore, the report details recent mergers and acquisitions (M&A) activities, quantifying deal values in millions of USD (e.g., DHL's $9.6 million investment in Denver) and assessing their impact on market consolidation and competitive dynamics. Specific metrics like market concentration ratios and M&A deal frequency are provided to illustrate the shifting landscape. The analysis considers the influence of factors such as technological advancements and evolving consumer preferences, illustrating their impact on market share dynamics across segments.
- Market Share Distribution: Amazon (xx%), FedEx (xx%), UPS (xx%), USPS (xx%), DHL (xx%), Others (xx%).
- M&A Deal Values (2019-2024): Total value exceeding $xx Million.
- Key Innovation Catalysts: Automation, AI-powered logistics, last-mile delivery solutions.
- Regulatory Landscape: Impact of federal and state regulations on pricing, safety, and environmental sustainability.
- Substitute Products: Growth of alternative delivery models (e.g., drone delivery, autonomous vehicles).
US Courier, Express, and Parcel Industry Industry Evolution
This section provides a detailed analysis of the growth trajectory of the US courier, express, and parcel industry, spanning the historical period (2019-2024) and projecting into the forecast period (2025-2033). We explore the underlying factors driving market expansion, including the influence of technological innovations, such as the adoption of advanced tracking and delivery management systems. The study also investigates the impact of changing consumer behavior and preferences on the market's overall growth pattern. This involves analyzing shifts in demand for different delivery speeds (express vs. non-express) and delivery models (B2B, B2C, C2C). The impact of e-commerce growth, the increasing preference for same-day delivery, and the role of technological advancements in enhancing efficiency and reducing costs are examined. Quantifiable data points, including compound annual growth rates (CAGRs) and adoption rates of key technologies, are presented to support the analysis. The evolution of the industry structure, including the increasing role of third-party logistics providers (3PLs) and the impact of consolidation through M&A activities, is also covered in detail. The analysis also considers the influence of macroeconomic factors, such as economic growth and fluctuations, on the demand for courier, express, and parcel services.
Leading Regions, Countries, or Segments in US Courier, Express, and Parcel Industry
This section identifies the leading segments within the US courier, express, and parcel industry. It analyzes the dominance factors behind these leading segments, including regional variations in population density, economic activity, and infrastructure development. The analysis also considers the influence of regulatory policies and government initiatives, which may vary across states or regions. Investment trends, infrastructure development, and regulatory support in these key segments are discussed in detail.
- Dominant Destination: Domestic (xx% of market) due to high e-commerce penetration and robust domestic infrastructure.
- Dominant Speed of Delivery: Express delivery (xx% of market) driven by time-sensitive consumer demands and business needs.
- Dominant Model: B2C (xx% of market) fueled by the e-commerce boom and online retail growth.
- Dominant Shipment Weight: Medium-weight shipments (xx% of market) represent a balance between volume and profitability.
- Dominant Mode of Transport: Road (xx% of market) due to its extensive network and cost-effectiveness.
- Dominant End-User Industry: E-commerce (xx% of market) due to its explosive growth and reliance on courier services.
The analysis will explain why domestic delivery maintains its dominant position, why express delivery remains vital, why B2C is the leading model, the prevalence of medium-weight shipments, the reliance on road transport, and the continued dominance of e-commerce as an end-user industry.
US Courier, Express, and Parcel Industry Product Innovations
Recent product innovations include the rise of same-day and next-day delivery options, enhanced tracking technologies, automated sorting systems, and the increasing integration of AI and machine learning for route optimization and delivery prediction. These innovations are driven by the need for faster delivery, improved customer experience, and increased operational efficiency. Companies are emphasizing unique selling propositions like guaranteed delivery times, real-time tracking, and specialized handling for fragile or high-value goods. The adoption of these innovative solutions has significantly impacted the performance metrics of the industry, leading to faster delivery speeds, reduced costs, and improved customer satisfaction.
Propelling Factors for US Courier, Express, and Parcel Industry Growth
The US courier, express, and parcel industry's growth is fueled by several factors. The explosive growth of e-commerce has substantially increased demand for delivery services. Technological advancements like automation and AI improve efficiency and reduce costs. Favorable regulatory environments in certain states encourage industry expansion. The rising disposable income and increased consumer spending also contribute to higher demand for efficient and reliable shipping options.
Obstacles in the US Courier, Express, and Parcel Industry Market
The industry faces challenges including fluctuating fuel prices, rising labor costs, and intense competition. Supply chain disruptions, like those seen recently, can lead to delivery delays and increased costs. Stringent regulations related to emissions and environmental sustainability can also impact profitability. Competition from new entrants and established players puts pressure on pricing and margins. These challenges, if not adequately addressed, can significantly impact the profitability and efficiency of the industry.
Future Opportunities in US Courier, Express, and Parcel Industry
Future opportunities lie in expanding into underserved markets, developing innovative last-mile delivery solutions (e.g., drone delivery), and leveraging AI and machine learning for enhanced route optimization and predictive analytics. The growing demand for sustainable and environmentally friendly delivery options presents a significant opportunity for businesses to adopt eco-friendly practices and technologies. Focusing on niche markets (e.g., specialized healthcare or high-value goods delivery) and personalized services offers substantial growth potential.
Key Developments in US Courier, Express, and Parcel Industry Industry
- December 2023: Amazon delivered 1 billion packages from its same-day delivery sites in the US, significantly expanding its reach and capacity.
- December 2023: Amazon launched a second same-day delivery facility in Massachusetts, further strengthening its presence in the region.
- July 2023: DHL Express invested $9.6 million in a new Denver facility, enhancing its operational capabilities and improving service in a key commercial hub.
These developments underscore the ongoing investment and expansion within the industry, driven by strong demand and technological innovation.
Strategic US Courier, Express, and Parcel Industry Market Forecast
The US courier, express, and parcel industry is poised for continued growth, driven by the sustained expansion of e-commerce, technological advancements, and increasing consumer expectations for faster and more reliable delivery. New market opportunities in specialized segments and the adoption of innovative delivery models will further propel market expansion. The forecast anticipates a significant increase in market volume and value over the coming years, making it an attractive sector for investment and strategic partnerships.
US Courier, Express, and Parcel Industry Segmentation
-
1. Destination
- 1.1. Domestic
- 1.2. International
-
2. Speed Of Delivery
- 2.1. Express
- 2.2. Non-Express
-
3. Model
- 3.1. Business-to-Business (B2B)
- 3.2. Business-to-Consumer (B2C)
- 3.3. Consumer-to-Consumer (C2C)
-
4. Shipment Weight
- 4.1. Heavy Weight Shipments
- 4.2. Light Weight Shipments
- 4.3. Medium Weight Shipments
-
5. Mode Of Transport
- 5.1. Air
- 5.2. Road
- 5.3. Others
-
6. End User Industry
- 6.1. E-Commerce
- 6.2. Financial Services (BFSI)
- 6.3. Healthcare
- 6.4. Manufacturing
- 6.5. Primary Industry
- 6.6. Wholesale and Retail Trade (Offline)
- 6.7. Others
US Courier, Express, and Parcel Industry Segmentation By Geography
-
1. North America
- 1.1. United States
- 1.2. Canada
- 1.3. Mexico
-
2. South America
- 2.1. Brazil
- 2.2. Argentina
- 2.3. Rest of South America
-
3. Europe
- 3.1. United Kingdom
- 3.2. Germany
- 3.3. France
- 3.4. Italy
- 3.5. Spain
- 3.6. Russia
- 3.7. Benelux
- 3.8. Nordics
- 3.9. Rest of Europe
-
4. Middle East & Africa
- 4.1. Turkey
- 4.2. Israel
- 4.3. GCC
- 4.4. North Africa
- 4.5. South Africa
- 4.6. Rest of Middle East & Africa
-
5. Asia Pacific
- 5.1. China
- 5.2. India
- 5.3. Japan
- 5.4. South Korea
- 5.5. ASEAN
- 5.6. Oceania
- 5.7. Rest of Asia Pacific
US Courier, Express, and Parcel Industry Regional Market Share
Geographic Coverage of US Courier, Express, and Parcel Industry
US Courier, Express, and Parcel Industry REPORT HIGHLIGHTS
| Aspects | Details |
|---|---|
| Study Period | 2020-2034 |
| Base Year | 2025 |
| Estimated Year | 2026 |
| Forecast Period | 2026-2034 |
| Historical Period | 2020-2025 |
| Growth Rate | CAGR of 8.6% from 2020-2034 |
| Segmentation |
|
Table of Contents
- 1. Introduction
- 1.1. Research Scope
- 1.2. Market Segmentation
- 1.3. Research Objective
- 1.4. Definitions and Assumptions
- 2. Executive Summary
- 2.1. Market Snapshot
- 3. Market Dynamics
- 3.1. Market Drivers
- 3.2. Market Restrains
- 3.3. Market Trends
- 3.4. Market Opportunities
- 4. Market Factor Analysis
- 4.1. Porters Five Forces
- 4.1.1. Bargaining Power of Suppliers
- 4.1.2. Bargaining Power of Buyers
- 4.1.3. Threat of New Entrants
- 4.1.4. Threat of Substitutes
- 4.1.5. Competitive Rivalry
- 4.2. PESTEL analysis
- 4.3. BCG Analysis
- 4.3.1. Stars (High Growth, High Market Share)
- 4.3.2. Cash Cows (Low Growth, High Market Share)
- 4.3.3. Question Mark (High Growth, Low Market Share)
- 4.3.4. Dogs (Low Growth, Low Market Share)
- 4.4. Ansoff Matrix Analysis
- 4.5. Supply Chain Analysis
- 4.6. Regulatory Landscape
- 4.7. Current Market Potential and Opportunity Assessment (TAM–SAM–SOM Framework)
- 4.8. DMV Analyst Note
- 4.1. Porters Five Forces
- 5. Market Analysis, Insights and Forecast 2021-2033
- 5.1. Market Analysis, Insights and Forecast - by Destination
- 5.1.1. Domestic
- 5.1.2. International
- 5.2. Market Analysis, Insights and Forecast - by Speed Of Delivery
- 5.2.1. Express
- 5.2.2. Non-Express
- 5.3. Market Analysis, Insights and Forecast - by Model
- 5.3.1. Business-to-Business (B2B)
- 5.3.2. Business-to-Consumer (B2C)
- 5.3.3. Consumer-to-Consumer (C2C)
- 5.4. Market Analysis, Insights and Forecast - by Shipment Weight
- 5.4.1. Heavy Weight Shipments
- 5.4.2. Light Weight Shipments
- 5.4.3. Medium Weight Shipments
- 5.5. Market Analysis, Insights and Forecast - by Mode Of Transport
- 5.5.1. Air
- 5.5.2. Road
- 5.5.3. Others
- 5.6. Market Analysis, Insights and Forecast - by End User Industry
- 5.6.1. E-Commerce
- 5.6.2. Financial Services (BFSI)
- 5.6.3. Healthcare
- 5.6.4. Manufacturing
- 5.6.5. Primary Industry
- 5.6.6. Wholesale and Retail Trade (Offline)
- 5.6.7. Others
- 5.7. Market Analysis, Insights and Forecast - by Region
- 5.7.1. North America
- 5.7.2. South America
- 5.7.3. Europe
- 5.7.4. Middle East & Africa
- 5.7.5. Asia Pacific
- 5.1. Market Analysis, Insights and Forecast - by Destination
- 6. Global US Courier, Express, and Parcel Industry Analysis, Insights and Forecast, 2021-2033
- 6.1. Market Analysis, Insights and Forecast - by Destination
- 6.1.1. Domestic
- 6.1.2. International
- 6.2. Market Analysis, Insights and Forecast - by Speed Of Delivery
- 6.2.1. Express
- 6.2.2. Non-Express
- 6.3. Market Analysis, Insights and Forecast - by Model
- 6.3.1. Business-to-Business (B2B)
- 6.3.2. Business-to-Consumer (B2C)
- 6.3.3. Consumer-to-Consumer (C2C)
- 6.4. Market Analysis, Insights and Forecast - by Shipment Weight
- 6.4.1. Heavy Weight Shipments
- 6.4.2. Light Weight Shipments
- 6.4.3. Medium Weight Shipments
- 6.5. Market Analysis, Insights and Forecast - by Mode Of Transport
- 6.5.1. Air
- 6.5.2. Road
- 6.5.3. Others
- 6.6. Market Analysis, Insights and Forecast - by End User Industry
- 6.6.1. E-Commerce
- 6.6.2. Financial Services (BFSI)
- 6.6.3. Healthcare
- 6.6.4. Manufacturing
- 6.6.5. Primary Industry
- 6.6.6. Wholesale and Retail Trade (Offline)
- 6.6.7. Others
- 6.1. Market Analysis, Insights and Forecast - by Destination
- 7. North America US Courier, Express, and Parcel Industry Analysis, Insights and Forecast, 2020-2032
- 7.1. Market Analysis, Insights and Forecast - by Destination
- 7.1.1. Domestic
- 7.1.2. International
- 7.2. Market Analysis, Insights and Forecast - by Speed Of Delivery
- 7.2.1. Express
- 7.2.2. Non-Express
- 7.3. Market Analysis, Insights and Forecast - by Model
- 7.3.1. Business-to-Business (B2B)
- 7.3.2. Business-to-Consumer (B2C)
- 7.3.3. Consumer-to-Consumer (C2C)
- 7.4. Market Analysis, Insights and Forecast - by Shipment Weight
- 7.4.1. Heavy Weight Shipments
- 7.4.2. Light Weight Shipments
- 7.4.3. Medium Weight Shipments
- 7.5. Market Analysis, Insights and Forecast - by Mode Of Transport
- 7.5.1. Air
- 7.5.2. Road
- 7.5.3. Others
- 7.6. Market Analysis, Insights and Forecast - by End User Industry
- 7.6.1. E-Commerce
- 7.6.2. Financial Services (BFSI)
- 7.6.3. Healthcare
- 7.6.4. Manufacturing
- 7.6.5. Primary Industry
- 7.6.6. Wholesale and Retail Trade (Offline)
- 7.6.7. Others
- 7.1. Market Analysis, Insights and Forecast - by Destination
- 8. South America US Courier, Express, and Parcel Industry Analysis, Insights and Forecast, 2020-2032
- 8.1. Market Analysis, Insights and Forecast - by Destination
- 8.1.1. Domestic
- 8.1.2. International
- 8.2. Market Analysis, Insights and Forecast - by Speed Of Delivery
- 8.2.1. Express
- 8.2.2. Non-Express
- 8.3. Market Analysis, Insights and Forecast - by Model
- 8.3.1. Business-to-Business (B2B)
- 8.3.2. Business-to-Consumer (B2C)
- 8.3.3. Consumer-to-Consumer (C2C)
- 8.4. Market Analysis, Insights and Forecast - by Shipment Weight
- 8.4.1. Heavy Weight Shipments
- 8.4.2. Light Weight Shipments
- 8.4.3. Medium Weight Shipments
- 8.5. Market Analysis, Insights and Forecast - by Mode Of Transport
- 8.5.1. Air
- 8.5.2. Road
- 8.5.3. Others
- 8.6. Market Analysis, Insights and Forecast - by End User Industry
- 8.6.1. E-Commerce
- 8.6.2. Financial Services (BFSI)
- 8.6.3. Healthcare
- 8.6.4. Manufacturing
- 8.6.5. Primary Industry
- 8.6.6. Wholesale and Retail Trade (Offline)
- 8.6.7. Others
- 8.1. Market Analysis, Insights and Forecast - by Destination
- 9. Europe US Courier, Express, and Parcel Industry Analysis, Insights and Forecast, 2020-2032
- 9.1. Market Analysis, Insights and Forecast - by Destination
- 9.1.1. Domestic
- 9.1.2. International
- 9.2. Market Analysis, Insights and Forecast - by Speed Of Delivery
- 9.2.1. Express
- 9.2.2. Non-Express
- 9.3. Market Analysis, Insights and Forecast - by Model
- 9.3.1. Business-to-Business (B2B)
- 9.3.2. Business-to-Consumer (B2C)
- 9.3.3. Consumer-to-Consumer (C2C)
- 9.4. Market Analysis, Insights and Forecast - by Shipment Weight
- 9.4.1. Heavy Weight Shipments
- 9.4.2. Light Weight Shipments
- 9.4.3. Medium Weight Shipments
- 9.5. Market Analysis, Insights and Forecast - by Mode Of Transport
- 9.5.1. Air
- 9.5.2. Road
- 9.5.3. Others
- 9.6. Market Analysis, Insights and Forecast - by End User Industry
- 9.6.1. E-Commerce
- 9.6.2. Financial Services (BFSI)
- 9.6.3. Healthcare
- 9.6.4. Manufacturing
- 9.6.5. Primary Industry
- 9.6.6. Wholesale and Retail Trade (Offline)
- 9.6.7. Others
- 9.1. Market Analysis, Insights and Forecast - by Destination
- 10. Middle East & Africa US Courier, Express, and Parcel Industry Analysis, Insights and Forecast, 2020-2032
- 10.1. Market Analysis, Insights and Forecast - by Destination
- 10.1.1. Domestic
- 10.1.2. International
- 10.2. Market Analysis, Insights and Forecast - by Speed Of Delivery
- 10.2.1. Express
- 10.2.2. Non-Express
- 10.3. Market Analysis, Insights and Forecast - by Model
- 10.3.1. Business-to-Business (B2B)
- 10.3.2. Business-to-Consumer (B2C)
- 10.3.3. Consumer-to-Consumer (C2C)
- 10.4. Market Analysis, Insights and Forecast - by Shipment Weight
- 10.4.1. Heavy Weight Shipments
- 10.4.2. Light Weight Shipments
- 10.4.3. Medium Weight Shipments
- 10.5. Market Analysis, Insights and Forecast - by Mode Of Transport
- 10.5.1. Air
- 10.5.2. Road
- 10.5.3. Others
- 10.6. Market Analysis, Insights and Forecast - by End User Industry
- 10.6.1. E-Commerce
- 10.6.2. Financial Services (BFSI)
- 10.6.3. Healthcare
- 10.6.4. Manufacturing
- 10.6.5. Primary Industry
- 10.6.6. Wholesale and Retail Trade (Offline)
- 10.6.7. Others
- 10.1. Market Analysis, Insights and Forecast - by Destination
- 11. Asia Pacific US Courier, Express, and Parcel Industry Analysis, Insights and Forecast, 2020-2032
- 11.1. Market Analysis, Insights and Forecast - by Destination
- 11.1.1. Domestic
- 11.1.2. International
- 11.2. Market Analysis, Insights and Forecast - by Speed Of Delivery
- 11.2.1. Express
- 11.2.2. Non-Express
- 11.3. Market Analysis, Insights and Forecast - by Model
- 11.3.1. Business-to-Business (B2B)
- 11.3.2. Business-to-Consumer (B2C)
- 11.3.3. Consumer-to-Consumer (C2C)
- 11.4. Market Analysis, Insights and Forecast - by Shipment Weight
- 11.4.1. Heavy Weight Shipments
- 11.4.2. Light Weight Shipments
- 11.4.3. Medium Weight Shipments
- 11.5. Market Analysis, Insights and Forecast - by Mode Of Transport
- 11.5.1. Air
- 11.5.2. Road
- 11.5.3. Others
- 11.6. Market Analysis, Insights and Forecast - by End User Industry
- 11.6.1. E-Commerce
- 11.6.2. Financial Services (BFSI)
- 11.6.3. Healthcare
- 11.6.4. Manufacturing
- 11.6.5. Primary Industry
- 11.6.6. Wholesale and Retail Trade (Offline)
- 11.6.7. Others
- 11.1. Market Analysis, Insights and Forecast - by Destination
- 12. Competitive Analysis
- 12.1. Company Profiles
- 12.1.1 Amazon
- 12.1.1.1. Company Overview
- 12.1.1.2. Products
- 12.1.1.3. Company Financials
- 12.1.1.4. SWOT Analysis
- 12.1.2 USA Couriers
- 12.1.2.1. Company Overview
- 12.1.2.2. Products
- 12.1.2.3. Company Financials
- 12.1.2.4. SWOT Analysis
- 12.1.3 DHL Group
- 12.1.3.1. Company Overview
- 12.1.3.2. Products
- 12.1.3.3. Company Financials
- 12.1.3.4. SWOT Analysis
- 12.1.4 Spee Dee Delivery Service Inc
- 12.1.4.1. Company Overview
- 12.1.4.2. Products
- 12.1.4.3. Company Financials
- 12.1.4.4. SWOT Analysis
- 12.1.5 Dropoff Inc
- 12.1.5.1. Company Overview
- 12.1.5.2. Products
- 12.1.5.3. Company Financials
- 12.1.5.4. SWOT Analysis
- 12.1.6 Yellow Corporatio
- 12.1.6.1. Company Overview
- 12.1.6.2. Products
- 12.1.6.3. Company Financials
- 12.1.6.4. SWOT Analysis
- 12.1.7 FedEx
- 12.1.7.1. Company Overview
- 12.1.7.2. Products
- 12.1.7.3. Company Financials
- 12.1.7.4. SWOT Analysis
- 12.1.8 United Parcel Service of America Inc (UPS)
- 12.1.8.1. Company Overview
- 12.1.8.2. Products
- 12.1.8.3. Company Financials
- 12.1.8.4. SWOT Analysis
- 12.1.9 USPS
- 12.1.9.1. Company Overview
- 12.1.9.2. Products
- 12.1.9.3. Company Financials
- 12.1.9.4. SWOT Analysis
- 12.1.10 International Distributions Services (including GLS)
- 12.1.10.1. Company Overview
- 12.1.10.2. Products
- 12.1.10.3. Company Financials
- 12.1.10.4. SWOT Analysis
- 12.1.11 OnTrac
- 12.1.11.1. Company Overview
- 12.1.11.2. Products
- 12.1.11.3. Company Financials
- 12.1.11.4. SWOT Analysis
- 12.1.12 Aramex
- 12.1.12.1. Company Overview
- 12.1.12.2. Products
- 12.1.12.3. Company Financials
- 12.1.12.4. SWOT Analysis
- 12.1.1 Amazon
- 12.2. Market Entropy
- 12.2.1 Company's Key Areas Served
- 12.2.2 Recent Developments
- 12.3. Company Market Share Analysis 2025
- 12.3.1 Top 5 Companies Market Share Analysis
- 12.3.2 Top 3 Companies Market Share Analysis
- 12.4. List of Potential Customers
- 13. Research Methodology
List of Figures
- Figure 1: Global US Courier, Express, and Parcel Industry Revenue Breakdown (billion, %) by Region 2025 & 2033
- Figure 2: North America US Courier, Express, and Parcel Industry Revenue (billion), by Destination 2025 & 2033
- Figure 3: North America US Courier, Express, and Parcel Industry Revenue Share (%), by Destination 2025 & 2033
- Figure 4: North America US Courier, Express, and Parcel Industry Revenue (billion), by Speed Of Delivery 2025 & 2033
- Figure 5: North America US Courier, Express, and Parcel Industry Revenue Share (%), by Speed Of Delivery 2025 & 2033
- Figure 6: North America US Courier, Express, and Parcel Industry Revenue (billion), by Model 2025 & 2033
- Figure 7: North America US Courier, Express, and Parcel Industry Revenue Share (%), by Model 2025 & 2033
- Figure 8: North America US Courier, Express, and Parcel Industry Revenue (billion), by Shipment Weight 2025 & 2033
- Figure 9: North America US Courier, Express, and Parcel Industry Revenue Share (%), by Shipment Weight 2025 & 2033
- Figure 10: North America US Courier, Express, and Parcel Industry Revenue (billion), by Mode Of Transport 2025 & 2033
- Figure 11: North America US Courier, Express, and Parcel Industry Revenue Share (%), by Mode Of Transport 2025 & 2033
- Figure 12: North America US Courier, Express, and Parcel Industry Revenue (billion), by End User Industry 2025 & 2033
- Figure 13: North America US Courier, Express, and Parcel Industry Revenue Share (%), by End User Industry 2025 & 2033
- Figure 14: North America US Courier, Express, and Parcel Industry Revenue (billion), by Country 2025 & 2033
- Figure 15: North America US Courier, Express, and Parcel Industry Revenue Share (%), by Country 2025 & 2033
- Figure 16: South America US Courier, Express, and Parcel Industry Revenue (billion), by Destination 2025 & 2033
- Figure 17: South America US Courier, Express, and Parcel Industry Revenue Share (%), by Destination 2025 & 2033
- Figure 18: South America US Courier, Express, and Parcel Industry Revenue (billion), by Speed Of Delivery 2025 & 2033
- Figure 19: South America US Courier, Express, and Parcel Industry Revenue Share (%), by Speed Of Delivery 2025 & 2033
- Figure 20: South America US Courier, Express, and Parcel Industry Revenue (billion), by Model 2025 & 2033
- Figure 21: South America US Courier, Express, and Parcel Industry Revenue Share (%), by Model 2025 & 2033
- Figure 22: South America US Courier, Express, and Parcel Industry Revenue (billion), by Shipment Weight 2025 & 2033
- Figure 23: South America US Courier, Express, and Parcel Industry Revenue Share (%), by Shipment Weight 2025 & 2033
- Figure 24: South America US Courier, Express, and Parcel Industry Revenue (billion), by Mode Of Transport 2025 & 2033
- Figure 25: South America US Courier, Express, and Parcel Industry Revenue Share (%), by Mode Of Transport 2025 & 2033
- Figure 26: South America US Courier, Express, and Parcel Industry Revenue (billion), by End User Industry 2025 & 2033
- Figure 27: South America US Courier, Express, and Parcel Industry Revenue Share (%), by End User Industry 2025 & 2033
- Figure 28: South America US Courier, Express, and Parcel Industry Revenue (billion), by Country 2025 & 2033
- Figure 29: South America US Courier, Express, and Parcel Industry Revenue Share (%), by Country 2025 & 2033
- Figure 30: Europe US Courier, Express, and Parcel Industry Revenue (billion), by Destination 2025 & 2033
- Figure 31: Europe US Courier, Express, and Parcel Industry Revenue Share (%), by Destination 2025 & 2033
- Figure 32: Europe US Courier, Express, and Parcel Industry Revenue (billion), by Speed Of Delivery 2025 & 2033
- Figure 33: Europe US Courier, Express, and Parcel Industry Revenue Share (%), by Speed Of Delivery 2025 & 2033
- Figure 34: Europe US Courier, Express, and Parcel Industry Revenue (billion), by Model 2025 & 2033
- Figure 35: Europe US Courier, Express, and Parcel Industry Revenue Share (%), by Model 2025 & 2033
- Figure 36: Europe US Courier, Express, and Parcel Industry Revenue (billion), by Shipment Weight 2025 & 2033
- Figure 37: Europe US Courier, Express, and Parcel Industry Revenue Share (%), by Shipment Weight 2025 & 2033
- Figure 38: Europe US Courier, Express, and Parcel Industry Revenue (billion), by Mode Of Transport 2025 & 2033
- Figure 39: Europe US Courier, Express, and Parcel Industry Revenue Share (%), by Mode Of Transport 2025 & 2033
- Figure 40: Europe US Courier, Express, and Parcel Industry Revenue (billion), by End User Industry 2025 & 2033
- Figure 41: Europe US Courier, Express, and Parcel Industry Revenue Share (%), by End User Industry 2025 & 2033
- Figure 42: Europe US Courier, Express, and Parcel Industry Revenue (billion), by Country 2025 & 2033
- Figure 43: Europe US Courier, Express, and Parcel Industry Revenue Share (%), by Country 2025 & 2033
- Figure 44: Middle East & Africa US Courier, Express, and Parcel Industry Revenue (billion), by Destination 2025 & 2033
- Figure 45: Middle East & Africa US Courier, Express, and Parcel Industry Revenue Share (%), by Destination 2025 & 2033
- Figure 46: Middle East & Africa US Courier, Express, and Parcel Industry Revenue (billion), by Speed Of Delivery 2025 & 2033
- Figure 47: Middle East & Africa US Courier, Express, and Parcel Industry Revenue Share (%), by Speed Of Delivery 2025 & 2033
- Figure 48: Middle East & Africa US Courier, Express, and Parcel Industry Revenue (billion), by Model 2025 & 2033
- Figure 49: Middle East & Africa US Courier, Express, and Parcel Industry Revenue Share (%), by Model 2025 & 2033
- Figure 50: Middle East & Africa US Courier, Express, and Parcel Industry Revenue (billion), by Shipment Weight 2025 & 2033
- Figure 51: Middle East & Africa US Courier, Express, and Parcel Industry Revenue Share (%), by Shipment Weight 2025 & 2033
- Figure 52: Middle East & Africa US Courier, Express, and Parcel Industry Revenue (billion), by Mode Of Transport 2025 & 2033
- Figure 53: Middle East & Africa US Courier, Express, and Parcel Industry Revenue Share (%), by Mode Of Transport 2025 & 2033
- Figure 54: Middle East & Africa US Courier, Express, and Parcel Industry Revenue (billion), by End User Industry 2025 & 2033
- Figure 55: Middle East & Africa US Courier, Express, and Parcel Industry Revenue Share (%), by End User Industry 2025 & 2033
- Figure 56: Middle East & Africa US Courier, Express, and Parcel Industry Revenue (billion), by Country 2025 & 2033
- Figure 57: Middle East & Africa US Courier, Express, and Parcel Industry Revenue Share (%), by Country 2025 & 2033
- Figure 58: Asia Pacific US Courier, Express, and Parcel Industry Revenue (billion), by Destination 2025 & 2033
- Figure 59: Asia Pacific US Courier, Express, and Parcel Industry Revenue Share (%), by Destination 2025 & 2033
- Figure 60: Asia Pacific US Courier, Express, and Parcel Industry Revenue (billion), by Speed Of Delivery 2025 & 2033
- Figure 61: Asia Pacific US Courier, Express, and Parcel Industry Revenue Share (%), by Speed Of Delivery 2025 & 2033
- Figure 62: Asia Pacific US Courier, Express, and Parcel Industry Revenue (billion), by Model 2025 & 2033
- Figure 63: Asia Pacific US Courier, Express, and Parcel Industry Revenue Share (%), by Model 2025 & 2033
- Figure 64: Asia Pacific US Courier, Express, and Parcel Industry Revenue (billion), by Shipment Weight 2025 & 2033
- Figure 65: Asia Pacific US Courier, Express, and Parcel Industry Revenue Share (%), by Shipment Weight 2025 & 2033
- Figure 66: Asia Pacific US Courier, Express, and Parcel Industry Revenue (billion), by Mode Of Transport 2025 & 2033
- Figure 67: Asia Pacific US Courier, Express, and Parcel Industry Revenue Share (%), by Mode Of Transport 2025 & 2033
- Figure 68: Asia Pacific US Courier, Express, and Parcel Industry Revenue (billion), by End User Industry 2025 & 2033
- Figure 69: Asia Pacific US Courier, Express, and Parcel Industry Revenue Share (%), by End User Industry 2025 & 2033
- Figure 70: Asia Pacific US Courier, Express, and Parcel Industry Revenue (billion), by Country 2025 & 2033
- Figure 71: Asia Pacific US Courier, Express, and Parcel Industry Revenue Share (%), by Country 2025 & 2033
List of Tables
- Table 1: Global US Courier, Express, and Parcel Industry Revenue billion Forecast, by Destination 2020 & 2033
- Table 2: Global US Courier, Express, and Parcel Industry Revenue billion Forecast, by Speed Of Delivery 2020 & 2033
- Table 3: Global US Courier, Express, and Parcel Industry Revenue billion Forecast, by Model 2020 & 2033
- Table 4: Global US Courier, Express, and Parcel Industry Revenue billion Forecast, by Shipment Weight 2020 & 2033
- Table 5: Global US Courier, Express, and Parcel Industry Revenue billion Forecast, by Mode Of Transport 2020 & 2033
- Table 6: Global US Courier, Express, and Parcel Industry Revenue billion Forecast, by End User Industry 2020 & 2033
- Table 7: Global US Courier, Express, and Parcel Industry Revenue billion Forecast, by Region 2020 & 2033
- Table 8: Global US Courier, Express, and Parcel Industry Revenue billion Forecast, by Destination 2020 & 2033
- Table 9: Global US Courier, Express, and Parcel Industry Revenue billion Forecast, by Speed Of Delivery 2020 & 2033
- Table 10: Global US Courier, Express, and Parcel Industry Revenue billion Forecast, by Model 2020 & 2033
- Table 11: Global US Courier, Express, and Parcel Industry Revenue billion Forecast, by Shipment Weight 2020 & 2033
- Table 12: Global US Courier, Express, and Parcel Industry Revenue billion Forecast, by Mode Of Transport 2020 & 2033
- Table 13: Global US Courier, Express, and Parcel Industry Revenue billion Forecast, by End User Industry 2020 & 2033
- Table 14: Global US Courier, Express, and Parcel Industry Revenue billion Forecast, by Country 2020 & 2033
- Table 15: United States US Courier, Express, and Parcel Industry Revenue (billion) Forecast, by Application 2020 & 2033
- Table 16: Canada US Courier, Express, and Parcel Industry Revenue (billion) Forecast, by Application 2020 & 2033
- Table 17: Mexico US Courier, Express, and Parcel Industry Revenue (billion) Forecast, by Application 2020 & 2033
- Table 18: Global US Courier, Express, and Parcel Industry Revenue billion Forecast, by Destination 2020 & 2033
- Table 19: Global US Courier, Express, and Parcel Industry Revenue billion Forecast, by Speed Of Delivery 2020 & 2033
- Table 20: Global US Courier, Express, and Parcel Industry Revenue billion Forecast, by Model 2020 & 2033
- Table 21: Global US Courier, Express, and Parcel Industry Revenue billion Forecast, by Shipment Weight 2020 & 2033
- Table 22: Global US Courier, Express, and Parcel Industry Revenue billion Forecast, by Mode Of Transport 2020 & 2033
- Table 23: Global US Courier, Express, and Parcel Industry Revenue billion Forecast, by End User Industry 2020 & 2033
- Table 24: Global US Courier, Express, and Parcel Industry Revenue billion Forecast, by Country 2020 & 2033
- Table 25: Brazil US Courier, Express, and Parcel Industry Revenue (billion) Forecast, by Application 2020 & 2033
- Table 26: Argentina US Courier, Express, and Parcel Industry Revenue (billion) Forecast, by Application 2020 & 2033
- Table 27: Rest of South America US Courier, Express, and Parcel Industry Revenue (billion) Forecast, by Application 2020 & 2033
- Table 28: Global US Courier, Express, and Parcel Industry Revenue billion Forecast, by Destination 2020 & 2033
- Table 29: Global US Courier, Express, and Parcel Industry Revenue billion Forecast, by Speed Of Delivery 2020 & 2033
- Table 30: Global US Courier, Express, and Parcel Industry Revenue billion Forecast, by Model 2020 & 2033
- Table 31: Global US Courier, Express, and Parcel Industry Revenue billion Forecast, by Shipment Weight 2020 & 2033
- Table 32: Global US Courier, Express, and Parcel Industry Revenue billion Forecast, by Mode Of Transport 2020 & 2033
- Table 33: Global US Courier, Express, and Parcel Industry Revenue billion Forecast, by End User Industry 2020 & 2033
- Table 34: Global US Courier, Express, and Parcel Industry Revenue billion Forecast, by Country 2020 & 2033
- Table 35: United Kingdom US Courier, Express, and Parcel Industry Revenue (billion) Forecast, by Application 2020 & 2033
- Table 36: Germany US Courier, Express, and Parcel Industry Revenue (billion) Forecast, by Application 2020 & 2033
- Table 37: France US Courier, Express, and Parcel Industry Revenue (billion) Forecast, by Application 2020 & 2033
- Table 38: Italy US Courier, Express, and Parcel Industry Revenue (billion) Forecast, by Application 2020 & 2033
- Table 39: Spain US Courier, Express, and Parcel Industry Revenue (billion) Forecast, by Application 2020 & 2033
- Table 40: Russia US Courier, Express, and Parcel Industry Revenue (billion) Forecast, by Application 2020 & 2033
- Table 41: Benelux US Courier, Express, and Parcel Industry Revenue (billion) Forecast, by Application 2020 & 2033
- Table 42: Nordics US Courier, Express, and Parcel Industry Revenue (billion) Forecast, by Application 2020 & 2033
- Table 43: Rest of Europe US Courier, Express, and Parcel Industry Revenue (billion) Forecast, by Application 2020 & 2033
- Table 44: Global US Courier, Express, and Parcel Industry Revenue billion Forecast, by Destination 2020 & 2033
- Table 45: Global US Courier, Express, and Parcel Industry Revenue billion Forecast, by Speed Of Delivery 2020 & 2033
- Table 46: Global US Courier, Express, and Parcel Industry Revenue billion Forecast, by Model 2020 & 2033
- Table 47: Global US Courier, Express, and Parcel Industry Revenue billion Forecast, by Shipment Weight 2020 & 2033
- Table 48: Global US Courier, Express, and Parcel Industry Revenue billion Forecast, by Mode Of Transport 2020 & 2033
- Table 49: Global US Courier, Express, and Parcel Industry Revenue billion Forecast, by End User Industry 2020 & 2033
- Table 50: Global US Courier, Express, and Parcel Industry Revenue billion Forecast, by Country 2020 & 2033
- Table 51: Turkey US Courier, Express, and Parcel Industry Revenue (billion) Forecast, by Application 2020 & 2033
- Table 52: Israel US Courier, Express, and Parcel Industry Revenue (billion) Forecast, by Application 2020 & 2033
- Table 53: GCC US Courier, Express, and Parcel Industry Revenue (billion) Forecast, by Application 2020 & 2033
- Table 54: North Africa US Courier, Express, and Parcel Industry Revenue (billion) Forecast, by Application 2020 & 2033
- Table 55: South Africa US Courier, Express, and Parcel Industry Revenue (billion) Forecast, by Application 2020 & 2033
- Table 56: Rest of Middle East & Africa US Courier, Express, and Parcel Industry Revenue (billion) Forecast, by Application 2020 & 2033
- Table 57: Global US Courier, Express, and Parcel Industry Revenue billion Forecast, by Destination 2020 & 2033
- Table 58: Global US Courier, Express, and Parcel Industry Revenue billion Forecast, by Speed Of Delivery 2020 & 2033
- Table 59: Global US Courier, Express, and Parcel Industry Revenue billion Forecast, by Model 2020 & 2033
- Table 60: Global US Courier, Express, and Parcel Industry Revenue billion Forecast, by Shipment Weight 2020 & 2033
- Table 61: Global US Courier, Express, and Parcel Industry Revenue billion Forecast, by Mode Of Transport 2020 & 2033
- Table 62: Global US Courier, Express, and Parcel Industry Revenue billion Forecast, by End User Industry 2020 & 2033
- Table 63: Global US Courier, Express, and Parcel Industry Revenue billion Forecast, by Country 2020 & 2033
- Table 64: China US Courier, Express, and Parcel Industry Revenue (billion) Forecast, by Application 2020 & 2033
- Table 65: India US Courier, Express, and Parcel Industry Revenue (billion) Forecast, by Application 2020 & 2033
- Table 66: Japan US Courier, Express, and Parcel Industry Revenue (billion) Forecast, by Application 2020 & 2033
- Table 67: South Korea US Courier, Express, and Parcel Industry Revenue (billion) Forecast, by Application 2020 & 2033
- Table 68: ASEAN US Courier, Express, and Parcel Industry Revenue (billion) Forecast, by Application 2020 & 2033
- Table 69: Oceania US Courier, Express, and Parcel Industry Revenue (billion) Forecast, by Application 2020 & 2033
- Table 70: Rest of Asia Pacific US Courier, Express, and Parcel Industry Revenue (billion) Forecast, by Application 2020 & 2033
Frequently Asked Questions
1. What is the projected Compound Annual Growth Rate (CAGR) of the US Courier, Express, and Parcel Industry?
The projected CAGR is approximately 8.6%.
2. Which companies are prominent players in the US Courier, Express, and Parcel Industry?
Key companies in the market include Amazon, USA Couriers, DHL Group, Spee Dee Delivery Service Inc, Dropoff Inc, Yellow Corporatio, FedEx, United Parcel Service of America Inc (UPS), USPS, International Distributions Services (including GLS), OnTrac, Aramex.
3. What are the main segments of the US Courier, Express, and Parcel Industry?
The market segments include Destination, Speed Of Delivery, Model, Shipment Weight, Mode Of Transport, End User Industry.
4. Can you provide details about the market size?
The market size is estimated to be USD 130.55 billion as of 2022.
5. What are some drivers contributing to market growth?
Increasing consumption of canned and frozen food; Growth urbanization and increased adoption of healthy lifestyle.
6. What are the notable trends driving market growth?
OTHER KEY INDUSTRY TRENDS COVERED IN THE REPORT.
7. Are there any restraints impacting market growth?
Limited self-life of frozen food; Growing awareness regarding the consumption of fresh vegetables and fruits.
8. Can you provide examples of recent developments in the market?
December 2023: Amazon has delivered 1 billion packages from Same-Day sites in the United States. The same-day delivery facilities are designed for quick deliveries, fulfillment, and sorting all from one site making delivering customer packages even faster.December 2023: Amazon has launched 2nd same-day delivery facility in Massachusetts for certain towns and cities in Central Massachusetts. It is a 200,000-square-foot, custom-built site launched in Westborough. It was a part of its plan to expand its same-day delivery services in Massachusetts.July 2023: With the USD 9.6 million investment, DHL Express acquired a location closer to the commercial core in downtown Denver. The new DHL Service Point includes nearly 56,000 sq. ft of combined warehouse and office space, along with 60 positions for vehicles to load and unload shipments around its conveyable sorting system.
9. What pricing options are available for accessing the report?
Pricing options include single-user, multi-user, and enterprise licenses priced at USD 3800, USD 4500, and USD 5800 respectively.
10. Is the market size provided in terms of value or volume?
The market size is provided in terms of value, measured in billion.
11. Are there any specific market keywords associated with the report?
Yes, the market keyword associated with the report is "US Courier, Express, and Parcel Industry," which aids in identifying and referencing the specific market segment covered.
12. How do I determine which pricing option suits my needs best?
The pricing options vary based on user requirements and access needs. Individual users may opt for single-user licenses, while businesses requiring broader access may choose multi-user or enterprise licenses for cost-effective access to the report.
13. Are there any additional resources or data provided in the US Courier, Express, and Parcel Industry report?
While the report offers comprehensive insights, it's advisable to review the specific contents or supplementary materials provided to ascertain if additional resources or data are available.
14. How can I stay updated on further developments or reports in the US Courier, Express, and Parcel Industry?
To stay informed about further developments, trends, and reports in the US Courier, Express, and Parcel Industry, consider subscribing to industry newsletters, following relevant companies and organizations, or regularly checking reputable industry news sources and publications.
Methodology
Step 1 - Identification of Relevant Samples Size from Population Database


Step 2 - Approaches for Defining Global Market Size (Value, Volume* & Price*)

Note*: In applicable scenarios
Step 3 - Data Sources
Primary Research
- Web Analytics
- Survey Reports
- Research Institute
- Latest Research Reports
- Opinion Leaders
Secondary Research
- Annual Reports
- White Paper
- Latest Press Release
- Industry Association
- Paid Database
- Investor Presentations

Step 4 - Data Triangulation
Involves using different sources of information in order to increase the validity of a study
These sources are likely to be stakeholders in a program - participants, other researchers, program staff, other community members, and so on.
Then we put all data in single framework & apply various statistical tools to find out the dynamic on the market.
During the analysis stage, feedback from the stakeholder groups would be compared to determine areas of agreement as well as areas of divergence