

Key Insights
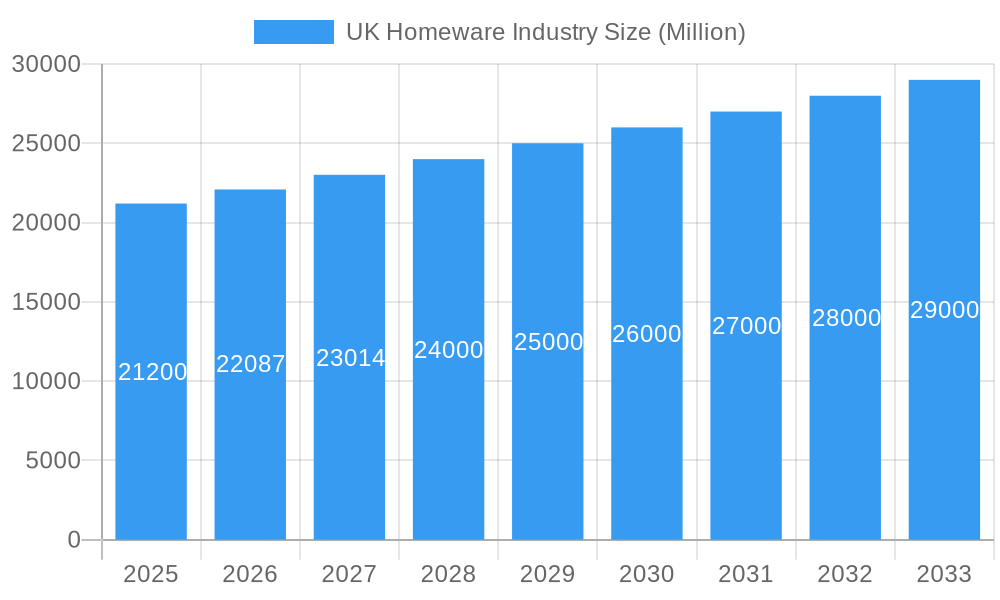
The UK homeware market, valued at £21.20 billion in 2025, is projected to experience steady growth, exhibiting a compound annual growth rate (CAGR) of 4.17% from 2025 to 2033. This expansion is driven by several key factors. The rising disposable incomes among UK households, coupled with a growing preference for home improvement and personalization, fuels demand for aesthetically pleasing and functional homeware products. The increasing popularity of online shopping, facilitated by robust e-commerce infrastructure and convenient delivery services, significantly contributes to market growth. Furthermore, the trend towards minimalist and sustainable living influences consumer choices, driving demand for eco-friendly and durable homeware items. The market is segmented by product type (home furniture, textiles, appliances, floor coverings, décor, and others) and distribution channels (supermarkets, specialty stores, online, and others). Competition is fierce, with both established international brands like IKEA and Bosch, and domestic players like DFS Furniture, vying for market share. While the market faces challenges like fluctuating raw material costs and economic uncertainty, the underlying positive trends suggest a robust outlook for the foreseeable future. The geographically diverse UK market, encompassing England, Wales, Scotland, and Northern Ireland, presents both opportunities and challenges for businesses needing to cater to regional preferences and distribution logistics.
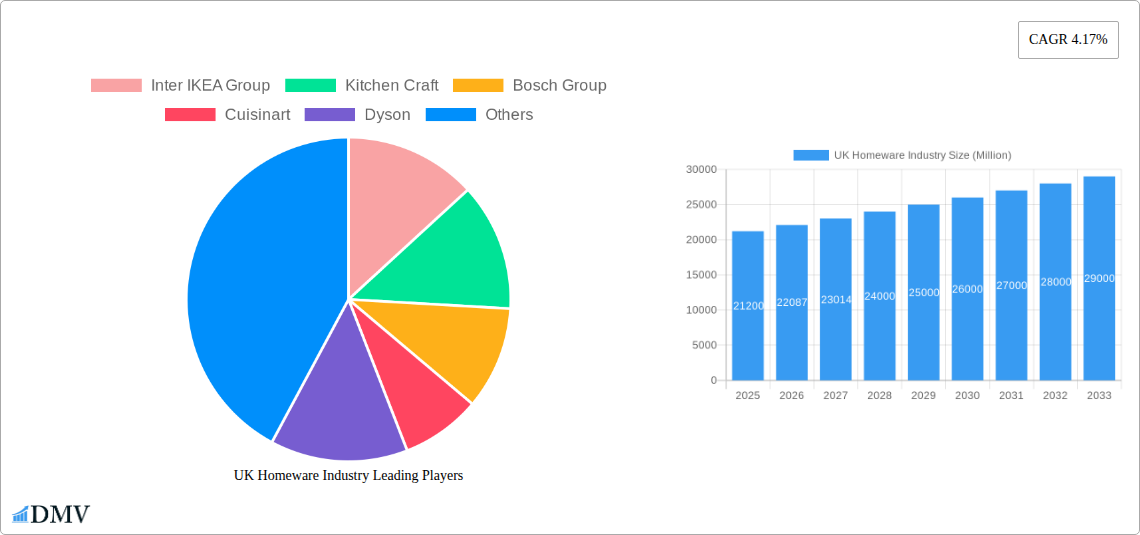
UK Homeware Industry Market Size (In Billion)
The segment analysis reveals a dynamic interplay between various product categories. Home furniture and home textiles consistently represent significant portions of the market, reflecting ongoing investment in home comfort and style. The increasing adoption of smart home technology fuels demand for sophisticated home appliances and lighting solutions. The growing emphasis on creating personalized and aesthetically pleasing living spaces drives substantial growth in the home décor segment. Online distribution channels are experiencing rapid expansion, outpacing traditional retail formats, particularly among younger demographics who embrace online convenience and curated product discovery. Competition within the market is anticipated to remain strong, with brands focusing on innovation, superior customer service, and effective marketing strategies to gain a competitive edge. The continued rise of sustainable and ethically sourced products will play a critical role in shaping future consumer preferences.
UK Homeware Industry Company Market Share
UK Homeware Industry Market Report: 2019-2033
This comprehensive report provides a detailed analysis of the UK homeware industry, encompassing market size, key players, growth drivers, and future trends. Covering the period 2019-2033, with a focus on 2025, this report is an essential resource for stakeholders seeking to understand and capitalize on opportunities within this dynamic sector. The UK homeware market, valued at £XX Billion in 2024, is projected to reach £XX Billion by 2033, exhibiting a Compound Annual Growth Rate (CAGR) of xx%.
UK Homeware Industry Market Composition & Trends
The UK homeware market is characterized by a diverse landscape of established players and emerging brands, competing across various product categories and distribution channels. Market concentration is moderate, with several key players holding significant shares, yet numerous smaller companies contributing significantly to the overall market volume. Innovation is driven by consumer demand for sustainable, technologically advanced, and aesthetically pleasing products. The regulatory landscape, encompassing product safety and environmental regulations, plays a vital role in shaping market practices. Substitute products, such as secondhand furniture and DIY décor options, exert pressure on certain segments, particularly in the budget-conscious consumer bracket. The key end-users include homeowners, renters, and businesses involved in interior design and property development. Significant M&A activity has been observed, particularly within the flooring sector.
- Market Share Distribution (2024): Inter IKEA Group (xx%), DFS Furniture PLC (xx%), Wayfair UK (xx%), Other Players (xx%). (Note: these figures are estimations due to unavailability of precise public data)
- M&A Activity: Significant acquisitions, such as Victoria PLC’s purchases of International Wholesale Tile LLC (IWT) and B3 Ceramics Danismanlik (Graniser) in 2022, valued collectively at £XX Million, demonstrate the consolidation trend in the industry.
UK Homeware Industry Industry Evolution
The UK homeware industry has witnessed substantial evolution over the past five years, marked by significant shifts in consumer preferences, technological advancements, and evolving distribution channels. The growth trajectory has been influenced by factors such as increasing disposable incomes (pre-inflation), the rise of online shopping, and a growing emphasis on home improvement and personalization. Technological innovations, such as smart home appliances and 3D-printed furniture, are gradually reshaping the industry landscape. Consumer demand is increasingly focused on sustainability, ethical sourcing, and personalized experiences, driving the adoption of eco-friendly materials and customized product offerings. The growth rate experienced a dip during the pandemic, followed by a period of recovery driven by pent-up demand and investment in home improvements. The market is also adapting to the evolving needs of diverse demographics, including ageing populations and younger, digitally native consumers.
Leading Regions, Countries, or Segments in UK Homeware Industry
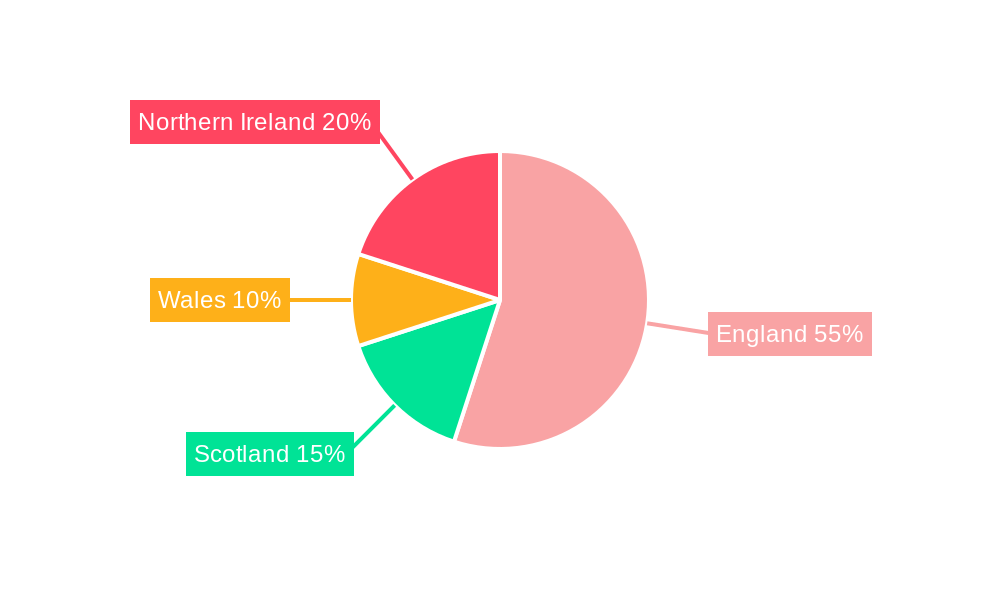
The UK homeware market shows strong regional variations, with London and the South East generally displaying higher spending and consumer demand compared to other regions. This is influenced by factors like higher disposable incomes, a greater concentration of affluent households and increased property values. The online distribution channel is experiencing the highest growth, fuelled by increasing internet penetration and the convenience of e-commerce platforms.
By Product:
- Home Furniture: Strong demand driven by increasing housing costs and a focus on improving living spaces.
- Home Textiles: Growth driven by trends in home décor and the increasing preference for comfortable and stylish home furnishings.
- Home Appliances: Steady growth, influenced by technological advancements and the increasing adoption of smart home technologies.
- Floor Covering Products: Significant growth, particularly boosted by Victoria PLC's acquisitions and investment in innovation.
- Home Décor Products: High growth due to trends in home personalization and a wider range of accessible products.
By Distribution Channel:
- Online Distribution Channels: Fastest-growing segment, driven by e-commerce expansion and consumer preference for convenience.
- Specialty Stores: Remain significant but face competition from online channels.
- Supermarket and Hypermarkets: Offer a broader range of homeware products, impacting smaller specialty stores.
Key Drivers:
- Increased disposable incomes (pre-inflation)
- Growing focus on home improvement and personalization
- Technological advancements in product design and manufacturing
- Rise of e-commerce and online shopping.
UK Homeware Industry Product Innovations
Recent innovations encompass smart home appliances that offer enhanced convenience and energy efficiency, sustainable materials and manufacturing processes that appeal to environmentally conscious consumers, and the integration of technology into furniture and home décor products to create interactive and personalized experiences. These innovations often translate to higher price points, catering to a premium market segment.
Propelling Factors for UK Homeware Industry Growth
The UK homeware industry's growth is propelled by several factors: rising disposable incomes (before inflation), technological advancements leading to more efficient and aesthetically pleasing products, and an increasing focus on home improvement and personalization. Government initiatives promoting sustainable practices and building regulations that influence demand for certain products also contribute.
Obstacles in the UK Homeware Industry Market
Challenges include supply chain disruptions impacting manufacturing and distribution costs, intense competition from both domestic and international players, and economic fluctuations that influence consumer spending. Further regulatory changes concerning product safety, sustainability and ethical sourcing can significantly impact industry players.
Future Opportunities in UK Homeware Industry
Emerging opportunities lie in the increasing adoption of smart home technologies, the growing demand for sustainable and ethically sourced products, and the expansion of personalized home décor options. Targeting specific demographics, such as young professionals or older populations, with tailored product offerings presents significant potential.
Major Players in the UK Homeware Industry Ecosystem
- Inter IKEA Group
- Kitchen Craft
- Bosch Group
- Cuisinart
- Dyson
- Milliken
- Bed Bath and Beyond UK
- DFS Furniture PLC
- Koninklijke Philips NV
- Villeroy and Boch
- Victoria PLC
- Wayfair UK
- Gerflor
Key Developments in UK Homeware Industry Industry
- February 2022: Victoria PLC acquired B3 Ceramics Danismanlik (Graniser), expanding its flooring product portfolio and market presence.
- October 2022: Victoria PLC acquired International Wholesale Tile LLC (IWT), further strengthening its position in the flooring market and expanding its geographical reach. These acquisitions significantly impact market dynamics by increasing Victoria PLC's market share and product range within the UK and internationally.
Strategic UK Homeware Industry Market Forecast
The UK homeware market is poised for continued growth, driven by a combination of factors including technological innovation, increasing consumer spending (dependent on economic performance), and a growing focus on home improvement. The rise of e-commerce and the demand for sustainable products will continue to shape the market landscape, presenting opportunities for companies that can adapt to evolving consumer preferences and technological advancements. The forecast suggests sustained growth across most segments, although economic headwinds may introduce some degree of volatility.
UK Homeware Industry Segmentation
-
1. Product
- 1.1. Home Furniture
- 1.2. Home Textiles
- 1.3. Home Appliances
- 1.4. Floor Covering Products
- 1.5. Home Décor Products
- 1.6. Other Pr
-
2. Distribution Channel
- 2.1. Supermarket and Hypermarkets
- 2.2. Specialty Stores
- 2.3. Online Distribution Channels
- 2.4. Other Distribution Channels
UK Homeware Industry Segmentation By Geography
-
1. North America
- 1.1. United States
- 1.2. Canada
- 1.3. Mexico
-
2. South America
- 2.1. Brazil
- 2.2. Argentina
- 2.3. Rest of South America
-
3. Europe
- 3.1. United Kingdom
- 3.2. Germany
- 3.3. France
- 3.4. Italy
- 3.5. Spain
- 3.6. Russia
- 3.7. Benelux
- 3.8. Nordics
- 3.9. Rest of Europe
-
4. Middle East & Africa
- 4.1. Turkey
- 4.2. Israel
- 4.3. GCC
- 4.4. North Africa
- 4.5. South Africa
- 4.6. Rest of Middle East & Africa
-
5. Asia Pacific
- 5.1. China
- 5.2. India
- 5.3. Japan
- 5.4. South Korea
- 5.5. ASEAN
- 5.6. Oceania
- 5.7. Rest of Asia Pacific
UK Homeware Industry Regional Market Share
Geographic Coverage of UK Homeware Industry
UK Homeware Industry REPORT HIGHLIGHTS
| Aspects | Details |
|---|---|
| Study Period | 2020-2034 |
| Base Year | 2025 |
| Estimated Year | 2026 |
| Forecast Period | 2026-2034 |
| Historical Period | 2020-2025 |
| Growth Rate | CAGR of 4.17% from 2020-2034 |
| Segmentation |
|
Table of Contents
- 1. Introduction
- 1.1. Research Scope
- 1.2. Market Segmentation
- 1.3. Research Objective
- 1.4. Definitions and Assumptions
- 2. Executive Summary
- 2.1. Market Snapshot
- 3. Market Dynamics
- 3.1. Market Drivers
- 3.2. Market Restrains
- 3.3. Market Trends
- 3.4. Market Opportunities
- 4. Market Factor Analysis
- 4.1. Porters Five Forces
- 4.1.1. Bargaining Power of Suppliers
- 4.1.2. Bargaining Power of Buyers
- 4.1.3. Threat of New Entrants
- 4.1.4. Threat of Substitutes
- 4.1.5. Competitive Rivalry
- 4.2. PESTEL analysis
- 4.3. BCG Analysis
- 4.3.1. Stars (High Growth, High Market Share)
- 4.3.2. Cash Cows (Low Growth, High Market Share)
- 4.3.3. Question Mark (High Growth, Low Market Share)
- 4.3.4. Dogs (Low Growth, Low Market Share)
- 4.4. Ansoff Matrix Analysis
- 4.5. Supply Chain Analysis
- 4.6. Regulatory Landscape
- 4.7. Current Market Potential and Opportunity Assessment (TAM–SAM–SOM Framework)
- 4.8. DMV Analyst Note
- 4.1. Porters Five Forces
- 5. Market Analysis, Insights and Forecast 2021-2033
- 5.1. Market Analysis, Insights and Forecast - by Product
- 5.1.1. Home Furniture
- 5.1.2. Home Textiles
- 5.1.3. Home Appliances
- 5.1.4. Floor Covering Products
- 5.1.5. Home Décor Products
- 5.1.6. Other Pr
- 5.2. Market Analysis, Insights and Forecast - by Distribution Channel
- 5.2.1. Supermarket and Hypermarkets
- 5.2.2. Specialty Stores
- 5.2.3. Online Distribution Channels
- 5.2.4. Other Distribution Channels
- 5.3. Market Analysis, Insights and Forecast - by Region
- 5.3.1. North America
- 5.3.2. South America
- 5.3.3. Europe
- 5.3.4. Middle East & Africa
- 5.3.5. Asia Pacific
- 5.1. Market Analysis, Insights and Forecast - by Product
- 6. Global UK Homeware Industry Analysis, Insights and Forecast, 2021-2033
- 6.1. Market Analysis, Insights and Forecast - by Product
- 6.1.1. Home Furniture
- 6.1.2. Home Textiles
- 6.1.3. Home Appliances
- 6.1.4. Floor Covering Products
- 6.1.5. Home Décor Products
- 6.1.6. Other Pr
- 6.2. Market Analysis, Insights and Forecast - by Distribution Channel
- 6.2.1. Supermarket and Hypermarkets
- 6.2.2. Specialty Stores
- 6.2.3. Online Distribution Channels
- 6.2.4. Other Distribution Channels
- 6.1. Market Analysis, Insights and Forecast - by Product
- 7. North America UK Homeware Industry Analysis, Insights and Forecast, 2020-2032
- 7.1. Market Analysis, Insights and Forecast - by Product
- 7.1.1. Home Furniture
- 7.1.2. Home Textiles
- 7.1.3. Home Appliances
- 7.1.4. Floor Covering Products
- 7.1.5. Home Décor Products
- 7.1.6. Other Pr
- 7.2. Market Analysis, Insights and Forecast - by Distribution Channel
- 7.2.1. Supermarket and Hypermarkets
- 7.2.2. Specialty Stores
- 7.2.3. Online Distribution Channels
- 7.2.4. Other Distribution Channels
- 7.1. Market Analysis, Insights and Forecast - by Product
- 8. South America UK Homeware Industry Analysis, Insights and Forecast, 2020-2032
- 8.1. Market Analysis, Insights and Forecast - by Product
- 8.1.1. Home Furniture
- 8.1.2. Home Textiles
- 8.1.3. Home Appliances
- 8.1.4. Floor Covering Products
- 8.1.5. Home Décor Products
- 8.1.6. Other Pr
- 8.2. Market Analysis, Insights and Forecast - by Distribution Channel
- 8.2.1. Supermarket and Hypermarkets
- 8.2.2. Specialty Stores
- 8.2.3. Online Distribution Channels
- 8.2.4. Other Distribution Channels
- 8.1. Market Analysis, Insights and Forecast - by Product
- 9. Europe UK Homeware Industry Analysis, Insights and Forecast, 2020-2032
- 9.1. Market Analysis, Insights and Forecast - by Product
- 9.1.1. Home Furniture
- 9.1.2. Home Textiles
- 9.1.3. Home Appliances
- 9.1.4. Floor Covering Products
- 9.1.5. Home Décor Products
- 9.1.6. Other Pr
- 9.2. Market Analysis, Insights and Forecast - by Distribution Channel
- 9.2.1. Supermarket and Hypermarkets
- 9.2.2. Specialty Stores
- 9.2.3. Online Distribution Channels
- 9.2.4. Other Distribution Channels
- 9.1. Market Analysis, Insights and Forecast - by Product
- 10. Middle East & Africa UK Homeware Industry Analysis, Insights and Forecast, 2020-2032
- 10.1. Market Analysis, Insights and Forecast - by Product
- 10.1.1. Home Furniture
- 10.1.2. Home Textiles
- 10.1.3. Home Appliances
- 10.1.4. Floor Covering Products
- 10.1.5. Home Décor Products
- 10.1.6. Other Pr
- 10.2. Market Analysis, Insights and Forecast - by Distribution Channel
- 10.2.1. Supermarket and Hypermarkets
- 10.2.2. Specialty Stores
- 10.2.3. Online Distribution Channels
- 10.2.4. Other Distribution Channels
- 10.1. Market Analysis, Insights and Forecast - by Product
- 11. Asia Pacific UK Homeware Industry Analysis, Insights and Forecast, 2020-2032
- 11.1. Market Analysis, Insights and Forecast - by Product
- 11.1.1. Home Furniture
- 11.1.2. Home Textiles
- 11.1.3. Home Appliances
- 11.1.4. Floor Covering Products
- 11.1.5. Home Décor Products
- 11.1.6. Other Pr
- 11.2. Market Analysis, Insights and Forecast - by Distribution Channel
- 11.2.1. Supermarket and Hypermarkets
- 11.2.2. Specialty Stores
- 11.2.3. Online Distribution Channels
- 11.2.4. Other Distribution Channels
- 11.1. Market Analysis, Insights and Forecast - by Product
- 12. Competitive Analysis
- 12.1. Company Profiles
- 12.1.1 Inter IKEA Group
- 12.1.1.1. Company Overview
- 12.1.1.2. Products
- 12.1.1.3. Company Financials
- 12.1.1.4. SWOT Analysis
- 12.1.2 Kitchen Craft
- 12.1.2.1. Company Overview
- 12.1.2.2. Products
- 12.1.2.3. Company Financials
- 12.1.2.4. SWOT Analysis
- 12.1.3 Bosch Group
- 12.1.3.1. Company Overview
- 12.1.3.2. Products
- 12.1.3.3. Company Financials
- 12.1.3.4. SWOT Analysis
- 12.1.4 Cuisinart
- 12.1.4.1. Company Overview
- 12.1.4.2. Products
- 12.1.4.3. Company Financials
- 12.1.4.4. SWOT Analysis
- 12.1.5 Dyson
- 12.1.5.1. Company Overview
- 12.1.5.2. Products
- 12.1.5.3. Company Financials
- 12.1.5.4. SWOT Analysis
- 12.1.6 Milliken
- 12.1.6.1. Company Overview
- 12.1.6.2. Products
- 12.1.6.3. Company Financials
- 12.1.6.4. SWOT Analysis
- 12.1.7 Bed Bath and Beyond UK
- 12.1.7.1. Company Overview
- 12.1.7.2. Products
- 12.1.7.3. Company Financials
- 12.1.7.4. SWOT Analysis
- 12.1.8 DFS Furniture PLC
- 12.1.8.1. Company Overview
- 12.1.8.2. Products
- 12.1.8.3. Company Financials
- 12.1.8.4. SWOT Analysis
- 12.1.9 Koninklijke Philips NV
- 12.1.9.1. Company Overview
- 12.1.9.2. Products
- 12.1.9.3. Company Financials
- 12.1.9.4. SWOT Analysis
- 12.1.10 Villeroy and Boch
- 12.1.10.1. Company Overview
- 12.1.10.2. Products
- 12.1.10.3. Company Financials
- 12.1.10.4. SWOT Analysis
- 12.1.11 Victoria PLC
- 12.1.11.1. Company Overview
- 12.1.11.2. Products
- 12.1.11.3. Company Financials
- 12.1.11.4. SWOT Analysis
- 12.1.12 Way Fair UK
- 12.1.12.1. Company Overview
- 12.1.12.2. Products
- 12.1.12.3. Company Financials
- 12.1.12.4. SWOT Analysis
- 12.1.13 Victoria PLC
- 12.1.13.1. Company Overview
- 12.1.13.2. Products
- 12.1.13.3. Company Financials
- 12.1.13.4. SWOT Analysis
- 12.1.14 Gerflor
- 12.1.14.1. Company Overview
- 12.1.14.2. Products
- 12.1.14.3. Company Financials
- 12.1.14.4. SWOT Analysis
- 12.1.1 Inter IKEA Group
- 12.2. Market Entropy
- 12.2.1 Company's Key Areas Served
- 12.2.2 Recent Developments
- 12.3. Company Market Share Analysis 2025
- 12.3.1 Top 5 Companies Market Share Analysis
- 12.3.2 Top 3 Companies Market Share Analysis
- 12.4. List of Potential Customers
- 13. Research Methodology
List of Figures
- Figure 1: Global UK Homeware Industry Revenue Breakdown (Million, %) by Region 2025 & 2033
- Figure 2: Global UK Homeware Industry Volume Breakdown (K Unit, %) by Region 2025 & 2033
- Figure 3: North America UK Homeware Industry Revenue (Million), by Product 2025 & 2033
- Figure 4: North America UK Homeware Industry Volume (K Unit), by Product 2025 & 2033
- Figure 5: North America UK Homeware Industry Revenue Share (%), by Product 2025 & 2033
- Figure 6: North America UK Homeware Industry Volume Share (%), by Product 2025 & 2033
- Figure 7: North America UK Homeware Industry Revenue (Million), by Distribution Channel 2025 & 2033
- Figure 8: North America UK Homeware Industry Volume (K Unit), by Distribution Channel 2025 & 2033
- Figure 9: North America UK Homeware Industry Revenue Share (%), by Distribution Channel 2025 & 2033
- Figure 10: North America UK Homeware Industry Volume Share (%), by Distribution Channel 2025 & 2033
- Figure 11: North America UK Homeware Industry Revenue (Million), by Country 2025 & 2033
- Figure 12: North America UK Homeware Industry Volume (K Unit), by Country 2025 & 2033
- Figure 13: North America UK Homeware Industry Revenue Share (%), by Country 2025 & 2033
- Figure 14: North America UK Homeware Industry Volume Share (%), by Country 2025 & 2033
- Figure 15: South America UK Homeware Industry Revenue (Million), by Product 2025 & 2033
- Figure 16: South America UK Homeware Industry Volume (K Unit), by Product 2025 & 2033
- Figure 17: South America UK Homeware Industry Revenue Share (%), by Product 2025 & 2033
- Figure 18: South America UK Homeware Industry Volume Share (%), by Product 2025 & 2033
- Figure 19: South America UK Homeware Industry Revenue (Million), by Distribution Channel 2025 & 2033
- Figure 20: South America UK Homeware Industry Volume (K Unit), by Distribution Channel 2025 & 2033
- Figure 21: South America UK Homeware Industry Revenue Share (%), by Distribution Channel 2025 & 2033
- Figure 22: South America UK Homeware Industry Volume Share (%), by Distribution Channel 2025 & 2033
- Figure 23: South America UK Homeware Industry Revenue (Million), by Country 2025 & 2033
- Figure 24: South America UK Homeware Industry Volume (K Unit), by Country 2025 & 2033
- Figure 25: South America UK Homeware Industry Revenue Share (%), by Country 2025 & 2033
- Figure 26: South America UK Homeware Industry Volume Share (%), by Country 2025 & 2033
- Figure 27: Europe UK Homeware Industry Revenue (Million), by Product 2025 & 2033
- Figure 28: Europe UK Homeware Industry Volume (K Unit), by Product 2025 & 2033
- Figure 29: Europe UK Homeware Industry Revenue Share (%), by Product 2025 & 2033
- Figure 30: Europe UK Homeware Industry Volume Share (%), by Product 2025 & 2033
- Figure 31: Europe UK Homeware Industry Revenue (Million), by Distribution Channel 2025 & 2033
- Figure 32: Europe UK Homeware Industry Volume (K Unit), by Distribution Channel 2025 & 2033
- Figure 33: Europe UK Homeware Industry Revenue Share (%), by Distribution Channel 2025 & 2033
- Figure 34: Europe UK Homeware Industry Volume Share (%), by Distribution Channel 2025 & 2033
- Figure 35: Europe UK Homeware Industry Revenue (Million), by Country 2025 & 2033
- Figure 36: Europe UK Homeware Industry Volume (K Unit), by Country 2025 & 2033
- Figure 37: Europe UK Homeware Industry Revenue Share (%), by Country 2025 & 2033
- Figure 38: Europe UK Homeware Industry Volume Share (%), by Country 2025 & 2033
- Figure 39: Middle East & Africa UK Homeware Industry Revenue (Million), by Product 2025 & 2033
- Figure 40: Middle East & Africa UK Homeware Industry Volume (K Unit), by Product 2025 & 2033
- Figure 41: Middle East & Africa UK Homeware Industry Revenue Share (%), by Product 2025 & 2033
- Figure 42: Middle East & Africa UK Homeware Industry Volume Share (%), by Product 2025 & 2033
- Figure 43: Middle East & Africa UK Homeware Industry Revenue (Million), by Distribution Channel 2025 & 2033
- Figure 44: Middle East & Africa UK Homeware Industry Volume (K Unit), by Distribution Channel 2025 & 2033
- Figure 45: Middle East & Africa UK Homeware Industry Revenue Share (%), by Distribution Channel 2025 & 2033
- Figure 46: Middle East & Africa UK Homeware Industry Volume Share (%), by Distribution Channel 2025 & 2033
- Figure 47: Middle East & Africa UK Homeware Industry Revenue (Million), by Country 2025 & 2033
- Figure 48: Middle East & Africa UK Homeware Industry Volume (K Unit), by Country 2025 & 2033
- Figure 49: Middle East & Africa UK Homeware Industry Revenue Share (%), by Country 2025 & 2033
- Figure 50: Middle East & Africa UK Homeware Industry Volume Share (%), by Country 2025 & 2033
- Figure 51: Asia Pacific UK Homeware Industry Revenue (Million), by Product 2025 & 2033
- Figure 52: Asia Pacific UK Homeware Industry Volume (K Unit), by Product 2025 & 2033
- Figure 53: Asia Pacific UK Homeware Industry Revenue Share (%), by Product 2025 & 2033
- Figure 54: Asia Pacific UK Homeware Industry Volume Share (%), by Product 2025 & 2033
- Figure 55: Asia Pacific UK Homeware Industry Revenue (Million), by Distribution Channel 2025 & 2033
- Figure 56: Asia Pacific UK Homeware Industry Volume (K Unit), by Distribution Channel 2025 & 2033
- Figure 57: Asia Pacific UK Homeware Industry Revenue Share (%), by Distribution Channel 2025 & 2033
- Figure 58: Asia Pacific UK Homeware Industry Volume Share (%), by Distribution Channel 2025 & 2033
- Figure 59: Asia Pacific UK Homeware Industry Revenue (Million), by Country 2025 & 2033
- Figure 60: Asia Pacific UK Homeware Industry Volume (K Unit), by Country 2025 & 2033
- Figure 61: Asia Pacific UK Homeware Industry Revenue Share (%), by Country 2025 & 2033
- Figure 62: Asia Pacific UK Homeware Industry Volume Share (%), by Country 2025 & 2033
List of Tables
- Table 1: Global UK Homeware Industry Revenue Million Forecast, by Product 2020 & 2033
- Table 2: Global UK Homeware Industry Volume K Unit Forecast, by Product 2020 & 2033
- Table 3: Global UK Homeware Industry Revenue Million Forecast, by Distribution Channel 2020 & 2033
- Table 4: Global UK Homeware Industry Volume K Unit Forecast, by Distribution Channel 2020 & 2033
- Table 5: Global UK Homeware Industry Revenue Million Forecast, by Region 2020 & 2033
- Table 6: Global UK Homeware Industry Volume K Unit Forecast, by Region 2020 & 2033
- Table 7: Global UK Homeware Industry Revenue Million Forecast, by Product 2020 & 2033
- Table 8: Global UK Homeware Industry Volume K Unit Forecast, by Product 2020 & 2033
- Table 9: Global UK Homeware Industry Revenue Million Forecast, by Distribution Channel 2020 & 2033
- Table 10: Global UK Homeware Industry Volume K Unit Forecast, by Distribution Channel 2020 & 2033
- Table 11: Global UK Homeware Industry Revenue Million Forecast, by Country 2020 & 2033
- Table 12: Global UK Homeware Industry Volume K Unit Forecast, by Country 2020 & 2033
- Table 13: United States UK Homeware Industry Revenue (Million) Forecast, by Application 2020 & 2033
- Table 14: United States UK Homeware Industry Volume (K Unit) Forecast, by Application 2020 & 2033
- Table 15: Canada UK Homeware Industry Revenue (Million) Forecast, by Application 2020 & 2033
- Table 16: Canada UK Homeware Industry Volume (K Unit) Forecast, by Application 2020 & 2033
- Table 17: Mexico UK Homeware Industry Revenue (Million) Forecast, by Application 2020 & 2033
- Table 18: Mexico UK Homeware Industry Volume (K Unit) Forecast, by Application 2020 & 2033
- Table 19: Global UK Homeware Industry Revenue Million Forecast, by Product 2020 & 2033
- Table 20: Global UK Homeware Industry Volume K Unit Forecast, by Product 2020 & 2033
- Table 21: Global UK Homeware Industry Revenue Million Forecast, by Distribution Channel 2020 & 2033
- Table 22: Global UK Homeware Industry Volume K Unit Forecast, by Distribution Channel 2020 & 2033
- Table 23: Global UK Homeware Industry Revenue Million Forecast, by Country 2020 & 2033
- Table 24: Global UK Homeware Industry Volume K Unit Forecast, by Country 2020 & 2033
- Table 25: Brazil UK Homeware Industry Revenue (Million) Forecast, by Application 2020 & 2033
- Table 26: Brazil UK Homeware Industry Volume (K Unit) Forecast, by Application 2020 & 2033
- Table 27: Argentina UK Homeware Industry Revenue (Million) Forecast, by Application 2020 & 2033
- Table 28: Argentina UK Homeware Industry Volume (K Unit) Forecast, by Application 2020 & 2033
- Table 29: Rest of South America UK Homeware Industry Revenue (Million) Forecast, by Application 2020 & 2033
- Table 30: Rest of South America UK Homeware Industry Volume (K Unit) Forecast, by Application 2020 & 2033
- Table 31: Global UK Homeware Industry Revenue Million Forecast, by Product 2020 & 2033
- Table 32: Global UK Homeware Industry Volume K Unit Forecast, by Product 2020 & 2033
- Table 33: Global UK Homeware Industry Revenue Million Forecast, by Distribution Channel 2020 & 2033
- Table 34: Global UK Homeware Industry Volume K Unit Forecast, by Distribution Channel 2020 & 2033
- Table 35: Global UK Homeware Industry Revenue Million Forecast, by Country 2020 & 2033
- Table 36: Global UK Homeware Industry Volume K Unit Forecast, by Country 2020 & 2033
- Table 37: United Kingdom UK Homeware Industry Revenue (Million) Forecast, by Application 2020 & 2033
- Table 38: United Kingdom UK Homeware Industry Volume (K Unit) Forecast, by Application 2020 & 2033
- Table 39: Germany UK Homeware Industry Revenue (Million) Forecast, by Application 2020 & 2033
- Table 40: Germany UK Homeware Industry Volume (K Unit) Forecast, by Application 2020 & 2033
- Table 41: France UK Homeware Industry Revenue (Million) Forecast, by Application 2020 & 2033
- Table 42: France UK Homeware Industry Volume (K Unit) Forecast, by Application 2020 & 2033
- Table 43: Italy UK Homeware Industry Revenue (Million) Forecast, by Application 2020 & 2033
- Table 44: Italy UK Homeware Industry Volume (K Unit) Forecast, by Application 2020 & 2033
- Table 45: Spain UK Homeware Industry Revenue (Million) Forecast, by Application 2020 & 2033
- Table 46: Spain UK Homeware Industry Volume (K Unit) Forecast, by Application 2020 & 2033
- Table 47: Russia UK Homeware Industry Revenue (Million) Forecast, by Application 2020 & 2033
- Table 48: Russia UK Homeware Industry Volume (K Unit) Forecast, by Application 2020 & 2033
- Table 49: Benelux UK Homeware Industry Revenue (Million) Forecast, by Application 2020 & 2033
- Table 50: Benelux UK Homeware Industry Volume (K Unit) Forecast, by Application 2020 & 2033
- Table 51: Nordics UK Homeware Industry Revenue (Million) Forecast, by Application 2020 & 2033
- Table 52: Nordics UK Homeware Industry Volume (K Unit) Forecast, by Application 2020 & 2033
- Table 53: Rest of Europe UK Homeware Industry Revenue (Million) Forecast, by Application 2020 & 2033
- Table 54: Rest of Europe UK Homeware Industry Volume (K Unit) Forecast, by Application 2020 & 2033
- Table 55: Global UK Homeware Industry Revenue Million Forecast, by Product 2020 & 2033
- Table 56: Global UK Homeware Industry Volume K Unit Forecast, by Product 2020 & 2033
- Table 57: Global UK Homeware Industry Revenue Million Forecast, by Distribution Channel 2020 & 2033
- Table 58: Global UK Homeware Industry Volume K Unit Forecast, by Distribution Channel 2020 & 2033
- Table 59: Global UK Homeware Industry Revenue Million Forecast, by Country 2020 & 2033
- Table 60: Global UK Homeware Industry Volume K Unit Forecast, by Country 2020 & 2033
- Table 61: Turkey UK Homeware Industry Revenue (Million) Forecast, by Application 2020 & 2033
- Table 62: Turkey UK Homeware Industry Volume (K Unit) Forecast, by Application 2020 & 2033
- Table 63: Israel UK Homeware Industry Revenue (Million) Forecast, by Application 2020 & 2033
- Table 64: Israel UK Homeware Industry Volume (K Unit) Forecast, by Application 2020 & 2033
- Table 65: GCC UK Homeware Industry Revenue (Million) Forecast, by Application 2020 & 2033
- Table 66: GCC UK Homeware Industry Volume (K Unit) Forecast, by Application 2020 & 2033
- Table 67: North Africa UK Homeware Industry Revenue (Million) Forecast, by Application 2020 & 2033
- Table 68: North Africa UK Homeware Industry Volume (K Unit) Forecast, by Application 2020 & 2033
- Table 69: South Africa UK Homeware Industry Revenue (Million) Forecast, by Application 2020 & 2033
- Table 70: South Africa UK Homeware Industry Volume (K Unit) Forecast, by Application 2020 & 2033
- Table 71: Rest of Middle East & Africa UK Homeware Industry Revenue (Million) Forecast, by Application 2020 & 2033
- Table 72: Rest of Middle East & Africa UK Homeware Industry Volume (K Unit) Forecast, by Application 2020 & 2033
- Table 73: Global UK Homeware Industry Revenue Million Forecast, by Product 2020 & 2033
- Table 74: Global UK Homeware Industry Volume K Unit Forecast, by Product 2020 & 2033
- Table 75: Global UK Homeware Industry Revenue Million Forecast, by Distribution Channel 2020 & 2033
- Table 76: Global UK Homeware Industry Volume K Unit Forecast, by Distribution Channel 2020 & 2033
- Table 77: Global UK Homeware Industry Revenue Million Forecast, by Country 2020 & 2033
- Table 78: Global UK Homeware Industry Volume K Unit Forecast, by Country 2020 & 2033
- Table 79: China UK Homeware Industry Revenue (Million) Forecast, by Application 2020 & 2033
- Table 80: China UK Homeware Industry Volume (K Unit) Forecast, by Application 2020 & 2033
- Table 81: India UK Homeware Industry Revenue (Million) Forecast, by Application 2020 & 2033
- Table 82: India UK Homeware Industry Volume (K Unit) Forecast, by Application 2020 & 2033
- Table 83: Japan UK Homeware Industry Revenue (Million) Forecast, by Application 2020 & 2033
- Table 84: Japan UK Homeware Industry Volume (K Unit) Forecast, by Application 2020 & 2033
- Table 85: South Korea UK Homeware Industry Revenue (Million) Forecast, by Application 2020 & 2033
- Table 86: South Korea UK Homeware Industry Volume (K Unit) Forecast, by Application 2020 & 2033
- Table 87: ASEAN UK Homeware Industry Revenue (Million) Forecast, by Application 2020 & 2033
- Table 88: ASEAN UK Homeware Industry Volume (K Unit) Forecast, by Application 2020 & 2033
- Table 89: Oceania UK Homeware Industry Revenue (Million) Forecast, by Application 2020 & 2033
- Table 90: Oceania UK Homeware Industry Volume (K Unit) Forecast, by Application 2020 & 2033
- Table 91: Rest of Asia Pacific UK Homeware Industry Revenue (Million) Forecast, by Application 2020 & 2033
- Table 92: Rest of Asia Pacific UK Homeware Industry Volume (K Unit) Forecast, by Application 2020 & 2033
Frequently Asked Questions
1. What is the projected Compound Annual Growth Rate (CAGR) of the UK Homeware Industry?
The projected CAGR is approximately 4.17%.
2. Which companies are prominent players in the UK Homeware Industry?
Key companies in the market include Inter IKEA Group, Kitchen Craft, Bosch Group, Cuisinart, Dyson, Milliken, Bed Bath and Beyond UK, DFS Furniture PLC, Koninklijke Philips NV, Villeroy and Boch, Victoria PLC, Way Fair UK, Victoria PLC, Gerflor.
3. What are the main segments of the UK Homeware Industry?
The market segments include Product, Distribution Channel.
4. Can you provide details about the market size?
The market size is estimated to be USD 21.20 Million as of 2022.
5. What are some drivers contributing to market growth?
Increase in Restaurants and Food Chains globally; Rise in the share of people opting for vegan and vegetarian foods.
6. What are the notable trends driving market growth?
Increased Spending on Furniture and Appliances is Driving the Market's Growth.
7. Are there any restraints impacting market growth?
Rise in price of electric appliances globally; Rising inflation decreasing the purchasing power.
8. Can you provide examples of recent developments in the market?
October 2022: Victoria PLC, the United Kingdom-based flooring designer, manufacturer, and distributor, announced the acquisition of Florida-based International Wholesale Tile LLC (IWT).
9. What pricing options are available for accessing the report?
Pricing options include single-user, multi-user, and enterprise licenses priced at USD 3800, USD 4500, and USD 5800 respectively.
10. Is the market size provided in terms of value or volume?
The market size is provided in terms of value, measured in Million and volume, measured in K Unit.
11. Are there any specific market keywords associated with the report?
Yes, the market keyword associated with the report is "UK Homeware Industry," which aids in identifying and referencing the specific market segment covered.
12. How do I determine which pricing option suits my needs best?
The pricing options vary based on user requirements and access needs. Individual users may opt for single-user licenses, while businesses requiring broader access may choose multi-user or enterprise licenses for cost-effective access to the report.
13. Are there any additional resources or data provided in the UK Homeware Industry report?
While the report offers comprehensive insights, it's advisable to review the specific contents or supplementary materials provided to ascertain if additional resources or data are available.
14. How can I stay updated on further developments or reports in the UK Homeware Industry?
To stay informed about further developments, trends, and reports in the UK Homeware Industry, consider subscribing to industry newsletters, following relevant companies and organizations, or regularly checking reputable industry news sources and publications.
Methodology
Step 1 - Identification of Relevant Samples Size from Population Database


Step 2 - Approaches for Defining Global Market Size (Value, Volume* & Price*)

Note*: In applicable scenarios
Step 3 - Data Sources
Primary Research
- Web Analytics
- Survey Reports
- Research Institute
- Latest Research Reports
- Opinion Leaders
Secondary Research
- Annual Reports
- White Paper
- Latest Press Release
- Industry Association
- Paid Database
- Investor Presentations

Step 4 - Data Triangulation
Involves using different sources of information in order to increase the validity of a study
These sources are likely to be stakeholders in a program - participants, other researchers, program staff, other community members, and so on.
Then we put all data in single framework & apply various statistical tools to find out the dynamic on the market.
During the analysis stage, feedback from the stakeholder groups would be compared to determine areas of agreement as well as areas of divergence