

Key Insights
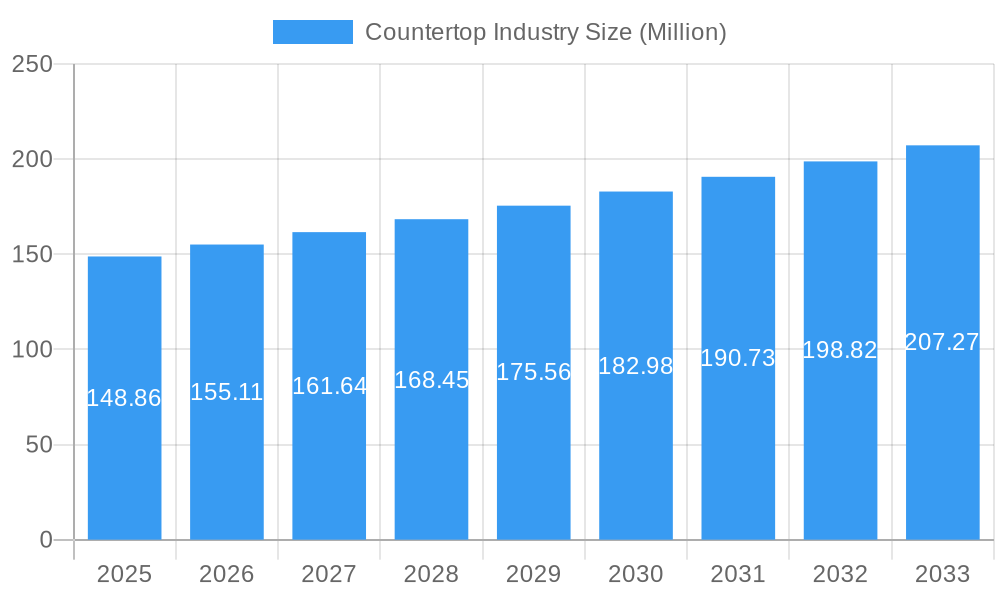
The global countertop market is poised for steady expansion, projected to reach a substantial USD 148.86 million with a Compound Annual Growth Rate (CAGR) of 4.22% from 2025 to 2033. This growth trajectory is underpinned by several key drivers, most notably the robust demand in the residential sector, fueled by increasing home renovation activities and a growing preference for aesthetically pleasing and durable kitchen and bathroom surfaces. The commercial segment also plays a significant role, driven by new construction projects and the refurbishment of hospitality, retail, and healthcare facilities. The popularity of quartz surfaces, renowned for their low maintenance, stain resistance, and wide array of design options, is a dominant trend, significantly influencing market dynamics. Granite continues to hold its ground as a premium and durable option, while solid surfaces and laminates offer more budget-friendly alternatives, catering to a diverse consumer base.
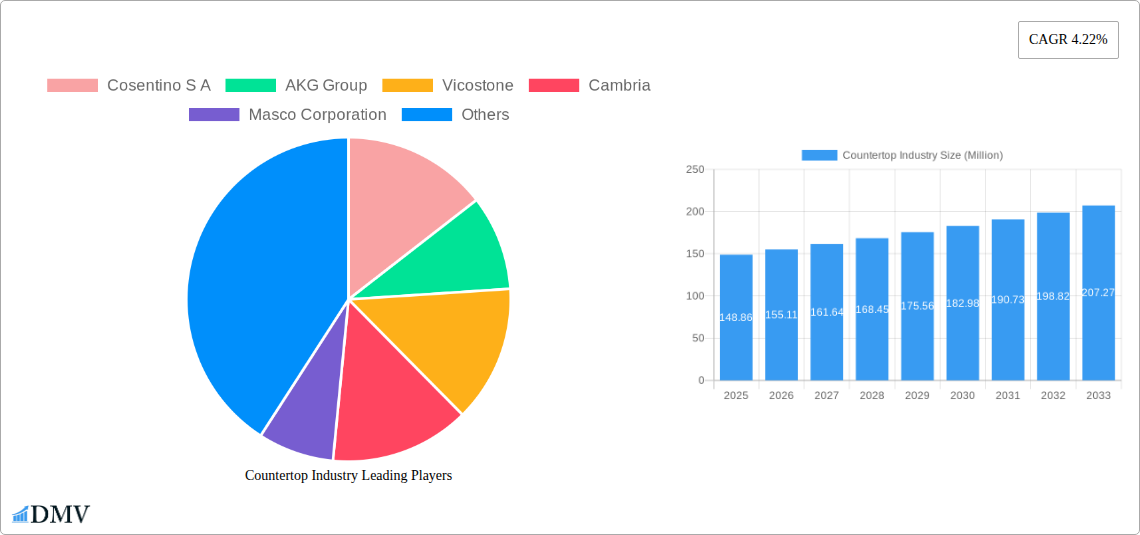
Countertop Industry Market Size (In Million)
Several factors contribute to the projected market expansion. The increasing disposable income in emerging economies, coupled with a rising awareness of interior design and home aesthetics, is spurring demand for high-quality countertops. Advancements in material science are leading to the development of more resilient, eco-friendly, and visually appealing countertop options, further stimulating consumer interest. While the market benefits from these positive trends, certain restraints, such as the fluctuating prices of raw materials and the labor-intensive nature of installation, could pose challenges. Geographically, North America and Europe are expected to remain dominant markets due to high consumer spending power and established renovation cycles. However, the Asia Pacific region is anticipated to witness the fastest growth, driven by rapid urbanization, a burgeoning middle class, and increasing investments in the construction and real estate sectors.
Countertop Industry Company Market Share
Unlocking the Future of Surfaces: A Comprehensive Countertop Industry Market Analysis (2019-2033)
Dive deep into the dynamic world of countertops with this in-depth market report. Spanning from 2019 to 2033, with a base year of 2025 and a comprehensive forecast period of 2025–2033, this analysis provides actionable insights into market composition, industry evolution, leading segments, product innovations, growth drivers, obstacles, opportunities, and the major players shaping the global countertop landscape. Whether you're a manufacturer, designer, investor, or homeowner, this report equips you with the essential knowledge to navigate and capitalize on the multi-million dollar countertop market.
Countertop Industry Market Composition & Trends
The global countertop market is characterized by a moderate level of concentration, with several key players dominating significant market share, estimated to be in the hundreds of millions of dollars. Innovation is a constant catalyst, driven by advancements in material science, design aesthetics, and manufacturing processes. Regulatory landscapes vary by region, impacting material sourcing, installation standards, and environmental compliance. Substitute products, such as stainless steel and concrete, present ongoing competition, necessitating continuous differentiation. End-user profiles are diversifying, with both residential and commercial sectors exhibiting distinct preferences and purchasing behaviors. Mergers and acquisitions (M&A) activities, with deal values reaching hundreds of millions, are shaping the competitive landscape, consolidating market power and expanding product portfolios.
- Market Concentration: Dominated by a few leading brands, with market share distribution showing significant regional and material-specific variations.
- Innovation Catalysts: Driven by material durability, aesthetic appeal, sustainability, and smart features.
- Regulatory Landscapes: Influenced by building codes, material safety standards, and environmental regulations.
- Substitute Products: Stainless steel, concrete, and wood offer alternatives, particularly in specific commercial or niche residential applications.
- End-User Profiles: Residential demand is driven by renovation and new construction, while commercial demand stems from hospitality, healthcare, and office spaces.
- M&A Activities: Strategic acquisitions aimed at expanding product lines, geographic reach, and technological capabilities, with significant financial transactions in the hundreds of millions.
Countertop Industry Industry Evolution
The countertop industry has witnessed remarkable evolution, transforming from purely functional surfaces to integral design elements. Market growth trajectories have been consistently upward, fueled by increasing disposable incomes, urbanization, and a growing emphasis on home renovation and interior design. Technological advancements have played a pivotal role, leading to the development of highly durable, aesthetically versatile, and low-maintenance materials like quartz surfaces. The adoption of these advanced materials, particularly quartz, has surged, capturing significant market share from traditional materials like granite and marble. Shifting consumer demands have been a constant influence, with a growing preference for personalized designs, eco-friendly options, and surfaces that offer enhanced hygiene and durability. This evolution is projected to continue, with the market projected to reach billions in value by the end of the forecast period, exhibiting a Compound Annual Growth Rate (CAGR) in the high single digits.
- Market Growth Trajectories: Consistent year-on-year growth, driven by global construction and renovation activities, with projected market value in the billions.
- Technological Advancements: Development of advanced manufacturing techniques for quartz, engineered stone, and solid surfaces, improving durability and design flexibility.
- Shifting Consumer Demands: Increasing preference for low-maintenance, hygienic, aesthetically diverse, and sustainable countertop solutions.
- Material Adoption Rates: Significant rise in quartz surface adoption, surpassing traditional materials in many residential and commercial applications.
- Impact of Digitalization: Growing influence of online platforms for design inspiration, product selection, and e-commerce.
Leading Regions, Countries, or Segments in Countertop Industry
North America currently stands as a dominant region in the global countertop industry, driven by robust residential construction, high disposable incomes, and a strong culture of home renovation. The United States, in particular, represents a significant market due to its large population and continuous demand for kitchen and bathroom upgrades. Within this region, Quartz Surfaces have emerged as the leading material segment, capturing an estimated XX% of the market value. This dominance is attributed to its superior durability, stain resistance, non-porous nature, and an extensive range of design options that mimic natural stone. The Residential end-user segment is the primary driver of demand, accounting for an estimated XX% of the market. Kitchen countertops represent the largest application type, followed closely by bathrooms. Key drivers of this dominance include substantial investment trends in home improvement, supportive regulatory frameworks for construction and renovation, and aggressive marketing by leading brands like Cambria and Caesarstone.
- Dominant Region: North America, with the United States leading market expenditure.
- Key Drivers: High disposable incomes, extensive home renovation activities, strong new construction markets.
- Investment Trends: Significant capital deployment in R&D for new material formulations and advanced manufacturing.
- Regulatory Support: Favorable building codes and standards promoting quality and safety in construction.
- Leading Material Segment: Quartz Surfaces.
- Market Share: Estimated to hold over XX% of the global market value.
- Growth Factors: Exceptional durability, resistance to stains and scratches, vast aesthetic versatility, hygienic properties.
- Technological Advancements: Ongoing innovation in quartz manufacturing to create more realistic natural stone appearances and unique patterns.
- Dominant End-User Segment: Residential.
- Contribution: Accounts for approximately XX% of overall market demand.
- Influencing Factors: Homeowner focus on aesthetics, functionality, and increasing property values.
- Demand Drivers: Kitchen and bathroom remodels, new home construction, and upgrades in existing properties.
- Leading Application Type: Kitchen Countertops.
- Market Significance: The primary application, representing a substantial portion of countertop sales.
- Consumer Preferences: Emphasis on aesthetics, durability, ease of maintenance, and integration with kitchen design trends.
Countertop Industry Product Innovations
The countertop industry is abuzz with innovation, focused on enhancing durability, aesthetics, and functionality. New product developments are increasingly emphasizing eco-friendly materials and manufacturing processes. Advanced engineered surfaces now offer superior scratch and stain resistance, rivaling or exceeding natural stone. Antimicrobial properties are being integrated into solid surfaces and quartz, catering to health-conscious consumers and commercial settings. Designers are pushing boundaries with unique textures, patterns, and color palettes, including advanced digital printing techniques that create highly customizable designs. Performance metrics such as impact resistance, thermal shock resistance, and UV stability are continuously being improved, ensuring longevity and aesthetic appeal for a wide range of applications, from high-traffic kitchens to demanding commercial environments.
Propelling Factors for Countertop Industry Growth
Several key factors are propelling the growth of the countertop industry. Technologically, the refinement of quartz manufacturing processes has led to more aesthetically pleasing, durable, and cost-effective surfaces. Economically, rising global construction and renovation spending, coupled with increasing disposable incomes, fuels demand. Regulatory environments, while sometimes a hurdle, also drive innovation towards safer and more sustainable materials. Furthermore, the growing trend towards smart homes is opening avenues for integrated countertop solutions with embedded technology. The increasing emphasis on interior design and personalized living spaces also significantly boosts demand for a wide array of countertop materials and styles.
- Technological Advancements: Improved manufacturing of quartz, engineered stone, and solid surfaces for enhanced durability and aesthetics.
- Economic Growth: Rising disposable incomes and global construction/renovation spending.
- Consumer Trends: Growing preference for home aesthetics, customization, and long-lasting materials.
- Smart Home Integration: Emerging demand for countertops with embedded technology and smart features.
Obstacles in the Countertop Industry Market
Despite robust growth, the countertop industry faces several obstacles. Supply chain disruptions, particularly for raw materials and global logistics, can lead to increased costs and lead times. Intense competitive pressures among established brands and the emergence of new entrants can impact pricing and profit margins. Stringent regulatory compliance in various regions regarding material sourcing, environmental impact, and worker safety adds complexity and cost. Furthermore, the inherent cost associated with premium materials like quartz and granite can be a barrier for some consumers, driving demand towards more budget-friendly laminate options, creating a segment-specific challenge. Fluctuations in raw material prices also pose a continuous threat to profit stability.
- Supply Chain Volatility: Disruptions in raw material availability and global shipping impacting production and delivery timelines.
- Intense Competition: Price wars and market saturation among numerous manufacturers and fabricators.
- Regulatory Hurdles: Navigating diverse and evolving environmental, safety, and building code regulations across different markets.
- Economic Sensitivity: Vulnerability to economic downturns impacting consumer spending on home improvement and construction.
Future Opportunities in Countertop Industry
The countertop industry is ripe with future opportunities. The burgeoning demand for sustainable and eco-friendly materials presents a significant avenue for growth, encouraging the development of recycled content and low-VOC (Volatile Organic Compound) products. Emerging markets in developing economies offer untapped potential as urbanization and rising living standards increase demand for home renovation. Technological advancements in digital printing and material fusion are paving the way for highly personalized and unique countertop designs. Furthermore, the increasing focus on hygiene and health in both residential and commercial spaces creates opportunities for antimicrobial and easy-to-clean surface solutions. The integration of smart technologies into countertops, such as wireless charging and integrated lighting, also represents a promising frontier.
- Sustainable Materials: Growing demand for eco-friendly, recycled, and low-VOC countertop options.
- Emerging Markets: Untapped potential in developing economies with rising disposable incomes and urbanization.
- Personalization & Customization: Advanced digital printing and manufacturing techniques enabling bespoke designs.
- Hygiene & Health Focus: Opportunities in antimicrobial surfaces for residential and commercial applications.
- Smart Countertop Integration: Incorporating technology like wireless charging and interactive displays.
Major Players in the Countertop Industry Ecosystem
- Cosentino S A
- AKG Group
- Vicostone
- Cambria
- Masco Corporation
- ROSSKOPF + PARTNER AG
- DuPont de Nemours Inc
- ARISTECH SURFACES LLC
- STRASSER Steine GmbH
- Caesarstone Ltd
- Daltile
- Wilsonart LLC
- Asian Granito India Limited
- Pokarna Ltd
- Aro Granite Industries Ltd
Key Developments in Countertop Industry Industry
- August 2022: Wilsonart LLC received a Kitchen & Bath Business (KBB) magazine's 2022 Readers' Choice Award for the second consecutive year as the top kitchen countertop brand.
- February 2022: Caesarstone Ltd. launched eight new nature-inspired surfaces, including the Pebbles Collection, at the Kitchen & Bath Industry Show (KBIS).
- January 2022: Cambria introduced four new colors – Inverness Cobalt, Inverness Platinum, Inverness Gold, and Inverness Bronze – to its Design Palette.
Strategic Countertop Industry Market Forecast
The strategic countertop market forecast indicates continued robust growth, driven by sustained demand for aesthetically pleasing, durable, and functional surfaces. The dominance of quartz surfaces is expected to persist, with ongoing innovations in design and performance further solidifying its market position. Emerging opportunities in sustainable materials and smart countertop integration will likely shape future product development and market expansion. The residential renovation and remodeling sector will remain a significant growth catalyst, while commercial applications are poised for expansion, particularly in hospitality and healthcare. Strategic investments in research and development, coupled with effective marketing strategies targeting evolving consumer preferences, will be crucial for players to capitalize on the projected market potential, which is estimated to reach tens of billions of dollars by the end of the forecast period.
Countertop Industry Segmentation
-
1. Material
- 1.1. Granite
- 1.2. Solid Surface
- 1.3. Laminate
- 1.4. Marble
- 1.5. Quartz Surfaces
- 1.6. Other Materials
-
2. End User
- 2.1. Residential
- 2.2. Commercial
-
3. Type
- 3.1. Kitchen
- 3.2. Bathroom
- 3.3. Other Types
Countertop Industry Segmentation By Geography
- 1. North America
- 2. Europe
- 3. Asia Pacific
- 4. Latin America
- 5. Middle East and Africa
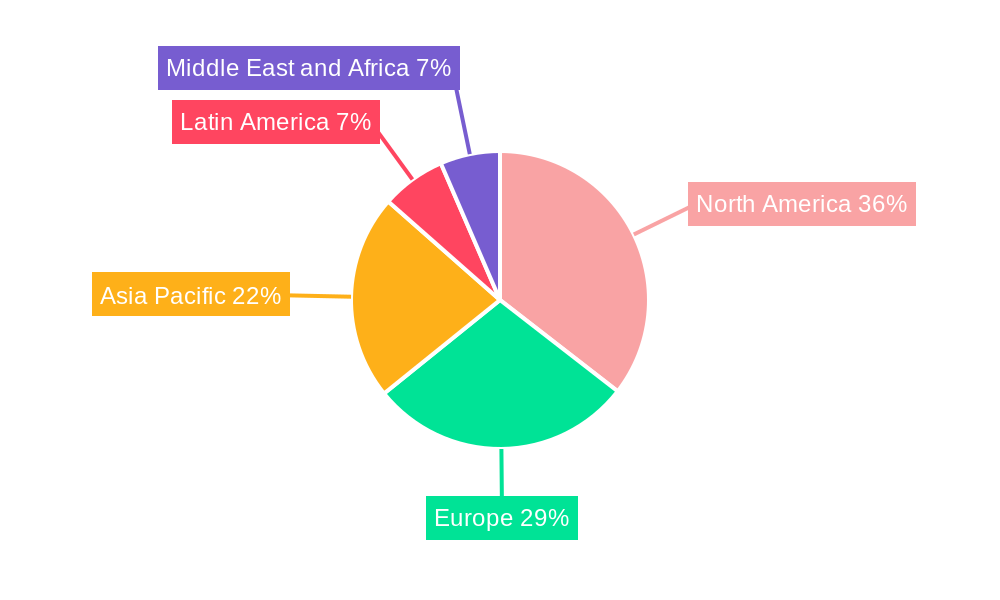
Countertop Industry Regional Market Share
Geographic Coverage of Countertop Industry
Countertop Industry REPORT HIGHLIGHTS
| Aspects | Details |
|---|---|
| Study Period | 2020-2034 |
| Base Year | 2025 |
| Estimated Year | 2026 |
| Forecast Period | 2026-2034 |
| Historical Period | 2020-2025 |
| Growth Rate | CAGR of 4.22% from 2020-2034 |
| Segmentation |
|
Table of Contents
- 1. Introduction
- 1.1. Research Scope
- 1.2. Market Segmentation
- 1.3. Research Objective
- 1.4. Definitions and Assumptions
- 2. Executive Summary
- 2.1. Market Snapshot
- 3. Market Dynamics
- 3.1. Market Drivers
- 3.2. Market Restrains
- 3.3. Market Trends
- 3.4. Market Opportunities
- 4. Market Factor Analysis
- 4.1. Porters Five Forces
- 4.1.1. Bargaining Power of Suppliers
- 4.1.2. Bargaining Power of Buyers
- 4.1.3. Threat of New Entrants
- 4.1.4. Threat of Substitutes
- 4.1.5. Competitive Rivalry
- 4.2. PESTEL analysis
- 4.3. BCG Analysis
- 4.3.1. Stars (High Growth, High Market Share)
- 4.3.2. Cash Cows (Low Growth, High Market Share)
- 4.3.3. Question Mark (High Growth, Low Market Share)
- 4.3.4. Dogs (Low Growth, Low Market Share)
- 4.4. Ansoff Matrix Analysis
- 4.5. Supply Chain Analysis
- 4.6. Regulatory Landscape
- 4.7. Current Market Potential and Opportunity Assessment (TAM–SAM–SOM Framework)
- 4.8. DMV Analyst Note
- 4.1. Porters Five Forces
- 5. Market Analysis, Insights and Forecast 2021-2033
- 5.1. Market Analysis, Insights and Forecast - by Material
- 5.1.1. Granite
- 5.1.2. Solid Surface
- 5.1.3. Laminate
- 5.1.4. Marble
- 5.1.5. Quartz Surfaces
- 5.1.6. Other Materials
- 5.2. Market Analysis, Insights and Forecast - by End User
- 5.2.1. Residential
- 5.2.2. Commercial
- 5.3. Market Analysis, Insights and Forecast - by Type
- 5.3.1. Kitchen
- 5.3.2. Bathroom
- 5.3.3. Other Types
- 5.4. Market Analysis, Insights and Forecast - by Region
- 5.4.1. North America
- 5.4.2. Europe
- 5.4.3. Asia Pacific
- 5.4.4. Latin America
- 5.4.5. Middle East and Africa
- 5.1. Market Analysis, Insights and Forecast - by Material
- 6. Global Countertop Industry Analysis, Insights and Forecast, 2021-2033
- 6.1. Market Analysis, Insights and Forecast - by Material
- 6.1.1. Granite
- 6.1.2. Solid Surface
- 6.1.3. Laminate
- 6.1.4. Marble
- 6.1.5. Quartz Surfaces
- 6.1.6. Other Materials
- 6.2. Market Analysis, Insights and Forecast - by End User
- 6.2.1. Residential
- 6.2.2. Commercial
- 6.3. Market Analysis, Insights and Forecast - by Type
- 6.3.1. Kitchen
- 6.3.2. Bathroom
- 6.3.3. Other Types
- 6.1. Market Analysis, Insights and Forecast - by Material
- 7. North America Countertop Industry Analysis, Insights and Forecast, 2020-2032
- 7.1. Market Analysis, Insights and Forecast - by Material
- 7.1.1. Granite
- 7.1.2. Solid Surface
- 7.1.3. Laminate
- 7.1.4. Marble
- 7.1.5. Quartz Surfaces
- 7.1.6. Other Materials
- 7.2. Market Analysis, Insights and Forecast - by End User
- 7.2.1. Residential
- 7.2.2. Commercial
- 7.3. Market Analysis, Insights and Forecast - by Type
- 7.3.1. Kitchen
- 7.3.2. Bathroom
- 7.3.3. Other Types
- 7.1. Market Analysis, Insights and Forecast - by Material
- 8. Europe Countertop Industry Analysis, Insights and Forecast, 2020-2032
- 8.1. Market Analysis, Insights and Forecast - by Material
- 8.1.1. Granite
- 8.1.2. Solid Surface
- 8.1.3. Laminate
- 8.1.4. Marble
- 8.1.5. Quartz Surfaces
- 8.1.6. Other Materials
- 8.2. Market Analysis, Insights and Forecast - by End User
- 8.2.1. Residential
- 8.2.2. Commercial
- 8.3. Market Analysis, Insights and Forecast - by Type
- 8.3.1. Kitchen
- 8.3.2. Bathroom
- 8.3.3. Other Types
- 8.1. Market Analysis, Insights and Forecast - by Material
- 9. Asia Pacific Countertop Industry Analysis, Insights and Forecast, 2020-2032
- 9.1. Market Analysis, Insights and Forecast - by Material
- 9.1.1. Granite
- 9.1.2. Solid Surface
- 9.1.3. Laminate
- 9.1.4. Marble
- 9.1.5. Quartz Surfaces
- 9.1.6. Other Materials
- 9.2. Market Analysis, Insights and Forecast - by End User
- 9.2.1. Residential
- 9.2.2. Commercial
- 9.3. Market Analysis, Insights and Forecast - by Type
- 9.3.1. Kitchen
- 9.3.2. Bathroom
- 9.3.3. Other Types
- 9.1. Market Analysis, Insights and Forecast - by Material
- 10. Latin America Countertop Industry Analysis, Insights and Forecast, 2020-2032
- 10.1. Market Analysis, Insights and Forecast - by Material
- 10.1.1. Granite
- 10.1.2. Solid Surface
- 10.1.3. Laminate
- 10.1.4. Marble
- 10.1.5. Quartz Surfaces
- 10.1.6. Other Materials
- 10.2. Market Analysis, Insights and Forecast - by End User
- 10.2.1. Residential
- 10.2.2. Commercial
- 10.3. Market Analysis, Insights and Forecast - by Type
- 10.3.1. Kitchen
- 10.3.2. Bathroom
- 10.3.3. Other Types
- 10.1. Market Analysis, Insights and Forecast - by Material
- 11. Middle East and Africa Countertop Industry Analysis, Insights and Forecast, 2020-2032
- 11.1. Market Analysis, Insights and Forecast - by Material
- 11.1.1. Granite
- 11.1.2. Solid Surface
- 11.1.3. Laminate
- 11.1.4. Marble
- 11.1.5. Quartz Surfaces
- 11.1.6. Other Materials
- 11.2. Market Analysis, Insights and Forecast - by End User
- 11.2.1. Residential
- 11.2.2. Commercial
- 11.3. Market Analysis, Insights and Forecast - by Type
- 11.3.1. Kitchen
- 11.3.2. Bathroom
- 11.3.3. Other Types
- 11.1. Market Analysis, Insights and Forecast - by Material
- 12. Competitive Analysis
- 12.1. Company Profiles
- 12.1.1 Cosentino S A
- 12.1.1.1. Company Overview
- 12.1.1.2. Products
- 12.1.1.3. Company Financials
- 12.1.1.4. SWOT Analysis
- 12.1.2 AKG Group
- 12.1.2.1. Company Overview
- 12.1.2.2. Products
- 12.1.2.3. Company Financials
- 12.1.2.4. SWOT Analysis
- 12.1.3 Vicostone
- 12.1.3.1. Company Overview
- 12.1.3.2. Products
- 12.1.3.3. Company Financials
- 12.1.3.4. SWOT Analysis
- 12.1.4 Cambria
- 12.1.4.1. Company Overview
- 12.1.4.2. Products
- 12.1.4.3. Company Financials
- 12.1.4.4. SWOT Analysis
- 12.1.5 Masco Corporation
- 12.1.5.1. Company Overview
- 12.1.5.2. Products
- 12.1.5.3. Company Financials
- 12.1.5.4. SWOT Analysis
- 12.1.6 ROSSKOPF + PARTNER AG
- 12.1.6.1. Company Overview
- 12.1.6.2. Products
- 12.1.6.3. Company Financials
- 12.1.6.4. SWOT Analysis
- 12.1.7 DuPont de Nemours Inc
- 12.1.7.1. Company Overview
- 12.1.7.2. Products
- 12.1.7.3. Company Financials
- 12.1.7.4. SWOT Analysis
- 12.1.8 ARISTECH SURFACES LLC
- 12.1.8.1. Company Overview
- 12.1.8.2. Products
- 12.1.8.3. Company Financials
- 12.1.8.4. SWOT Analysis
- 12.1.9 STRASSER Steine GmbH
- 12.1.9.1. Company Overview
- 12.1.9.2. Products
- 12.1.9.3. Company Financials
- 12.1.9.4. SWOT Analysis
- 12.1.10 Caesarstone Ltd
- 12.1.10.1. Company Overview
- 12.1.10.2. Products
- 12.1.10.3. Company Financials
- 12.1.10.4. SWOT Analysis
- 12.1.11 Daltile
- 12.1.11.1. Company Overview
- 12.1.11.2. Products
- 12.1.11.3. Company Financials
- 12.1.11.4. SWOT Analysis
- 12.1.12 Wilsonart LLC
- 12.1.12.1. Company Overview
- 12.1.12.2. Products
- 12.1.12.3. Company Financials
- 12.1.12.4. SWOT Analysis
- 12.1.13 Asian Granito India Limited
- 12.1.13.1. Company Overview
- 12.1.13.2. Products
- 12.1.13.3. Company Financials
- 12.1.13.4. SWOT Analysis
- 12.1.14 Pokarna Ltd
- 12.1.14.1. Company Overview
- 12.1.14.2. Products
- 12.1.14.3. Company Financials
- 12.1.14.4. SWOT Analysis
- 12.1.15 Aro Granite Industries Ltd
- 12.1.15.1. Company Overview
- 12.1.15.2. Products
- 12.1.15.3. Company Financials
- 12.1.15.4. SWOT Analysis
- 12.1.1 Cosentino S A
- 12.2. Market Entropy
- 12.2.1 Company's Key Areas Served
- 12.2.2 Recent Developments
- 12.3. Company Market Share Analysis 2025
- 12.3.1 Top 5 Companies Market Share Analysis
- 12.3.2 Top 3 Companies Market Share Analysis
- 12.4. List of Potential Customers
- 13. Research Methodology
List of Figures
- Figure 1: Global Countertop Industry Revenue Breakdown (Million, %) by Region 2025 & 2033
- Figure 2: Global Countertop Industry Volume Breakdown (K Unit, %) by Region 2025 & 2033
- Figure 3: North America Countertop Industry Revenue (Million), by Material 2025 & 2033
- Figure 4: North America Countertop Industry Volume (K Unit), by Material 2025 & 2033
- Figure 5: North America Countertop Industry Revenue Share (%), by Material 2025 & 2033
- Figure 6: North America Countertop Industry Volume Share (%), by Material 2025 & 2033
- Figure 7: North America Countertop Industry Revenue (Million), by End User 2025 & 2033
- Figure 8: North America Countertop Industry Volume (K Unit), by End User 2025 & 2033
- Figure 9: North America Countertop Industry Revenue Share (%), by End User 2025 & 2033
- Figure 10: North America Countertop Industry Volume Share (%), by End User 2025 & 2033
- Figure 11: North America Countertop Industry Revenue (Million), by Type 2025 & 2033
- Figure 12: North America Countertop Industry Volume (K Unit), by Type 2025 & 2033
- Figure 13: North America Countertop Industry Revenue Share (%), by Type 2025 & 2033
- Figure 14: North America Countertop Industry Volume Share (%), by Type 2025 & 2033
- Figure 15: North America Countertop Industry Revenue (Million), by Country 2025 & 2033
- Figure 16: North America Countertop Industry Volume (K Unit), by Country 2025 & 2033
- Figure 17: North America Countertop Industry Revenue Share (%), by Country 2025 & 2033
- Figure 18: North America Countertop Industry Volume Share (%), by Country 2025 & 2033
- Figure 19: Europe Countertop Industry Revenue (Million), by Material 2025 & 2033
- Figure 20: Europe Countertop Industry Volume (K Unit), by Material 2025 & 2033
- Figure 21: Europe Countertop Industry Revenue Share (%), by Material 2025 & 2033
- Figure 22: Europe Countertop Industry Volume Share (%), by Material 2025 & 2033
- Figure 23: Europe Countertop Industry Revenue (Million), by End User 2025 & 2033
- Figure 24: Europe Countertop Industry Volume (K Unit), by End User 2025 & 2033
- Figure 25: Europe Countertop Industry Revenue Share (%), by End User 2025 & 2033
- Figure 26: Europe Countertop Industry Volume Share (%), by End User 2025 & 2033
- Figure 27: Europe Countertop Industry Revenue (Million), by Type 2025 & 2033
- Figure 28: Europe Countertop Industry Volume (K Unit), by Type 2025 & 2033
- Figure 29: Europe Countertop Industry Revenue Share (%), by Type 2025 & 2033
- Figure 30: Europe Countertop Industry Volume Share (%), by Type 2025 & 2033
- Figure 31: Europe Countertop Industry Revenue (Million), by Country 2025 & 2033
- Figure 32: Europe Countertop Industry Volume (K Unit), by Country 2025 & 2033
- Figure 33: Europe Countertop Industry Revenue Share (%), by Country 2025 & 2033
- Figure 34: Europe Countertop Industry Volume Share (%), by Country 2025 & 2033
- Figure 35: Asia Pacific Countertop Industry Revenue (Million), by Material 2025 & 2033
- Figure 36: Asia Pacific Countertop Industry Volume (K Unit), by Material 2025 & 2033
- Figure 37: Asia Pacific Countertop Industry Revenue Share (%), by Material 2025 & 2033
- Figure 38: Asia Pacific Countertop Industry Volume Share (%), by Material 2025 & 2033
- Figure 39: Asia Pacific Countertop Industry Revenue (Million), by End User 2025 & 2033
- Figure 40: Asia Pacific Countertop Industry Volume (K Unit), by End User 2025 & 2033
- Figure 41: Asia Pacific Countertop Industry Revenue Share (%), by End User 2025 & 2033
- Figure 42: Asia Pacific Countertop Industry Volume Share (%), by End User 2025 & 2033
- Figure 43: Asia Pacific Countertop Industry Revenue (Million), by Type 2025 & 2033
- Figure 44: Asia Pacific Countertop Industry Volume (K Unit), by Type 2025 & 2033
- Figure 45: Asia Pacific Countertop Industry Revenue Share (%), by Type 2025 & 2033
- Figure 46: Asia Pacific Countertop Industry Volume Share (%), by Type 2025 & 2033
- Figure 47: Asia Pacific Countertop Industry Revenue (Million), by Country 2025 & 2033
- Figure 48: Asia Pacific Countertop Industry Volume (K Unit), by Country 2025 & 2033
- Figure 49: Asia Pacific Countertop Industry Revenue Share (%), by Country 2025 & 2033
- Figure 50: Asia Pacific Countertop Industry Volume Share (%), by Country 2025 & 2033
- Figure 51: Latin America Countertop Industry Revenue (Million), by Material 2025 & 2033
- Figure 52: Latin America Countertop Industry Volume (K Unit), by Material 2025 & 2033
- Figure 53: Latin America Countertop Industry Revenue Share (%), by Material 2025 & 2033
- Figure 54: Latin America Countertop Industry Volume Share (%), by Material 2025 & 2033
- Figure 55: Latin America Countertop Industry Revenue (Million), by End User 2025 & 2033
- Figure 56: Latin America Countertop Industry Volume (K Unit), by End User 2025 & 2033
- Figure 57: Latin America Countertop Industry Revenue Share (%), by End User 2025 & 2033
- Figure 58: Latin America Countertop Industry Volume Share (%), by End User 2025 & 2033
- Figure 59: Latin America Countertop Industry Revenue (Million), by Type 2025 & 2033
- Figure 60: Latin America Countertop Industry Volume (K Unit), by Type 2025 & 2033
- Figure 61: Latin America Countertop Industry Revenue Share (%), by Type 2025 & 2033
- Figure 62: Latin America Countertop Industry Volume Share (%), by Type 2025 & 2033
- Figure 63: Latin America Countertop Industry Revenue (Million), by Country 2025 & 2033
- Figure 64: Latin America Countertop Industry Volume (K Unit), by Country 2025 & 2033
- Figure 65: Latin America Countertop Industry Revenue Share (%), by Country 2025 & 2033
- Figure 66: Latin America Countertop Industry Volume Share (%), by Country 2025 & 2033
- Figure 67: Middle East and Africa Countertop Industry Revenue (Million), by Material 2025 & 2033
- Figure 68: Middle East and Africa Countertop Industry Volume (K Unit), by Material 2025 & 2033
- Figure 69: Middle East and Africa Countertop Industry Revenue Share (%), by Material 2025 & 2033
- Figure 70: Middle East and Africa Countertop Industry Volume Share (%), by Material 2025 & 2033
- Figure 71: Middle East and Africa Countertop Industry Revenue (Million), by End User 2025 & 2033
- Figure 72: Middle East and Africa Countertop Industry Volume (K Unit), by End User 2025 & 2033
- Figure 73: Middle East and Africa Countertop Industry Revenue Share (%), by End User 2025 & 2033
- Figure 74: Middle East and Africa Countertop Industry Volume Share (%), by End User 2025 & 2033
- Figure 75: Middle East and Africa Countertop Industry Revenue (Million), by Type 2025 & 2033
- Figure 76: Middle East and Africa Countertop Industry Volume (K Unit), by Type 2025 & 2033
- Figure 77: Middle East and Africa Countertop Industry Revenue Share (%), by Type 2025 & 2033
- Figure 78: Middle East and Africa Countertop Industry Volume Share (%), by Type 2025 & 2033
- Figure 79: Middle East and Africa Countertop Industry Revenue (Million), by Country 2025 & 2033
- Figure 80: Middle East and Africa Countertop Industry Volume (K Unit), by Country 2025 & 2033
- Figure 81: Middle East and Africa Countertop Industry Revenue Share (%), by Country 2025 & 2033
- Figure 82: Middle East and Africa Countertop Industry Volume Share (%), by Country 2025 & 2033
List of Tables
- Table 1: Global Countertop Industry Revenue Million Forecast, by Material 2020 & 2033
- Table 2: Global Countertop Industry Volume K Unit Forecast, by Material 2020 & 2033
- Table 3: Global Countertop Industry Revenue Million Forecast, by End User 2020 & 2033
- Table 4: Global Countertop Industry Volume K Unit Forecast, by End User 2020 & 2033
- Table 5: Global Countertop Industry Revenue Million Forecast, by Type 2020 & 2033
- Table 6: Global Countertop Industry Volume K Unit Forecast, by Type 2020 & 2033
- Table 7: Global Countertop Industry Revenue Million Forecast, by Region 2020 & 2033
- Table 8: Global Countertop Industry Volume K Unit Forecast, by Region 2020 & 2033
- Table 9: Global Countertop Industry Revenue Million Forecast, by Material 2020 & 2033
- Table 10: Global Countertop Industry Volume K Unit Forecast, by Material 2020 & 2033
- Table 11: Global Countertop Industry Revenue Million Forecast, by End User 2020 & 2033
- Table 12: Global Countertop Industry Volume K Unit Forecast, by End User 2020 & 2033
- Table 13: Global Countertop Industry Revenue Million Forecast, by Type 2020 & 2033
- Table 14: Global Countertop Industry Volume K Unit Forecast, by Type 2020 & 2033
- Table 15: Global Countertop Industry Revenue Million Forecast, by Country 2020 & 2033
- Table 16: Global Countertop Industry Volume K Unit Forecast, by Country 2020 & 2033
- Table 17: Global Countertop Industry Revenue Million Forecast, by Material 2020 & 2033
- Table 18: Global Countertop Industry Volume K Unit Forecast, by Material 2020 & 2033
- Table 19: Global Countertop Industry Revenue Million Forecast, by End User 2020 & 2033
- Table 20: Global Countertop Industry Volume K Unit Forecast, by End User 2020 & 2033
- Table 21: Global Countertop Industry Revenue Million Forecast, by Type 2020 & 2033
- Table 22: Global Countertop Industry Volume K Unit Forecast, by Type 2020 & 2033
- Table 23: Global Countertop Industry Revenue Million Forecast, by Country 2020 & 2033
- Table 24: Global Countertop Industry Volume K Unit Forecast, by Country 2020 & 2033
- Table 25: Global Countertop Industry Revenue Million Forecast, by Material 2020 & 2033
- Table 26: Global Countertop Industry Volume K Unit Forecast, by Material 2020 & 2033
- Table 27: Global Countertop Industry Revenue Million Forecast, by End User 2020 & 2033
- Table 28: Global Countertop Industry Volume K Unit Forecast, by End User 2020 & 2033
- Table 29: Global Countertop Industry Revenue Million Forecast, by Type 2020 & 2033
- Table 30: Global Countertop Industry Volume K Unit Forecast, by Type 2020 & 2033
- Table 31: Global Countertop Industry Revenue Million Forecast, by Country 2020 & 2033
- Table 32: Global Countertop Industry Volume K Unit Forecast, by Country 2020 & 2033
- Table 33: Global Countertop Industry Revenue Million Forecast, by Material 2020 & 2033
- Table 34: Global Countertop Industry Volume K Unit Forecast, by Material 2020 & 2033
- Table 35: Global Countertop Industry Revenue Million Forecast, by End User 2020 & 2033
- Table 36: Global Countertop Industry Volume K Unit Forecast, by End User 2020 & 2033
- Table 37: Global Countertop Industry Revenue Million Forecast, by Type 2020 & 2033
- Table 38: Global Countertop Industry Volume K Unit Forecast, by Type 2020 & 2033
- Table 39: Global Countertop Industry Revenue Million Forecast, by Country 2020 & 2033
- Table 40: Global Countertop Industry Volume K Unit Forecast, by Country 2020 & 2033
- Table 41: Global Countertop Industry Revenue Million Forecast, by Material 2020 & 2033
- Table 42: Global Countertop Industry Volume K Unit Forecast, by Material 2020 & 2033
- Table 43: Global Countertop Industry Revenue Million Forecast, by End User 2020 & 2033
- Table 44: Global Countertop Industry Volume K Unit Forecast, by End User 2020 & 2033
- Table 45: Global Countertop Industry Revenue Million Forecast, by Type 2020 & 2033
- Table 46: Global Countertop Industry Volume K Unit Forecast, by Type 2020 & 2033
- Table 47: Global Countertop Industry Revenue Million Forecast, by Country 2020 & 2033
- Table 48: Global Countertop Industry Volume K Unit Forecast, by Country 2020 & 2033
Frequently Asked Questions
1. What is the projected Compound Annual Growth Rate (CAGR) of the Countertop Industry?
The projected CAGR is approximately 4.22%.
2. Which companies are prominent players in the Countertop Industry?
Key companies in the market include Cosentino S A, AKG Group, Vicostone, Cambria, Masco Corporation, ROSSKOPF + PARTNER AG, DuPont de Nemours Inc, ARISTECH SURFACES LLC, STRASSER Steine GmbH, Caesarstone Ltd, Daltile, Wilsonart LLC, Asian Granito India Limited, Pokarna Ltd, Aro Granite Industries Ltd.
3. What are the main segments of the Countertop Industry?
The market segments include Material, End User, Type.
4. Can you provide details about the market size?
The market size is estimated to be USD 148.86 Million as of 2022.
5. What are some drivers contributing to market growth?
Safety and Security of Documents Drives the Market Growth; Facility Of Large Storage Space Drives the Market Growth.
6. What are the notable trends driving market growth?
Granite is the Most Popular Choice for Countertops.
7. Are there any restraints impacting market growth?
Complex Registration Restrictions; Poor Resistance To Water And Chemical Damage.
8. Can you provide examples of recent developments in the market?
In August 2022: Wilsonart LLC, a world-class innovator of engineered surfaces, was named a winner of Kitchen & Bath Business (KBB) magazine's 2022 Readers' Choice Awards. The company has been voted as the top kitchen countertop brand in the Readers' Choice Awards for the second consecutive year.
9. What pricing options are available for accessing the report?
Pricing options include single-user, multi-user, and enterprise licenses priced at USD 4750, USD 5250, and USD 8750 respectively.
10. Is the market size provided in terms of value or volume?
The market size is provided in terms of value, measured in Million and volume, measured in K Unit.
11. Are there any specific market keywords associated with the report?
Yes, the market keyword associated with the report is "Countertop Industry," which aids in identifying and referencing the specific market segment covered.
12. How do I determine which pricing option suits my needs best?
The pricing options vary based on user requirements and access needs. Individual users may opt for single-user licenses, while businesses requiring broader access may choose multi-user or enterprise licenses for cost-effective access to the report.
13. Are there any additional resources or data provided in the Countertop Industry report?
While the report offers comprehensive insights, it's advisable to review the specific contents or supplementary materials provided to ascertain if additional resources or data are available.
14. How can I stay updated on further developments or reports in the Countertop Industry?
To stay informed about further developments, trends, and reports in the Countertop Industry, consider subscribing to industry newsletters, following relevant companies and organizations, or regularly checking reputable industry news sources and publications.
Methodology
Step 1 - Identification of Relevant Samples Size from Population Database


Step 2 - Approaches for Defining Global Market Size (Value, Volume* & Price*)

Note*: In applicable scenarios
Step 3 - Data Sources
Primary Research
- Web Analytics
- Survey Reports
- Research Institute
- Latest Research Reports
- Opinion Leaders
Secondary Research
- Annual Reports
- White Paper
- Latest Press Release
- Industry Association
- Paid Database
- Investor Presentations

Step 4 - Data Triangulation
Involves using different sources of information in order to increase the validity of a study
These sources are likely to be stakeholders in a program - participants, other researchers, program staff, other community members, and so on.
Then we put all data in single framework & apply various statistical tools to find out the dynamic on the market.
During the analysis stage, feedback from the stakeholder groups would be compared to determine areas of agreement as well as areas of divergence