

Key Insights
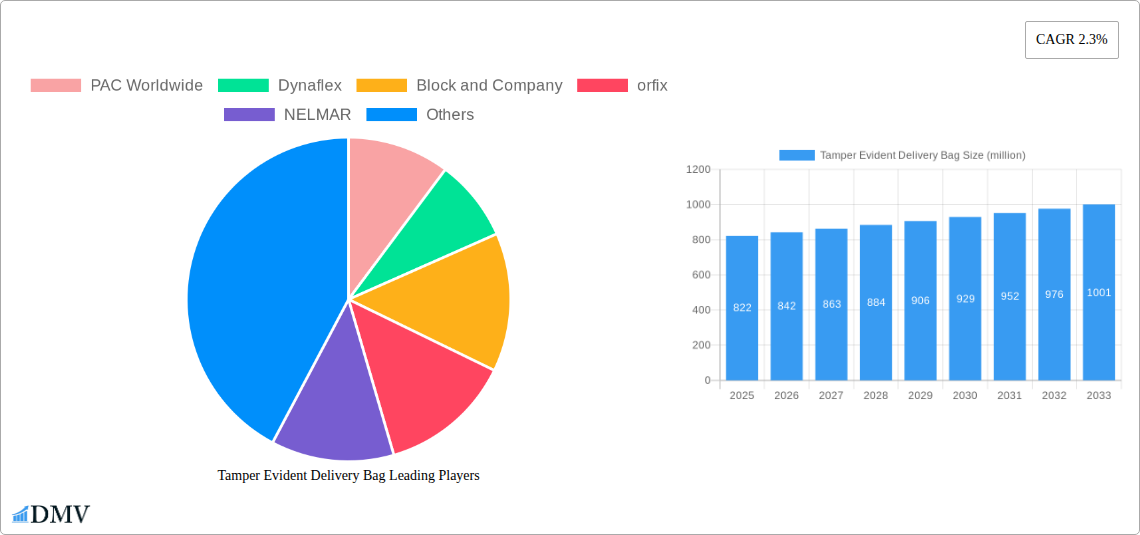
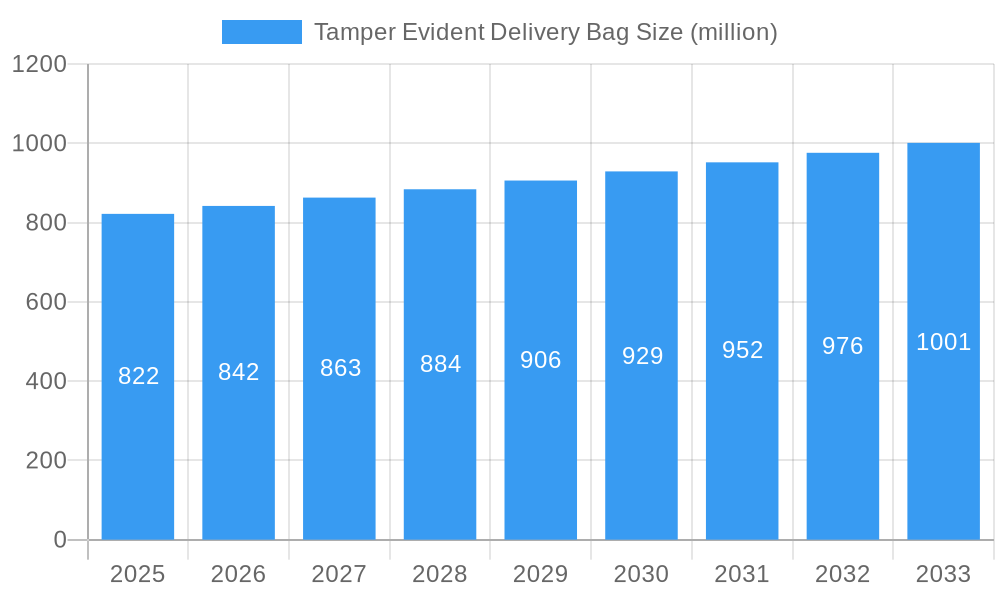
The tamper-evident delivery bag market, currently valued at $822 million in 2025, is projected to experience steady growth, driven primarily by the escalating demand for secure and reliable e-commerce deliveries. Increased concerns regarding product integrity and theft during transit, particularly in high-value goods and pharmaceutical sectors, are significant market drivers. The rising adoption of e-commerce and the consequent surge in package deliveries further fuels market expansion. Consumer preference for environmentally friendly packaging is also influencing the market, leading to increased demand for recyclable and sustainable tamper-evident bag options. While the relatively low CAGR of 2.3% suggests a mature market, innovation in materials, security features (e.g., advanced seals, RFID integration), and sustainable packaging solutions present opportunities for growth. Competition within the market is robust, with major players like PAC Worldwide, Berry Global, and Novolex vying for market share through product differentiation and strategic partnerships. Challenges include fluctuating raw material prices and the need for continuous innovation to meet evolving security threats.
Tamper Evident Delivery Bag Market Size (In Million)
The forecast period (2025-2033) anticipates consistent, albeit moderate, market growth. This growth will be influenced by factors such as technological advancements, regulatory changes impacting packaging safety standards, and the ongoing expansion of the e-commerce sector across various geographic regions. The market is expected to be segmented by material type (plastic, paper, etc.), closure mechanism (adhesive, zipper, etc.), and application (food & beverage, pharmaceuticals, etc.). Furthermore, regional variations in growth rates are expected, with regions experiencing rapid e-commerce adoption exhibiting higher growth potential. Companies are likely to focus on building strong supply chains, enhancing their product portfolio, and adapting to evolving consumer demands to maintain a competitive edge in this market.
Tamper Evident Delivery Bag Company Market Share
Tamper Evident Delivery Bag Market Report: A Comprehensive Analysis (2019-2033)
This insightful report provides a comprehensive analysis of the global tamper evident delivery bag market, projecting a market value exceeding $XX million by 2033. The study covers the historical period (2019-2024), the base year (2025), and the forecast period (2025-2033), offering a detailed view of market dynamics and future potential. Key players like PAC Worldwide, Dynaflex, and Berry Global are profiled, alongside an in-depth examination of market trends, challenges, and opportunities. This report is an essential resource for stakeholders seeking to understand and capitalize on this rapidly evolving market.
Tamper Evident Delivery Bag Market Composition & Trends
The global tamper evident delivery bag market exhibits a moderately concentrated landscape, with a few major players holding significant market share. PAC Worldwide, for example, commands an estimated xx% market share in 2025, while Berry Global holds approximately xx%. However, the market also sees numerous smaller players, creating a dynamic competitive environment.
Several factors are driving innovation within the sector. Increasing e-commerce, stringent regulations concerning product security, and growing consumer demand for secure packaging are all key catalysts. Furthermore, the emergence of sustainable and eco-friendly materials is pushing innovation in materials science and manufacturing processes. Mergers and acquisitions (M&A) activity within the industry is moderate, with estimated deal values totaling $XX million in 2024. These M&A activities primarily involve smaller companies seeking to expand their market reach or gain access to advanced technologies. Substitute products, such as tamper-evident seals and customized packaging solutions, exert moderate pressure on the market. The end-user profile is diverse, including e-commerce businesses, pharmaceutical companies, logistics providers, and food & beverage companies.
- Market Share Distribution (2025): PAC Worldwide (xx%), Berry Global (xx%), Dynaflex (xx%), Others (xx%)
- M&A Deal Value (2024): $XX million
- Key End-Users: E-commerce, Pharmaceuticals, Logistics, Food & Beverage
Tamper Evident Delivery Bag Industry Evolution
The tamper evident delivery bag market has witnessed significant growth, expanding at a CAGR of xx% during the historical period (2019-2024). This growth trajectory is primarily driven by the booming e-commerce sector, resulting in a substantial increase in demand for secure packaging solutions. Technological advancements, including the introduction of innovative materials and improved sealing mechanisms, further contribute to market expansion. The integration of RFID and GPS tracking systems into tamper evident bags is also gaining traction, enabling improved supply chain visibility and enhanced security. Consumer demand for environmentally friendly packaging options is steadily increasing, pushing manufacturers to develop more sustainable solutions using biodegradable and recyclable materials. The adoption rate of tamper-evident bags within the pharmaceutical and healthcare sectors, driven by stringent regulatory requirements, is expected to accelerate further over the forecast period.
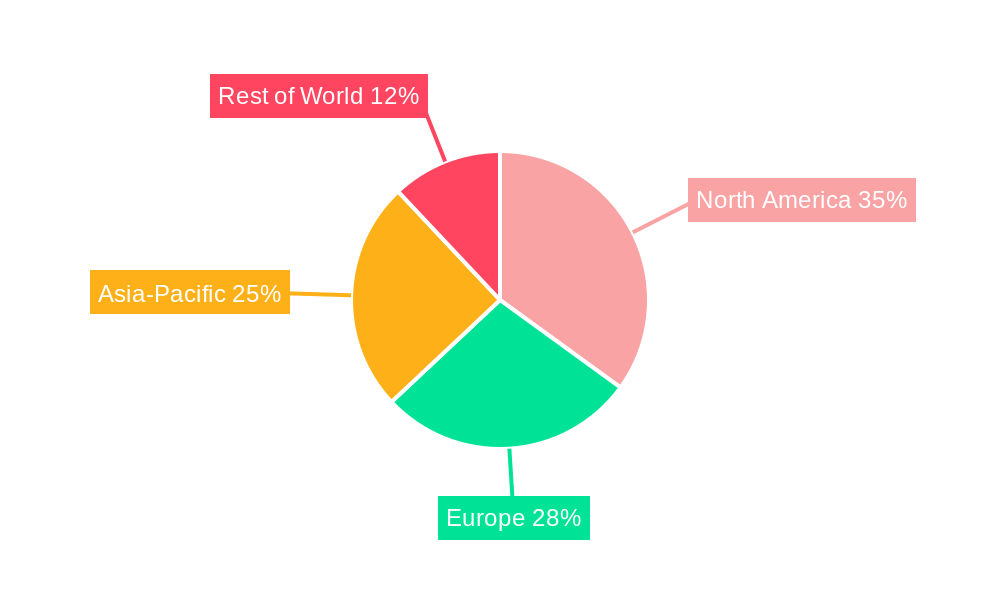
Leading Regions, Countries, or Segments in Tamper Evident Delivery Bag
North America currently dominates the global tamper evident delivery bag market, followed by Europe and Asia-Pacific. This dominance is largely attributed to the advanced e-commerce infrastructure and high consumer spending in these regions.
Key Drivers of North American Dominance:
- High e-commerce penetration and robust logistics networks.
- Stringent regulatory requirements for secure packaging in various industries.
- Significant investments in advanced packaging technologies.
Analysis of Dominance Factors: The strong presence of major players like PAC Worldwide and Berry Global in North America contributes significantly to the region’s leadership. Furthermore, the high adoption of tamper-evident bags in the pharmaceutical and healthcare sectors further strengthens the region's market position. The robust e-commerce infrastructure and advanced logistics networks also play a crucial role in facilitating the efficient distribution and utilization of tamper-evident bags.
Tamper Evident Delivery Bag Product Innovations
Recent innovations in tamper evident delivery bags focus on enhanced security features, improved material sustainability, and customized solutions. This includes the incorporation of advanced sealing mechanisms, such as laser-perforated seals, and the use of innovative materials like biodegradable plastics and recycled content. Furthermore, the integration of smart packaging technologies, including RFID tags and QR codes, allows for better tracking and verification of product authenticity. These advancements cater to the growing demand for secure, environmentally responsible, and traceable packaging solutions across various industries.
Propelling Factors for Tamper Evident Delivery Bag Growth
The growth of the tamper evident delivery bag market is propelled by several key factors:
- E-commerce Boom: The rapid expansion of online shopping drives significant demand for secure packaging solutions.
- Stringent Regulations: Increasing regulatory requirements for product security, particularly in the pharmaceutical and healthcare sectors, mandate the use of tamper-evident bags.
- Technological Advancements: Innovations in materials science and packaging technologies are leading to the development of more secure, sustainable, and cost-effective solutions.
Obstacles in the Tamper Evident Delivery Bag Market
Several factors hinder the growth of the tamper evident delivery bag market:
- Supply Chain Disruptions: Global supply chain disruptions can impact the availability of raw materials and hinder production. The impact is estimated to reduce annual market growth by approximately xx% in years with significant disruptions.
- Fluctuating Raw Material Prices: The cost of raw materials, such as plastics and films, can significantly impact production costs and overall market profitability.
- Competitive Pressure: The presence of numerous players in the market creates a highly competitive landscape.
Future Opportunities in Tamper Evident Delivery Bag
The future holds significant opportunities for the tamper evident delivery bag market:
- Expansion into Emerging Markets: Growth in e-commerce and increasing disposable incomes in developing countries create substantial opportunities for market expansion.
- Sustainable Packaging Solutions: The growing emphasis on environmental sustainability is driving the demand for eco-friendly tamper-evident bags made from biodegradable or recycled materials.
- Smart Packaging Integration: The integration of smart technologies, such as sensors and IoT devices, into tamper-evident bags offers enhanced security and supply chain visibility.
Major Players in the Tamper Evident Delivery Bag Ecosystem
- PAC Worldwide
- Dynaflex
- Block and Company
- orfix
- NELMAR
- ProAmpac
- Westpak
- Pak Solutions
- Packman
- Berry Global
- Novolex
- Alte-Rego
- Adsure
- DynaCorp
- Versapak
- IPS Industries
- Shanghai Xinfan Industrial Corporation
- SoundSeal
Key Developments in Tamper Evident Delivery Bag Industry
- 2022 Q3: PAC Worldwide launched a new line of eco-friendly tamper evident bags made from recycled materials.
- 2023 Q1: Berry Global acquired a smaller packaging company, expanding its product portfolio and market reach.
- 2024 Q2: New regulations in the EU concerning e-commerce packaging increased the demand for tamper-evident solutions. (Further developments would be added here for a full report)
Strategic Tamper Evident Delivery Bag Market Forecast
The tamper evident delivery bag market is poised for robust growth in the coming years, driven by sustained e-commerce expansion, stringent regulatory measures, and ongoing technological innovations. The market's potential is substantial, with projections indicating significant market expansion across various regions and segments. Continued investment in sustainable packaging solutions and the integration of smart technologies will be crucial for market participants to maintain a competitive edge and capitalize on emerging opportunities. The focus on enhancing security features, coupled with a commitment to environmental responsibility, will shape the future trajectory of the market.
Tamper Evident Delivery Bag Segmentation
-
1. Application
- 1.1. Food Delivery
- 1.2. Pharmaceutical Delivery
- 1.3. E-commerce Delivery
- 1.4. Cash and Valuables Transport
- 1.5. Laboratory and Specimen Transport
- 1.6. Others
-
2. Type
- 2.1. Adhesive-sealed Bags
- 2.2. Zipper-sealed Bags
- 2.3. Others
Tamper Evident Delivery Bag Segmentation By Geography
-
1. North America
- 1.1. United States
- 1.2. Canada
- 1.3. Mexico
-
2. South America
- 2.1. Brazil
- 2.2. Argentina
- 2.3. Rest of South America
-
3. Europe
- 3.1. United Kingdom
- 3.2. Germany
- 3.3. France
- 3.4. Italy
- 3.5. Spain
- 3.6. Russia
- 3.7. Benelux
- 3.8. Nordics
- 3.9. Rest of Europe
-
4. Middle East & Africa
- 4.1. Turkey
- 4.2. Israel
- 4.3. GCC
- 4.4. North Africa
- 4.5. South Africa
- 4.6. Rest of Middle East & Africa
-
5. Asia Pacific
- 5.1. China
- 5.2. India
- 5.3. Japan
- 5.4. South Korea
- 5.5. ASEAN
- 5.6. Oceania
- 5.7. Rest of Asia Pacific
Tamper Evident Delivery Bag Regional Market Share
Geographic Coverage of Tamper Evident Delivery Bag
Tamper Evident Delivery Bag REPORT HIGHLIGHTS
| Aspects | Details |
|---|---|
| Study Period | 2020-2034 |
| Base Year | 2025 |
| Estimated Year | 2026 |
| Forecast Period | 2026-2034 |
| Historical Period | 2020-2025 |
| Growth Rate | CAGR of 2.3% from 2020-2034 |
| Segmentation |
|
Table of Contents
- 1. Introduction
- 1.1. Research Scope
- 1.2. Market Segmentation
- 1.3. Research Objective
- 1.4. Definitions and Assumptions
- 2. Executive Summary
- 2.1. Market Snapshot
- 3. Market Dynamics
- 3.1. Market Drivers
- 3.2. Market Restrains
- 3.3. Market Trends
- 3.4. Market Opportunities
- 4. Market Factor Analysis
- 4.1. Porters Five Forces
- 4.1.1. Bargaining Power of Suppliers
- 4.1.2. Bargaining Power of Buyers
- 4.1.3. Threat of New Entrants
- 4.1.4. Threat of Substitutes
- 4.1.5. Competitive Rivalry
- 4.2. PESTEL analysis
- 4.3. BCG Analysis
- 4.3.1. Stars (High Growth, High Market Share)
- 4.3.2. Cash Cows (Low Growth, High Market Share)
- 4.3.3. Question Mark (High Growth, Low Market Share)
- 4.3.4. Dogs (Low Growth, Low Market Share)
- 4.4. Ansoff Matrix Analysis
- 4.5. Supply Chain Analysis
- 4.6. Regulatory Landscape
- 4.7. Current Market Potential and Opportunity Assessment (TAM–SAM–SOM Framework)
- 4.8. DMV Analyst Note
- 4.1. Porters Five Forces
- 5. Market Analysis, Insights and Forecast 2021-2033
- 5.1. Market Analysis, Insights and Forecast - by Application
- 5.1.1. Food Delivery
- 5.1.2. Pharmaceutical Delivery
- 5.1.3. E-commerce Delivery
- 5.1.4. Cash and Valuables Transport
- 5.1.5. Laboratory and Specimen Transport
- 5.1.6. Others
- 5.2. Market Analysis, Insights and Forecast - by Type
- 5.2.1. Adhesive-sealed Bags
- 5.2.2. Zipper-sealed Bags
- 5.2.3. Others
- 5.3. Market Analysis, Insights and Forecast - by Region
- 5.3.1. North America
- 5.3.2. South America
- 5.3.3. Europe
- 5.3.4. Middle East & Africa
- 5.3.5. Asia Pacific
- 5.1. Market Analysis, Insights and Forecast - by Application
- 6. Global Tamper Evident Delivery Bag Analysis, Insights and Forecast, 2021-2033
- 6.1. Market Analysis, Insights and Forecast - by Application
- 6.1.1. Food Delivery
- 6.1.2. Pharmaceutical Delivery
- 6.1.3. E-commerce Delivery
- 6.1.4. Cash and Valuables Transport
- 6.1.5. Laboratory and Specimen Transport
- 6.1.6. Others
- 6.2. Market Analysis, Insights and Forecast - by Type
- 6.2.1. Adhesive-sealed Bags
- 6.2.2. Zipper-sealed Bags
- 6.2.3. Others
- 6.1. Market Analysis, Insights and Forecast - by Application
- 7. North America Tamper Evident Delivery Bag Analysis, Insights and Forecast, 2020-2032
- 7.1. Market Analysis, Insights and Forecast - by Application
- 7.1.1. Food Delivery
- 7.1.2. Pharmaceutical Delivery
- 7.1.3. E-commerce Delivery
- 7.1.4. Cash and Valuables Transport
- 7.1.5. Laboratory and Specimen Transport
- 7.1.6. Others
- 7.2. Market Analysis, Insights and Forecast - by Type
- 7.2.1. Adhesive-sealed Bags
- 7.2.2. Zipper-sealed Bags
- 7.2.3. Others
- 7.1. Market Analysis, Insights and Forecast - by Application
- 8. South America Tamper Evident Delivery Bag Analysis, Insights and Forecast, 2020-2032
- 8.1. Market Analysis, Insights and Forecast - by Application
- 8.1.1. Food Delivery
- 8.1.2. Pharmaceutical Delivery
- 8.1.3. E-commerce Delivery
- 8.1.4. Cash and Valuables Transport
- 8.1.5. Laboratory and Specimen Transport
- 8.1.6. Others
- 8.2. Market Analysis, Insights and Forecast - by Type
- 8.2.1. Adhesive-sealed Bags
- 8.2.2. Zipper-sealed Bags
- 8.2.3. Others
- 8.1. Market Analysis, Insights and Forecast - by Application
- 9. Europe Tamper Evident Delivery Bag Analysis, Insights and Forecast, 2020-2032
- 9.1. Market Analysis, Insights and Forecast - by Application
- 9.1.1. Food Delivery
- 9.1.2. Pharmaceutical Delivery
- 9.1.3. E-commerce Delivery
- 9.1.4. Cash and Valuables Transport
- 9.1.5. Laboratory and Specimen Transport
- 9.1.6. Others
- 9.2. Market Analysis, Insights and Forecast - by Type
- 9.2.1. Adhesive-sealed Bags
- 9.2.2. Zipper-sealed Bags
- 9.2.3. Others
- 9.1. Market Analysis, Insights and Forecast - by Application
- 10. Middle East & Africa Tamper Evident Delivery Bag Analysis, Insights and Forecast, 2020-2032
- 10.1. Market Analysis, Insights and Forecast - by Application
- 10.1.1. Food Delivery
- 10.1.2. Pharmaceutical Delivery
- 10.1.3. E-commerce Delivery
- 10.1.4. Cash and Valuables Transport
- 10.1.5. Laboratory and Specimen Transport
- 10.1.6. Others
- 10.2. Market Analysis, Insights and Forecast - by Type
- 10.2.1. Adhesive-sealed Bags
- 10.2.2. Zipper-sealed Bags
- 10.2.3. Others
- 10.1. Market Analysis, Insights and Forecast - by Application
- 11. Asia Pacific Tamper Evident Delivery Bag Analysis, Insights and Forecast, 2020-2032
- 11.1. Market Analysis, Insights and Forecast - by Application
- 11.1.1. Food Delivery
- 11.1.2. Pharmaceutical Delivery
- 11.1.3. E-commerce Delivery
- 11.1.4. Cash and Valuables Transport
- 11.1.5. Laboratory and Specimen Transport
- 11.1.6. Others
- 11.2. Market Analysis, Insights and Forecast - by Type
- 11.2.1. Adhesive-sealed Bags
- 11.2.2. Zipper-sealed Bags
- 11.2.3. Others
- 11.1. Market Analysis, Insights and Forecast - by Application
- 12. Competitive Analysis
- 12.1. Company Profiles
- 12.1.1 PAC Worldwide
- 12.1.1.1. Company Overview
- 12.1.1.2. Products
- 12.1.1.3. Company Financials
- 12.1.1.4. SWOT Analysis
- 12.1.2 Dynaflex
- 12.1.2.1. Company Overview
- 12.1.2.2. Products
- 12.1.2.3. Company Financials
- 12.1.2.4. SWOT Analysis
- 12.1.3 Block and Company
- 12.1.3.1. Company Overview
- 12.1.3.2. Products
- 12.1.3.3. Company Financials
- 12.1.3.4. SWOT Analysis
- 12.1.4 orfix
- 12.1.4.1. Company Overview
- 12.1.4.2. Products
- 12.1.4.3. Company Financials
- 12.1.4.4. SWOT Analysis
- 12.1.5 NELMAR
- 12.1.5.1. Company Overview
- 12.1.5.2. Products
- 12.1.5.3. Company Financials
- 12.1.5.4. SWOT Analysis
- 12.1.6 ProAmpac
- 12.1.6.1. Company Overview
- 12.1.6.2. Products
- 12.1.6.3. Company Financials
- 12.1.6.4. SWOT Analysis
- 12.1.7 Westpak
- 12.1.7.1. Company Overview
- 12.1.7.2. Products
- 12.1.7.3. Company Financials
- 12.1.7.4. SWOT Analysis
- 12.1.8 Pak Solutions
- 12.1.8.1. Company Overview
- 12.1.8.2. Products
- 12.1.8.3. Company Financials
- 12.1.8.4. SWOT Analysis
- 12.1.9 Packman
- 12.1.9.1. Company Overview
- 12.1.9.2. Products
- 12.1.9.3. Company Financials
- 12.1.9.4. SWOT Analysis
- 12.1.10 Berry Global
- 12.1.10.1. Company Overview
- 12.1.10.2. Products
- 12.1.10.3. Company Financials
- 12.1.10.4. SWOT Analysis
- 12.1.11 Novolex
- 12.1.11.1. Company Overview
- 12.1.11.2. Products
- 12.1.11.3. Company Financials
- 12.1.11.4. SWOT Analysis
- 12.1.12 Alte-Rego
- 12.1.12.1. Company Overview
- 12.1.12.2. Products
- 12.1.12.3. Company Financials
- 12.1.12.4. SWOT Analysis
- 12.1.13 Adsure
- 12.1.13.1. Company Overview
- 12.1.13.2. Products
- 12.1.13.3. Company Financials
- 12.1.13.4. SWOT Analysis
- 12.1.14 DynaCorp
- 12.1.14.1. Company Overview
- 12.1.14.2. Products
- 12.1.14.3. Company Financials
- 12.1.14.4. SWOT Analysis
- 12.1.15 Versapak
- 12.1.15.1. Company Overview
- 12.1.15.2. Products
- 12.1.15.3. Company Financials
- 12.1.15.4. SWOT Analysis
- 12.1.16 IPS Industries
- 12.1.16.1. Company Overview
- 12.1.16.2. Products
- 12.1.16.3. Company Financials
- 12.1.16.4. SWOT Analysis
- 12.1.17 Shanghai Xinfan Industrial Corporation
- 12.1.17.1. Company Overview
- 12.1.17.2. Products
- 12.1.17.3. Company Financials
- 12.1.17.4. SWOT Analysis
- 12.1.18 SoundSeal
- 12.1.18.1. Company Overview
- 12.1.18.2. Products
- 12.1.18.3. Company Financials
- 12.1.18.4. SWOT Analysis
- 12.1.1 PAC Worldwide
- 12.2. Market Entropy
- 12.2.1 Company's Key Areas Served
- 12.2.2 Recent Developments
- 12.3. Company Market Share Analysis 2025
- 12.3.1 Top 5 Companies Market Share Analysis
- 12.3.2 Top 3 Companies Market Share Analysis
- 12.4. List of Potential Customers
- 13. Research Methodology
List of Figures
- Figure 1: Global Tamper Evident Delivery Bag Revenue Breakdown (million, %) by Region 2025 & 2033
- Figure 2: Global Tamper Evident Delivery Bag Volume Breakdown (K, %) by Region 2025 & 2033
- Figure 3: North America Tamper Evident Delivery Bag Revenue (million), by Application 2025 & 2033
- Figure 4: North America Tamper Evident Delivery Bag Volume (K), by Application 2025 & 2033
- Figure 5: North America Tamper Evident Delivery Bag Revenue Share (%), by Application 2025 & 2033
- Figure 6: North America Tamper Evident Delivery Bag Volume Share (%), by Application 2025 & 2033
- Figure 7: North America Tamper Evident Delivery Bag Revenue (million), by Type 2025 & 2033
- Figure 8: North America Tamper Evident Delivery Bag Volume (K), by Type 2025 & 2033
- Figure 9: North America Tamper Evident Delivery Bag Revenue Share (%), by Type 2025 & 2033
- Figure 10: North America Tamper Evident Delivery Bag Volume Share (%), by Type 2025 & 2033
- Figure 11: North America Tamper Evident Delivery Bag Revenue (million), by Country 2025 & 2033
- Figure 12: North America Tamper Evident Delivery Bag Volume (K), by Country 2025 & 2033
- Figure 13: North America Tamper Evident Delivery Bag Revenue Share (%), by Country 2025 & 2033
- Figure 14: North America Tamper Evident Delivery Bag Volume Share (%), by Country 2025 & 2033
- Figure 15: South America Tamper Evident Delivery Bag Revenue (million), by Application 2025 & 2033
- Figure 16: South America Tamper Evident Delivery Bag Volume (K), by Application 2025 & 2033
- Figure 17: South America Tamper Evident Delivery Bag Revenue Share (%), by Application 2025 & 2033
- Figure 18: South America Tamper Evident Delivery Bag Volume Share (%), by Application 2025 & 2033
- Figure 19: South America Tamper Evident Delivery Bag Revenue (million), by Type 2025 & 2033
- Figure 20: South America Tamper Evident Delivery Bag Volume (K), by Type 2025 & 2033
- Figure 21: South America Tamper Evident Delivery Bag Revenue Share (%), by Type 2025 & 2033
- Figure 22: South America Tamper Evident Delivery Bag Volume Share (%), by Type 2025 & 2033
- Figure 23: South America Tamper Evident Delivery Bag Revenue (million), by Country 2025 & 2033
- Figure 24: South America Tamper Evident Delivery Bag Volume (K), by Country 2025 & 2033
- Figure 25: South America Tamper Evident Delivery Bag Revenue Share (%), by Country 2025 & 2033
- Figure 26: South America Tamper Evident Delivery Bag Volume Share (%), by Country 2025 & 2033
- Figure 27: Europe Tamper Evident Delivery Bag Revenue (million), by Application 2025 & 2033
- Figure 28: Europe Tamper Evident Delivery Bag Volume (K), by Application 2025 & 2033
- Figure 29: Europe Tamper Evident Delivery Bag Revenue Share (%), by Application 2025 & 2033
- Figure 30: Europe Tamper Evident Delivery Bag Volume Share (%), by Application 2025 & 2033
- Figure 31: Europe Tamper Evident Delivery Bag Revenue (million), by Type 2025 & 2033
- Figure 32: Europe Tamper Evident Delivery Bag Volume (K), by Type 2025 & 2033
- Figure 33: Europe Tamper Evident Delivery Bag Revenue Share (%), by Type 2025 & 2033
- Figure 34: Europe Tamper Evident Delivery Bag Volume Share (%), by Type 2025 & 2033
- Figure 35: Europe Tamper Evident Delivery Bag Revenue (million), by Country 2025 & 2033
- Figure 36: Europe Tamper Evident Delivery Bag Volume (K), by Country 2025 & 2033
- Figure 37: Europe Tamper Evident Delivery Bag Revenue Share (%), by Country 2025 & 2033
- Figure 38: Europe Tamper Evident Delivery Bag Volume Share (%), by Country 2025 & 2033
- Figure 39: Middle East & Africa Tamper Evident Delivery Bag Revenue (million), by Application 2025 & 2033
- Figure 40: Middle East & Africa Tamper Evident Delivery Bag Volume (K), by Application 2025 & 2033
- Figure 41: Middle East & Africa Tamper Evident Delivery Bag Revenue Share (%), by Application 2025 & 2033
- Figure 42: Middle East & Africa Tamper Evident Delivery Bag Volume Share (%), by Application 2025 & 2033
- Figure 43: Middle East & Africa Tamper Evident Delivery Bag Revenue (million), by Type 2025 & 2033
- Figure 44: Middle East & Africa Tamper Evident Delivery Bag Volume (K), by Type 2025 & 2033
- Figure 45: Middle East & Africa Tamper Evident Delivery Bag Revenue Share (%), by Type 2025 & 2033
- Figure 46: Middle East & Africa Tamper Evident Delivery Bag Volume Share (%), by Type 2025 & 2033
- Figure 47: Middle East & Africa Tamper Evident Delivery Bag Revenue (million), by Country 2025 & 2033
- Figure 48: Middle East & Africa Tamper Evident Delivery Bag Volume (K), by Country 2025 & 2033
- Figure 49: Middle East & Africa Tamper Evident Delivery Bag Revenue Share (%), by Country 2025 & 2033
- Figure 50: Middle East & Africa Tamper Evident Delivery Bag Volume Share (%), by Country 2025 & 2033
- Figure 51: Asia Pacific Tamper Evident Delivery Bag Revenue (million), by Application 2025 & 2033
- Figure 52: Asia Pacific Tamper Evident Delivery Bag Volume (K), by Application 2025 & 2033
- Figure 53: Asia Pacific Tamper Evident Delivery Bag Revenue Share (%), by Application 2025 & 2033
- Figure 54: Asia Pacific Tamper Evident Delivery Bag Volume Share (%), by Application 2025 & 2033
- Figure 55: Asia Pacific Tamper Evident Delivery Bag Revenue (million), by Type 2025 & 2033
- Figure 56: Asia Pacific Tamper Evident Delivery Bag Volume (K), by Type 2025 & 2033
- Figure 57: Asia Pacific Tamper Evident Delivery Bag Revenue Share (%), by Type 2025 & 2033
- Figure 58: Asia Pacific Tamper Evident Delivery Bag Volume Share (%), by Type 2025 & 2033
- Figure 59: Asia Pacific Tamper Evident Delivery Bag Revenue (million), by Country 2025 & 2033
- Figure 60: Asia Pacific Tamper Evident Delivery Bag Volume (K), by Country 2025 & 2033
- Figure 61: Asia Pacific Tamper Evident Delivery Bag Revenue Share (%), by Country 2025 & 2033
- Figure 62: Asia Pacific Tamper Evident Delivery Bag Volume Share (%), by Country 2025 & 2033
List of Tables
- Table 1: Global Tamper Evident Delivery Bag Revenue million Forecast, by Application 2020 & 2033
- Table 2: Global Tamper Evident Delivery Bag Volume K Forecast, by Application 2020 & 2033
- Table 3: Global Tamper Evident Delivery Bag Revenue million Forecast, by Type 2020 & 2033
- Table 4: Global Tamper Evident Delivery Bag Volume K Forecast, by Type 2020 & 2033
- Table 5: Global Tamper Evident Delivery Bag Revenue million Forecast, by Region 2020 & 2033
- Table 6: Global Tamper Evident Delivery Bag Volume K Forecast, by Region 2020 & 2033
- Table 7: Global Tamper Evident Delivery Bag Revenue million Forecast, by Application 2020 & 2033
- Table 8: Global Tamper Evident Delivery Bag Volume K Forecast, by Application 2020 & 2033
- Table 9: Global Tamper Evident Delivery Bag Revenue million Forecast, by Type 2020 & 2033
- Table 10: Global Tamper Evident Delivery Bag Volume K Forecast, by Type 2020 & 2033
- Table 11: Global Tamper Evident Delivery Bag Revenue million Forecast, by Country 2020 & 2033
- Table 12: Global Tamper Evident Delivery Bag Volume K Forecast, by Country 2020 & 2033
- Table 13: United States Tamper Evident Delivery Bag Revenue (million) Forecast, by Application 2020 & 2033
- Table 14: United States Tamper Evident Delivery Bag Volume (K) Forecast, by Application 2020 & 2033
- Table 15: Canada Tamper Evident Delivery Bag Revenue (million) Forecast, by Application 2020 & 2033
- Table 16: Canada Tamper Evident Delivery Bag Volume (K) Forecast, by Application 2020 & 2033
- Table 17: Mexico Tamper Evident Delivery Bag Revenue (million) Forecast, by Application 2020 & 2033
- Table 18: Mexico Tamper Evident Delivery Bag Volume (K) Forecast, by Application 2020 & 2033
- Table 19: Global Tamper Evident Delivery Bag Revenue million Forecast, by Application 2020 & 2033
- Table 20: Global Tamper Evident Delivery Bag Volume K Forecast, by Application 2020 & 2033
- Table 21: Global Tamper Evident Delivery Bag Revenue million Forecast, by Type 2020 & 2033
- Table 22: Global Tamper Evident Delivery Bag Volume K Forecast, by Type 2020 & 2033
- Table 23: Global Tamper Evident Delivery Bag Revenue million Forecast, by Country 2020 & 2033
- Table 24: Global Tamper Evident Delivery Bag Volume K Forecast, by Country 2020 & 2033
- Table 25: Brazil Tamper Evident Delivery Bag Revenue (million) Forecast, by Application 2020 & 2033
- Table 26: Brazil Tamper Evident Delivery Bag Volume (K) Forecast, by Application 2020 & 2033
- Table 27: Argentina Tamper Evident Delivery Bag Revenue (million) Forecast, by Application 2020 & 2033
- Table 28: Argentina Tamper Evident Delivery Bag Volume (K) Forecast, by Application 2020 & 2033
- Table 29: Rest of South America Tamper Evident Delivery Bag Revenue (million) Forecast, by Application 2020 & 2033
- Table 30: Rest of South America Tamper Evident Delivery Bag Volume (K) Forecast, by Application 2020 & 2033
- Table 31: Global Tamper Evident Delivery Bag Revenue million Forecast, by Application 2020 & 2033
- Table 32: Global Tamper Evident Delivery Bag Volume K Forecast, by Application 2020 & 2033
- Table 33: Global Tamper Evident Delivery Bag Revenue million Forecast, by Type 2020 & 2033
- Table 34: Global Tamper Evident Delivery Bag Volume K Forecast, by Type 2020 & 2033
- Table 35: Global Tamper Evident Delivery Bag Revenue million Forecast, by Country 2020 & 2033
- Table 36: Global Tamper Evident Delivery Bag Volume K Forecast, by Country 2020 & 2033
- Table 37: United Kingdom Tamper Evident Delivery Bag Revenue (million) Forecast, by Application 2020 & 2033
- Table 38: United Kingdom Tamper Evident Delivery Bag Volume (K) Forecast, by Application 2020 & 2033
- Table 39: Germany Tamper Evident Delivery Bag Revenue (million) Forecast, by Application 2020 & 2033
- Table 40: Germany Tamper Evident Delivery Bag Volume (K) Forecast, by Application 2020 & 2033
- Table 41: France Tamper Evident Delivery Bag Revenue (million) Forecast, by Application 2020 & 2033
- Table 42: France Tamper Evident Delivery Bag Volume (K) Forecast, by Application 2020 & 2033
- Table 43: Italy Tamper Evident Delivery Bag Revenue (million) Forecast, by Application 2020 & 2033
- Table 44: Italy Tamper Evident Delivery Bag Volume (K) Forecast, by Application 2020 & 2033
- Table 45: Spain Tamper Evident Delivery Bag Revenue (million) Forecast, by Application 2020 & 2033
- Table 46: Spain Tamper Evident Delivery Bag Volume (K) Forecast, by Application 2020 & 2033
- Table 47: Russia Tamper Evident Delivery Bag Revenue (million) Forecast, by Application 2020 & 2033
- Table 48: Russia Tamper Evident Delivery Bag Volume (K) Forecast, by Application 2020 & 2033
- Table 49: Benelux Tamper Evident Delivery Bag Revenue (million) Forecast, by Application 2020 & 2033
- Table 50: Benelux Tamper Evident Delivery Bag Volume (K) Forecast, by Application 2020 & 2033
- Table 51: Nordics Tamper Evident Delivery Bag Revenue (million) Forecast, by Application 2020 & 2033
- Table 52: Nordics Tamper Evident Delivery Bag Volume (K) Forecast, by Application 2020 & 2033
- Table 53: Rest of Europe Tamper Evident Delivery Bag Revenue (million) Forecast, by Application 2020 & 2033
- Table 54: Rest of Europe Tamper Evident Delivery Bag Volume (K) Forecast, by Application 2020 & 2033
- Table 55: Global Tamper Evident Delivery Bag Revenue million Forecast, by Application 2020 & 2033
- Table 56: Global Tamper Evident Delivery Bag Volume K Forecast, by Application 2020 & 2033
- Table 57: Global Tamper Evident Delivery Bag Revenue million Forecast, by Type 2020 & 2033
- Table 58: Global Tamper Evident Delivery Bag Volume K Forecast, by Type 2020 & 2033
- Table 59: Global Tamper Evident Delivery Bag Revenue million Forecast, by Country 2020 & 2033
- Table 60: Global Tamper Evident Delivery Bag Volume K Forecast, by Country 2020 & 2033
- Table 61: Turkey Tamper Evident Delivery Bag Revenue (million) Forecast, by Application 2020 & 2033
- Table 62: Turkey Tamper Evident Delivery Bag Volume (K) Forecast, by Application 2020 & 2033
- Table 63: Israel Tamper Evident Delivery Bag Revenue (million) Forecast, by Application 2020 & 2033
- Table 64: Israel Tamper Evident Delivery Bag Volume (K) Forecast, by Application 2020 & 2033
- Table 65: GCC Tamper Evident Delivery Bag Revenue (million) Forecast, by Application 2020 & 2033
- Table 66: GCC Tamper Evident Delivery Bag Volume (K) Forecast, by Application 2020 & 2033
- Table 67: North Africa Tamper Evident Delivery Bag Revenue (million) Forecast, by Application 2020 & 2033
- Table 68: North Africa Tamper Evident Delivery Bag Volume (K) Forecast, by Application 2020 & 2033
- Table 69: South Africa Tamper Evident Delivery Bag Revenue (million) Forecast, by Application 2020 & 2033
- Table 70: South Africa Tamper Evident Delivery Bag Volume (K) Forecast, by Application 2020 & 2033
- Table 71: Rest of Middle East & Africa Tamper Evident Delivery Bag Revenue (million) Forecast, by Application 2020 & 2033
- Table 72: Rest of Middle East & Africa Tamper Evident Delivery Bag Volume (K) Forecast, by Application 2020 & 2033
- Table 73: Global Tamper Evident Delivery Bag Revenue million Forecast, by Application 2020 & 2033
- Table 74: Global Tamper Evident Delivery Bag Volume K Forecast, by Application 2020 & 2033
- Table 75: Global Tamper Evident Delivery Bag Revenue million Forecast, by Type 2020 & 2033
- Table 76: Global Tamper Evident Delivery Bag Volume K Forecast, by Type 2020 & 2033
- Table 77: Global Tamper Evident Delivery Bag Revenue million Forecast, by Country 2020 & 2033
- Table 78: Global Tamper Evident Delivery Bag Volume K Forecast, by Country 2020 & 2033
- Table 79: China Tamper Evident Delivery Bag Revenue (million) Forecast, by Application 2020 & 2033
- Table 80: China Tamper Evident Delivery Bag Volume (K) Forecast, by Application 2020 & 2033
- Table 81: India Tamper Evident Delivery Bag Revenue (million) Forecast, by Application 2020 & 2033
- Table 82: India Tamper Evident Delivery Bag Volume (K) Forecast, by Application 2020 & 2033
- Table 83: Japan Tamper Evident Delivery Bag Revenue (million) Forecast, by Application 2020 & 2033
- Table 84: Japan Tamper Evident Delivery Bag Volume (K) Forecast, by Application 2020 & 2033
- Table 85: South Korea Tamper Evident Delivery Bag Revenue (million) Forecast, by Application 2020 & 2033
- Table 86: South Korea Tamper Evident Delivery Bag Volume (K) Forecast, by Application 2020 & 2033
- Table 87: ASEAN Tamper Evident Delivery Bag Revenue (million) Forecast, by Application 2020 & 2033
- Table 88: ASEAN Tamper Evident Delivery Bag Volume (K) Forecast, by Application 2020 & 2033
- Table 89: Oceania Tamper Evident Delivery Bag Revenue (million) Forecast, by Application 2020 & 2033
- Table 90: Oceania Tamper Evident Delivery Bag Volume (K) Forecast, by Application 2020 & 2033
- Table 91: Rest of Asia Pacific Tamper Evident Delivery Bag Revenue (million) Forecast, by Application 2020 & 2033
- Table 92: Rest of Asia Pacific Tamper Evident Delivery Bag Volume (K) Forecast, by Application 2020 & 2033
Frequently Asked Questions
1. What is the projected Compound Annual Growth Rate (CAGR) of the Tamper Evident Delivery Bag?
The projected CAGR is approximately 2.3%.
2. Which companies are prominent players in the Tamper Evident Delivery Bag?
Key companies in the market include PAC Worldwide, Dynaflex, Block and Company, orfix, NELMAR, ProAmpac, Westpak, Pak Solutions, Packman, Berry Global, Novolex, Alte-Rego, Adsure, DynaCorp, Versapak, IPS Industries, Shanghai Xinfan Industrial Corporation, SoundSeal.
3. What are the main segments of the Tamper Evident Delivery Bag?
The market segments include Application, Type.
4. Can you provide details about the market size?
The market size is estimated to be USD 822 million as of 2022.
5. What are some drivers contributing to market growth?
N/A
6. What are the notable trends driving market growth?
N/A
7. Are there any restraints impacting market growth?
N/A
8. Can you provide examples of recent developments in the market?
N/A
9. What pricing options are available for accessing the report?
Pricing options include single-user, multi-user, and enterprise licenses priced at USD 3950.00, USD 5925.00, and USD 7900.00 respectively.
10. Is the market size provided in terms of value or volume?
The market size is provided in terms of value, measured in million and volume, measured in K.
11. Are there any specific market keywords associated with the report?
Yes, the market keyword associated with the report is "Tamper Evident Delivery Bag," which aids in identifying and referencing the specific market segment covered.
12. How do I determine which pricing option suits my needs best?
The pricing options vary based on user requirements and access needs. Individual users may opt for single-user licenses, while businesses requiring broader access may choose multi-user or enterprise licenses for cost-effective access to the report.
13. Are there any additional resources or data provided in the Tamper Evident Delivery Bag report?
While the report offers comprehensive insights, it's advisable to review the specific contents or supplementary materials provided to ascertain if additional resources or data are available.
14. How can I stay updated on further developments or reports in the Tamper Evident Delivery Bag?
To stay informed about further developments, trends, and reports in the Tamper Evident Delivery Bag, consider subscribing to industry newsletters, following relevant companies and organizations, or regularly checking reputable industry news sources and publications.
Methodology
Step 1 - Identification of Relevant Samples Size from Population Database


Step 2 - Approaches for Defining Global Market Size (Value, Volume* & Price*)

Note*: In applicable scenarios
Step 3 - Data Sources
Primary Research
- Web Analytics
- Survey Reports
- Research Institute
- Latest Research Reports
- Opinion Leaders
Secondary Research
- Annual Reports
- White Paper
- Latest Press Release
- Industry Association
- Paid Database
- Investor Presentations

Step 4 - Data Triangulation
Involves using different sources of information in order to increase the validity of a study
These sources are likely to be stakeholders in a program - participants, other researchers, program staff, other community members, and so on.
Then we put all data in single framework & apply various statistical tools to find out the dynamic on the market.
During the analysis stage, feedback from the stakeholder groups would be compared to determine areas of agreement as well as areas of divergence