

Key Insights
The Southeast Asia cross-border e-commerce market is poised for substantial expansion, propelled by escalating internet and smartphone adoption, a growing middle class with increased disposable income, and a strong consumer preference for convenience and broader product availability. The market, valued at 201.92 billion in 2024, is projected to achieve a Compound Annual Growth Rate (CAGR) of 21.13% between 2025 and 2033. Key growth catalysts include enhancements in logistics infrastructure, the proliferation of digital payment solutions, and the widespread integration of e-commerce platforms by both B2B and B2C enterprises. The market is segmented by business type (B2B, B2C), product category (fashion, electronics, home goods, beauty, etc.), and key countries (Singapore, Thailand, Vietnam, Indonesia, Malaysia, Philippines, and others in Southeast Asia). Despite existing hurdles like intermittent internet access and logistical/regulatory complexities, the market outlook remains exceptionally positive.
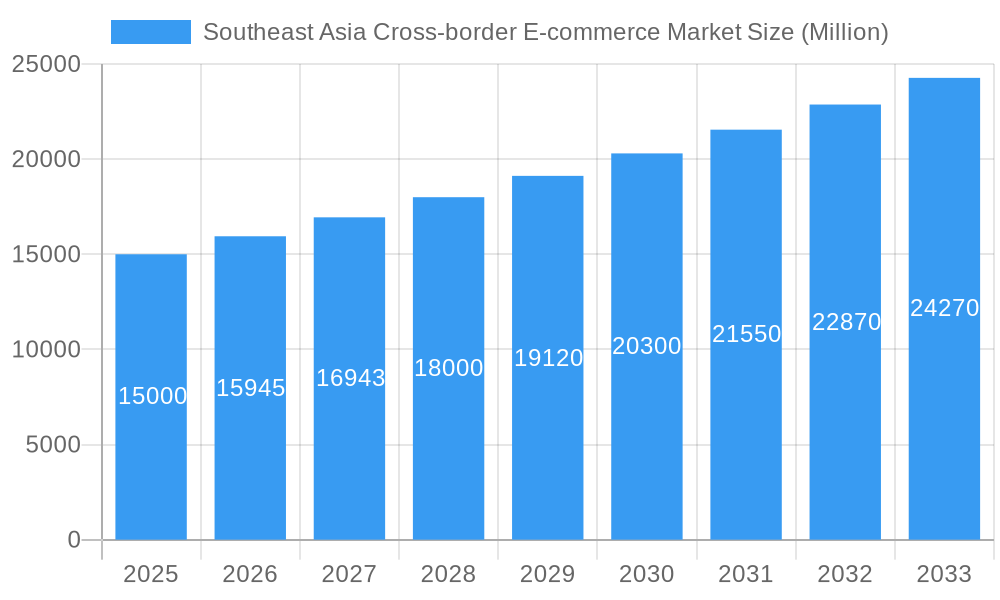
Southeast Asia Cross-border E-commerce Market Market Size (In Billion)
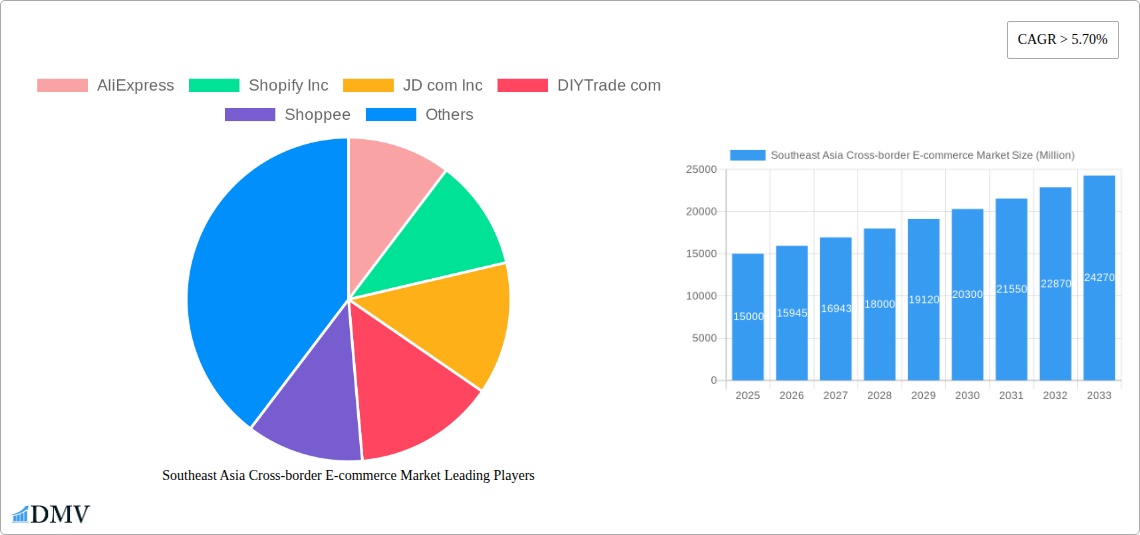
The competitive arena is dynamic, featuring global leaders such as Amazon, Alibaba, and eBay, alongside dominant regional players including Shopee, Lazada, and Tokopedia. These companies are actively investing in technology, logistics, and marketing to secure market share. While the B2C segment currently leads, the B2B sector is anticipated to experience significant growth, driven by demand for efficient sourcing and supply chain management. Growth will be particularly pronounced in populous nations with rapidly expanding e-commerce adoption rates, such as Indonesia, Vietnam, and the Philippines. Success in this evolving market necessitates a deep understanding of consumer preferences and agile adaptation to local market dynamics. The diverse product landscape presents numerous opportunities for businesses of all scales.
Southeast Asia Cross-border E-commerce Market Company Market Share
Southeast Asia Cross-border E-commerce Market: A Comprehensive Report (2019-2033)
This insightful report provides a detailed analysis of the burgeoning Southeast Asia cross-border e-commerce market, offering a comprehensive overview of its current state and future trajectory. Covering the period from 2019 to 2033, with a base year of 2025 and a forecast period from 2025 to 2033, this study is essential for stakeholders seeking to understand and capitalize on this rapidly expanding sector. The market is valued at xx Million in 2025 and is projected to reach xx Million by 2033, showcasing immense growth potential.
Southeast Asia Cross-border E-commerce Market Composition & Trends
This section dives deep into the intricate composition of the Southeast Asia cross-border e-commerce market, examining key trends that shape its evolution. We analyze market concentration, revealing the dominant players and their respective market shares. We explore the innovative technologies driving growth, including advancements in logistics, payment gateways, and digital marketing. The regulatory landscape across different Southeast Asian nations is meticulously examined, highlighting both supportive policies and potential challenges. Furthermore, the report analyzes substitute products, consumer preferences, and the impact of mergers and acquisitions (M&A) activities, including deal values and their influence on market dynamics. The analysis incorporates data on end-user profiles, offering valuable insights into consumer behavior and purchasing patterns.
- Market Share Distribution: A detailed breakdown of market share amongst key players like Shopee, Lazada, and others will be provided, illustrating the competitive landscape.
- M&A Activity: Analysis of significant M&A deals, including deal values (in Millions) and their impact on market consolidation. For instance, the Razorpay-Curlec deal illustrates expansion strategies.
- Innovation Catalysts: Exploration of technological advancements driving growth, such as improved logistics and mobile payment adoption.
- Regulatory Landscape: A country-by-country assessment of regulatory frameworks influencing cross-border e-commerce.
Southeast Asia Cross-border E-commerce Market Industry Evolution
This section provides a comprehensive analysis of the evolutionary trajectory of the Southeast Asia cross-border e-commerce market from 2019 to 2024 and projected growth to 2033. We explore the historical growth rates and project future trajectories, highlighting key factors influencing the market’s expansion. The report also delves into technological advancements, including the role of mobile commerce, social commerce, and the adoption of innovative payment solutions like Buy Now Pay Later (BNPL). Shifting consumer demands and evolving purchasing behaviors are also analyzed, providing a nuanced understanding of market dynamics. The impact of global events, geopolitical shifts and economic conditions on cross border trade will also be considered. Specific data points, such as year-on-year growth rates and adoption metrics for key technologies, will be provided.
Leading Regions, Countries, or Segments in Southeast Asia Cross-border E-commerce Market
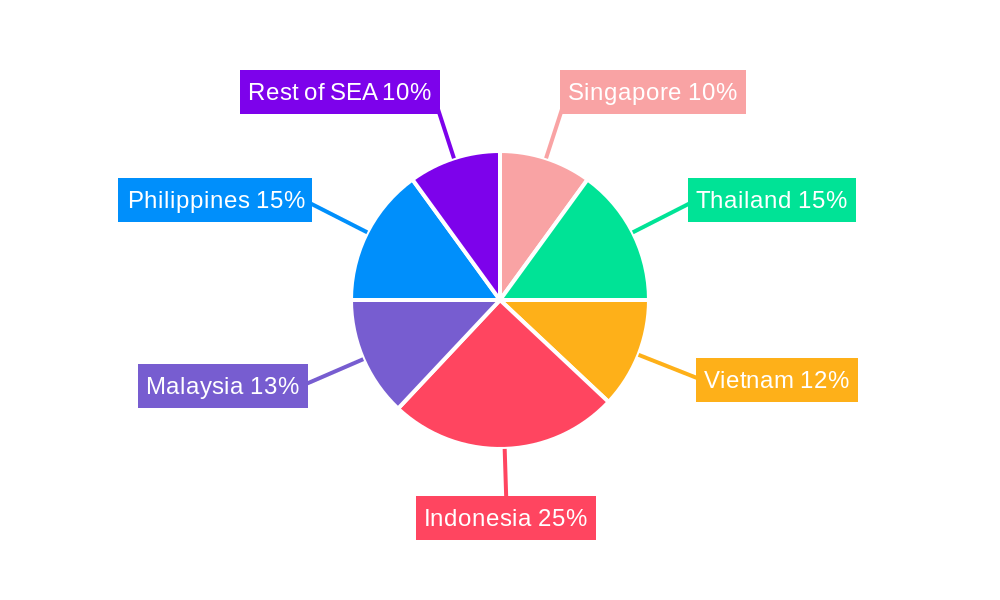
This section identifies the leading regions, countries, and segments within the Southeast Asia cross-border e-commerce market. It pinpoints the dominant players and analyzes the reasons behind their success. We delve into the factors contributing to the growth of each segment, including B2B and B2C models and product categories like Fashion and Apparel, Consumer Electronics, and others. A thorough analysis will be conducted on individual countries including Singapore, Thailand, Vietnam, Indonesia, Malaysia, and the Philippines, along with the "Rest of Southeast Asia" category.
Key Drivers (By Segment & Country):
- Investment Trends: Analysis of foreign direct investment (FDI) and venture capital flows into each segment and country.
- Regulatory Support: Evaluation of government policies and initiatives that promote cross-border e-commerce.
- Market Size: Detailed breakdown of market size (in Millions) for each segment and country.
Dominance Factors: In-depth analysis of factors driving the dominance of specific regions, countries, or segments. For example, Indonesia's large population and increasing internet penetration.
Southeast Asia Cross-border E-commerce Market Product Innovations
This section examines the innovative products and services shaping the Southeast Asia cross-border e-commerce market. We discuss the unique selling propositions (USPs) of these offerings, highlighting technological advancements and their impact on consumer experience. Performance metrics will be used to assess the success of these innovations. Examples of innovative logistics solutions, personalized recommendations, and new payment technologies will be included.
Propelling Factors for Southeast Asia Cross-border E-commerce Market Growth
Several key factors are propelling the growth of the Southeast Asia cross-border e-commerce market. Technological advancements like improved logistics and mobile payment solutions are significantly contributing to market expansion. Economic factors, such as rising disposable incomes and increased internet penetration, are also playing a crucial role. Supportive government policies and regulatory frameworks further enhance growth. For example, the increasing adoption of BNPL services fuels the market's growth.
Obstacles in the Southeast Asia Cross-border E-commerce Market
Despite its immense potential, the Southeast Asia cross-border e-commerce market faces several challenges. Regulatory complexities and inconsistencies across different countries create hurdles for businesses. Supply chain disruptions, including logistics bottlenecks and customs delays, can negatively impact efficiency. Intense competition amongst both local and international players creates pressure on pricing and profitability. These obstacles collectively affect market expansion and need careful consideration.
Future Opportunities in Southeast Asia Cross-border E-commerce Market
The future of the Southeast Asia cross-border e-commerce market holds immense promise. Untapped markets in less-developed regions present significant opportunities for expansion. The adoption of emerging technologies, such as artificial intelligence (AI) and blockchain, will further enhance efficiency and security. Evolving consumer preferences, including a growing demand for personalized experiences and sustainable products, create new avenues for growth.
Major Players in the Southeast Asia Cross-border E-commerce Market Ecosystem
The Southeast Asia cross-border e-commerce market is populated by a diverse range of players, both established and emerging. Key players include:
- AliExpress
- Shopify Inc
- JD.com Inc
- DIYTrade.com
- Shopee
- Lazada
- ChinaAseanTrade.com
- Bukalapak
- Amazon.com Inc
- Qoo
- eBay Inc
- Tokopedia
- Alibaba Group Holding Limited
List Not Exhaustive
Key Developments in Southeast Asia Cross-border E-commerce Market Industry
- September 2022: Akulaku's partnership with Alipay+ expands BNPL options for Indonesian consumers, boosting cross-border payments.
- February 2022: Razorpay's acquisition of Curlec signifies the expansion of fintech solutions into the Southeast Asian market, supporting recurring payments for businesses.
Strategic Southeast Asia Cross-border E-commerce Market Forecast
The Southeast Asia cross-border e-commerce market is poised for continued robust growth, driven by increasing digital adoption, favorable government policies, and the expansion of fintech solutions. The market's potential is vast, and strategic investments in infrastructure, logistics, and technological innovation will further accelerate its expansion. The growing middle class and rising smartphone penetration will contribute to sustained market expansion.
Southeast Asia Cross-border E-commerce Market Segmentation
-
1. Business
- 1.1. B2B
- 1.2. B2C
-
2. Product
- 2.1. Fashion and Apparel
- 2.2. Consumer Electronics
- 2.3. Home Appliances
- 2.4. Furniture
- 2.5. Beauty and Personal Care Products
- 2.6. Other Products (Toys, Food Products, etc.)
Southeast Asia Cross-border E-commerce Market Segmentation By Geography
-
1. North America
- 1.1. United States
- 1.2. Canada
- 1.3. Mexico
-
2. South America
- 2.1. Brazil
- 2.2. Argentina
- 2.3. Rest of South America
-
3. Europe
- 3.1. United Kingdom
- 3.2. Germany
- 3.3. France
- 3.4. Italy
- 3.5. Spain
- 3.6. Russia
- 3.7. Benelux
- 3.8. Nordics
- 3.9. Rest of Europe
-
4. Middle East & Africa
- 4.1. Turkey
- 4.2. Israel
- 4.3. GCC
- 4.4. North Africa
- 4.5. South Africa
- 4.6. Rest of Middle East & Africa
-
5. Asia Pacific
- 5.1. China
- 5.2. India
- 5.3. Japan
- 5.4. South Korea
- 5.5. ASEAN
- 5.6. Oceania
- 5.7. Rest of Asia Pacific
Southeast Asia Cross-border E-commerce Market Regional Market Share
Geographic Coverage of Southeast Asia Cross-border E-commerce Market
Southeast Asia Cross-border E-commerce Market REPORT HIGHLIGHTS
| Aspects | Details |
|---|---|
| Study Period | 2020-2034 |
| Base Year | 2025 |
| Estimated Year | 2026 |
| Forecast Period | 2026-2034 |
| Historical Period | 2020-2025 |
| Growth Rate | CAGR of 21.13% from 2020-2034 |
| Segmentation |
|
Table of Contents
- 1. Introduction
- 1.1. Research Scope
- 1.2. Market Segmentation
- 1.3. Research Objective
- 1.4. Definitions and Assumptions
- 2. Executive Summary
- 2.1. Market Snapshot
- 3. Market Dynamics
- 3.1. Market Drivers
- 3.2. Market Restrains
- 3.3. Market Trends
- 3.4. Market Opportunities
- 4. Market Factor Analysis
- 4.1. Porters Five Forces
- 4.1.1. Bargaining Power of Suppliers
- 4.1.2. Bargaining Power of Buyers
- 4.1.3. Threat of New Entrants
- 4.1.4. Threat of Substitutes
- 4.1.5. Competitive Rivalry
- 4.2. PESTEL analysis
- 4.3. BCG Analysis
- 4.3.1. Stars (High Growth, High Market Share)
- 4.3.2. Cash Cows (Low Growth, High Market Share)
- 4.3.3. Question Mark (High Growth, Low Market Share)
- 4.3.4. Dogs (Low Growth, Low Market Share)
- 4.4. Ansoff Matrix Analysis
- 4.5. Supply Chain Analysis
- 4.6. Regulatory Landscape
- 4.7. Current Market Potential and Opportunity Assessment (TAM–SAM–SOM Framework)
- 4.8. DMV Analyst Note
- 4.1. Porters Five Forces
- 5. Market Analysis, Insights and Forecast 2021-2033
- 5.1. Market Analysis, Insights and Forecast - by Business
- 5.1.1. B2B
- 5.1.2. B2C
- 5.2. Market Analysis, Insights and Forecast - by Product
- 5.2.1. Fashion and Apparel
- 5.2.2. Consumer Electronics
- 5.2.3. Home Appliances
- 5.2.4. Furniture
- 5.2.5. Beauty and Personal Care Products
- 5.2.6. Other Products (Toys, Food Products, etc.)
- 5.3. Market Analysis, Insights and Forecast - by Region
- 5.3.1. North America
- 5.3.2. South America
- 5.3.3. Europe
- 5.3.4. Middle East & Africa
- 5.3.5. Asia Pacific
- 5.1. Market Analysis, Insights and Forecast - by Business
- 6. Global Southeast Asia Cross-border E-commerce Market Analysis, Insights and Forecast, 2021-2033
- 6.1. Market Analysis, Insights and Forecast - by Business
- 6.1.1. B2B
- 6.1.2. B2C
- 6.2. Market Analysis, Insights and Forecast - by Product
- 6.2.1. Fashion and Apparel
- 6.2.2. Consumer Electronics
- 6.2.3. Home Appliances
- 6.2.4. Furniture
- 6.2.5. Beauty and Personal Care Products
- 6.2.6. Other Products (Toys, Food Products, etc.)
- 6.1. Market Analysis, Insights and Forecast - by Business
- 7. North America Southeast Asia Cross-border E-commerce Market Analysis, Insights and Forecast, 2020-2032
- 7.1. Market Analysis, Insights and Forecast - by Business
- 7.1.1. B2B
- 7.1.2. B2C
- 7.2. Market Analysis, Insights and Forecast - by Product
- 7.2.1. Fashion and Apparel
- 7.2.2. Consumer Electronics
- 7.2.3. Home Appliances
- 7.2.4. Furniture
- 7.2.5. Beauty and Personal Care Products
- 7.2.6. Other Products (Toys, Food Products, etc.)
- 7.1. Market Analysis, Insights and Forecast - by Business
- 8. South America Southeast Asia Cross-border E-commerce Market Analysis, Insights and Forecast, 2020-2032
- 8.1. Market Analysis, Insights and Forecast - by Business
- 8.1.1. B2B
- 8.1.2. B2C
- 8.2. Market Analysis, Insights and Forecast - by Product
- 8.2.1. Fashion and Apparel
- 8.2.2. Consumer Electronics
- 8.2.3. Home Appliances
- 8.2.4. Furniture
- 8.2.5. Beauty and Personal Care Products
- 8.2.6. Other Products (Toys, Food Products, etc.)
- 8.1. Market Analysis, Insights and Forecast - by Business
- 9. Europe Southeast Asia Cross-border E-commerce Market Analysis, Insights and Forecast, 2020-2032
- 9.1. Market Analysis, Insights and Forecast - by Business
- 9.1.1. B2B
- 9.1.2. B2C
- 9.2. Market Analysis, Insights and Forecast - by Product
- 9.2.1. Fashion and Apparel
- 9.2.2. Consumer Electronics
- 9.2.3. Home Appliances
- 9.2.4. Furniture
- 9.2.5. Beauty and Personal Care Products
- 9.2.6. Other Products (Toys, Food Products, etc.)
- 9.1. Market Analysis, Insights and Forecast - by Business
- 10. Middle East & Africa Southeast Asia Cross-border E-commerce Market Analysis, Insights and Forecast, 2020-2032
- 10.1. Market Analysis, Insights and Forecast - by Business
- 10.1.1. B2B
- 10.1.2. B2C
- 10.2. Market Analysis, Insights and Forecast - by Product
- 10.2.1. Fashion and Apparel
- 10.2.2. Consumer Electronics
- 10.2.3. Home Appliances
- 10.2.4. Furniture
- 10.2.5. Beauty and Personal Care Products
- 10.2.6. Other Products (Toys, Food Products, etc.)
- 10.1. Market Analysis, Insights and Forecast - by Business
- 11. Asia Pacific Southeast Asia Cross-border E-commerce Market Analysis, Insights and Forecast, 2020-2032
- 11.1. Market Analysis, Insights and Forecast - by Business
- 11.1.1. B2B
- 11.1.2. B2C
- 11.2. Market Analysis, Insights and Forecast - by Product
- 11.2.1. Fashion and Apparel
- 11.2.2. Consumer Electronics
- 11.2.3. Home Appliances
- 11.2.4. Furniture
- 11.2.5. Beauty and Personal Care Products
- 11.2.6. Other Products (Toys, Food Products, etc.)
- 11.1. Market Analysis, Insights and Forecast - by Business
- 12. Competitive Analysis
- 12.1. Company Profiles
- 12.1.1 AliExpress
- 12.1.1.1. Company Overview
- 12.1.1.2. Products
- 12.1.1.3. Company Financials
- 12.1.1.4. SWOT Analysis
- 12.1.2 Shopify Inc
- 12.1.2.1. Company Overview
- 12.1.2.2. Products
- 12.1.2.3. Company Financials
- 12.1.2.4. SWOT Analysis
- 12.1.3 JD com Inc
- 12.1.3.1. Company Overview
- 12.1.3.2. Products
- 12.1.3.3. Company Financials
- 12.1.3.4. SWOT Analysis
- 12.1.4 DIYTrade com
- 12.1.4.1. Company Overview
- 12.1.4.2. Products
- 12.1.4.3. Company Financials
- 12.1.4.4. SWOT Analysis
- 12.1.5 Shoppee
- 12.1.5.1. Company Overview
- 12.1.5.2. Products
- 12.1.5.3. Company Financials
- 12.1.5.4. SWOT Analysis
- 12.1.6 Lazada
- 12.1.6.1. Company Overview
- 12.1.6.2. Products
- 12.1.6.3. Company Financials
- 12.1.6.4. SWOT Analysis
- 12.1.7 ChinaAseanTrade com
- 12.1.7.1. Company Overview
- 12.1.7.2. Products
- 12.1.7.3. Company Financials
- 12.1.7.4. SWOT Analysis
- 12.1.8 Bukalapak
- 12.1.8.1. Company Overview
- 12.1.8.2. Products
- 12.1.8.3. Company Financials
- 12.1.8.4. SWOT Analysis
- 12.1.9 Amazon com Inc
- 12.1.9.1. Company Overview
- 12.1.9.2. Products
- 12.1.9.3. Company Financials
- 12.1.9.4. SWOT Analysis
- 12.1.10 Qoo
- 12.1.10.1. Company Overview
- 12.1.10.2. Products
- 12.1.10.3. Company Financials
- 12.1.10.4. SWOT Analysis
- 12.1.11 eBay Inc
- 12.1.11.1. Company Overview
- 12.1.11.2. Products
- 12.1.11.3. Company Financials
- 12.1.11.4. SWOT Analysis
- 12.1.12 Tokopedia
- 12.1.12.1. Company Overview
- 12.1.12.2. Products
- 12.1.12.3. Company Financials
- 12.1.12.4. SWOT Analysis
- 12.1.13 Alibaba Group Holding Limited **List Not Exhaustive
- 12.1.13.1. Company Overview
- 12.1.13.2. Products
- 12.1.13.3. Company Financials
- 12.1.13.4. SWOT Analysis
- 12.1.1 AliExpress
- 12.2. Market Entropy
- 12.2.1 Company's Key Areas Served
- 12.2.2 Recent Developments
- 12.3. Company Market Share Analysis 2025
- 12.3.1 Top 5 Companies Market Share Analysis
- 12.3.2 Top 3 Companies Market Share Analysis
- 12.4. List of Potential Customers
- 13. Research Methodology
List of Figures
- Figure 1: Global Southeast Asia Cross-border E-commerce Market Revenue Breakdown (billion, %) by Region 2025 & 2033
- Figure 2: North America Southeast Asia Cross-border E-commerce Market Revenue (billion), by Business 2025 & 2033
- Figure 3: North America Southeast Asia Cross-border E-commerce Market Revenue Share (%), by Business 2025 & 2033
- Figure 4: North America Southeast Asia Cross-border E-commerce Market Revenue (billion), by Product 2025 & 2033
- Figure 5: North America Southeast Asia Cross-border E-commerce Market Revenue Share (%), by Product 2025 & 2033
- Figure 6: North America Southeast Asia Cross-border E-commerce Market Revenue (billion), by Country 2025 & 2033
- Figure 7: North America Southeast Asia Cross-border E-commerce Market Revenue Share (%), by Country 2025 & 2033
- Figure 8: South America Southeast Asia Cross-border E-commerce Market Revenue (billion), by Business 2025 & 2033
- Figure 9: South America Southeast Asia Cross-border E-commerce Market Revenue Share (%), by Business 2025 & 2033
- Figure 10: South America Southeast Asia Cross-border E-commerce Market Revenue (billion), by Product 2025 & 2033
- Figure 11: South America Southeast Asia Cross-border E-commerce Market Revenue Share (%), by Product 2025 & 2033
- Figure 12: South America Southeast Asia Cross-border E-commerce Market Revenue (billion), by Country 2025 & 2033
- Figure 13: South America Southeast Asia Cross-border E-commerce Market Revenue Share (%), by Country 2025 & 2033
- Figure 14: Europe Southeast Asia Cross-border E-commerce Market Revenue (billion), by Business 2025 & 2033
- Figure 15: Europe Southeast Asia Cross-border E-commerce Market Revenue Share (%), by Business 2025 & 2033
- Figure 16: Europe Southeast Asia Cross-border E-commerce Market Revenue (billion), by Product 2025 & 2033
- Figure 17: Europe Southeast Asia Cross-border E-commerce Market Revenue Share (%), by Product 2025 & 2033
- Figure 18: Europe Southeast Asia Cross-border E-commerce Market Revenue (billion), by Country 2025 & 2033
- Figure 19: Europe Southeast Asia Cross-border E-commerce Market Revenue Share (%), by Country 2025 & 2033
- Figure 20: Middle East & Africa Southeast Asia Cross-border E-commerce Market Revenue (billion), by Business 2025 & 2033
- Figure 21: Middle East & Africa Southeast Asia Cross-border E-commerce Market Revenue Share (%), by Business 2025 & 2033
- Figure 22: Middle East & Africa Southeast Asia Cross-border E-commerce Market Revenue (billion), by Product 2025 & 2033
- Figure 23: Middle East & Africa Southeast Asia Cross-border E-commerce Market Revenue Share (%), by Product 2025 & 2033
- Figure 24: Middle East & Africa Southeast Asia Cross-border E-commerce Market Revenue (billion), by Country 2025 & 2033
- Figure 25: Middle East & Africa Southeast Asia Cross-border E-commerce Market Revenue Share (%), by Country 2025 & 2033
- Figure 26: Asia Pacific Southeast Asia Cross-border E-commerce Market Revenue (billion), by Business 2025 & 2033
- Figure 27: Asia Pacific Southeast Asia Cross-border E-commerce Market Revenue Share (%), by Business 2025 & 2033
- Figure 28: Asia Pacific Southeast Asia Cross-border E-commerce Market Revenue (billion), by Product 2025 & 2033
- Figure 29: Asia Pacific Southeast Asia Cross-border E-commerce Market Revenue Share (%), by Product 2025 & 2033
- Figure 30: Asia Pacific Southeast Asia Cross-border E-commerce Market Revenue (billion), by Country 2025 & 2033
- Figure 31: Asia Pacific Southeast Asia Cross-border E-commerce Market Revenue Share (%), by Country 2025 & 2033
List of Tables
- Table 1: Global Southeast Asia Cross-border E-commerce Market Revenue billion Forecast, by Business 2020 & 2033
- Table 2: Global Southeast Asia Cross-border E-commerce Market Revenue billion Forecast, by Product 2020 & 2033
- Table 3: Global Southeast Asia Cross-border E-commerce Market Revenue billion Forecast, by Region 2020 & 2033
- Table 4: Global Southeast Asia Cross-border E-commerce Market Revenue billion Forecast, by Business 2020 & 2033
- Table 5: Global Southeast Asia Cross-border E-commerce Market Revenue billion Forecast, by Product 2020 & 2033
- Table 6: Global Southeast Asia Cross-border E-commerce Market Revenue billion Forecast, by Country 2020 & 2033
- Table 7: United States Southeast Asia Cross-border E-commerce Market Revenue (billion) Forecast, by Application 2020 & 2033
- Table 8: Canada Southeast Asia Cross-border E-commerce Market Revenue (billion) Forecast, by Application 2020 & 2033
- Table 9: Mexico Southeast Asia Cross-border E-commerce Market Revenue (billion) Forecast, by Application 2020 & 2033
- Table 10: Global Southeast Asia Cross-border E-commerce Market Revenue billion Forecast, by Business 2020 & 2033
- Table 11: Global Southeast Asia Cross-border E-commerce Market Revenue billion Forecast, by Product 2020 & 2033
- Table 12: Global Southeast Asia Cross-border E-commerce Market Revenue billion Forecast, by Country 2020 & 2033
- Table 13: Brazil Southeast Asia Cross-border E-commerce Market Revenue (billion) Forecast, by Application 2020 & 2033
- Table 14: Argentina Southeast Asia Cross-border E-commerce Market Revenue (billion) Forecast, by Application 2020 & 2033
- Table 15: Rest of South America Southeast Asia Cross-border E-commerce Market Revenue (billion) Forecast, by Application 2020 & 2033
- Table 16: Global Southeast Asia Cross-border E-commerce Market Revenue billion Forecast, by Business 2020 & 2033
- Table 17: Global Southeast Asia Cross-border E-commerce Market Revenue billion Forecast, by Product 2020 & 2033
- Table 18: Global Southeast Asia Cross-border E-commerce Market Revenue billion Forecast, by Country 2020 & 2033
- Table 19: United Kingdom Southeast Asia Cross-border E-commerce Market Revenue (billion) Forecast, by Application 2020 & 2033
- Table 20: Germany Southeast Asia Cross-border E-commerce Market Revenue (billion) Forecast, by Application 2020 & 2033
- Table 21: France Southeast Asia Cross-border E-commerce Market Revenue (billion) Forecast, by Application 2020 & 2033
- Table 22: Italy Southeast Asia Cross-border E-commerce Market Revenue (billion) Forecast, by Application 2020 & 2033
- Table 23: Spain Southeast Asia Cross-border E-commerce Market Revenue (billion) Forecast, by Application 2020 & 2033
- Table 24: Russia Southeast Asia Cross-border E-commerce Market Revenue (billion) Forecast, by Application 2020 & 2033
- Table 25: Benelux Southeast Asia Cross-border E-commerce Market Revenue (billion) Forecast, by Application 2020 & 2033
- Table 26: Nordics Southeast Asia Cross-border E-commerce Market Revenue (billion) Forecast, by Application 2020 & 2033
- Table 27: Rest of Europe Southeast Asia Cross-border E-commerce Market Revenue (billion) Forecast, by Application 2020 & 2033
- Table 28: Global Southeast Asia Cross-border E-commerce Market Revenue billion Forecast, by Business 2020 & 2033
- Table 29: Global Southeast Asia Cross-border E-commerce Market Revenue billion Forecast, by Product 2020 & 2033
- Table 30: Global Southeast Asia Cross-border E-commerce Market Revenue billion Forecast, by Country 2020 & 2033
- Table 31: Turkey Southeast Asia Cross-border E-commerce Market Revenue (billion) Forecast, by Application 2020 & 2033
- Table 32: Israel Southeast Asia Cross-border E-commerce Market Revenue (billion) Forecast, by Application 2020 & 2033
- Table 33: GCC Southeast Asia Cross-border E-commerce Market Revenue (billion) Forecast, by Application 2020 & 2033
- Table 34: North Africa Southeast Asia Cross-border E-commerce Market Revenue (billion) Forecast, by Application 2020 & 2033
- Table 35: South Africa Southeast Asia Cross-border E-commerce Market Revenue (billion) Forecast, by Application 2020 & 2033
- Table 36: Rest of Middle East & Africa Southeast Asia Cross-border E-commerce Market Revenue (billion) Forecast, by Application 2020 & 2033
- Table 37: Global Southeast Asia Cross-border E-commerce Market Revenue billion Forecast, by Business 2020 & 2033
- Table 38: Global Southeast Asia Cross-border E-commerce Market Revenue billion Forecast, by Product 2020 & 2033
- Table 39: Global Southeast Asia Cross-border E-commerce Market Revenue billion Forecast, by Country 2020 & 2033
- Table 40: China Southeast Asia Cross-border E-commerce Market Revenue (billion) Forecast, by Application 2020 & 2033
- Table 41: India Southeast Asia Cross-border E-commerce Market Revenue (billion) Forecast, by Application 2020 & 2033
- Table 42: Japan Southeast Asia Cross-border E-commerce Market Revenue (billion) Forecast, by Application 2020 & 2033
- Table 43: South Korea Southeast Asia Cross-border E-commerce Market Revenue (billion) Forecast, by Application 2020 & 2033
- Table 44: ASEAN Southeast Asia Cross-border E-commerce Market Revenue (billion) Forecast, by Application 2020 & 2033
- Table 45: Oceania Southeast Asia Cross-border E-commerce Market Revenue (billion) Forecast, by Application 2020 & 2033
- Table 46: Rest of Asia Pacific Southeast Asia Cross-border E-commerce Market Revenue (billion) Forecast, by Application 2020 & 2033
Frequently Asked Questions
1. What is the projected Compound Annual Growth Rate (CAGR) of the Southeast Asia Cross-border E-commerce Market?
The projected CAGR is approximately 21.13%.
2. Which companies are prominent players in the Southeast Asia Cross-border E-commerce Market?
Key companies in the market include AliExpress, Shopify Inc, JD com Inc, DIYTrade com, Shoppee, Lazada, ChinaAseanTrade com, Bukalapak, Amazon com Inc, Qoo, eBay Inc, Tokopedia, Alibaba Group Holding Limited **List Not Exhaustive.
3. What are the main segments of the Southeast Asia Cross-border E-commerce Market?
The market segments include Business, Product.
4. Can you provide details about the market size?
The market size is estimated to be USD 201.92 billion as of 2022.
5. What are some drivers contributing to market growth?
4.; Increasing International Trade Driving the Market4.; Increasing online users driving the market.
6. What are the notable trends driving market growth?
Growth in E-commerce sector in the region driving the market.
7. Are there any restraints impacting market growth?
4.; Regulatory Compliance Affecting the Market4.; High Competition in the Market.
8. Can you provide examples of recent developments in the market?
September 2022: Akulaku, a leading Southeast Asian banking and digital finance platform announced a partnership with Alipay+ that will allow Indonesian consumers to use its BNPL solution Akulaku PayLater at Alipay+'s global merchants. Alipay+, a suite of global cross-border digital payments and marketing solutions, will now support Akulaku PayLater, and merchants will be able to accept Akulaku PayLater as a payment method.
9. What pricing options are available for accessing the report?
Pricing options include single-user, multi-user, and enterprise licenses priced at USD 4750, USD 4950, and USD 6800 respectively.
10. Is the market size provided in terms of value or volume?
The market size is provided in terms of value, measured in billion.
11. Are there any specific market keywords associated with the report?
Yes, the market keyword associated with the report is "Southeast Asia Cross-border E-commerce Market," which aids in identifying and referencing the specific market segment covered.
12. How do I determine which pricing option suits my needs best?
The pricing options vary based on user requirements and access needs. Individual users may opt for single-user licenses, while businesses requiring broader access may choose multi-user or enterprise licenses for cost-effective access to the report.
13. Are there any additional resources or data provided in the Southeast Asia Cross-border E-commerce Market report?
While the report offers comprehensive insights, it's advisable to review the specific contents or supplementary materials provided to ascertain if additional resources or data are available.
14. How can I stay updated on further developments or reports in the Southeast Asia Cross-border E-commerce Market?
To stay informed about further developments, trends, and reports in the Southeast Asia Cross-border E-commerce Market, consider subscribing to industry newsletters, following relevant companies and organizations, or regularly checking reputable industry news sources and publications.
Methodology
Step 1 - Identification of Relevant Samples Size from Population Database


Step 2 - Approaches for Defining Global Market Size (Value, Volume* & Price*)

Note*: In applicable scenarios
Step 3 - Data Sources
Primary Research
- Web Analytics
- Survey Reports
- Research Institute
- Latest Research Reports
- Opinion Leaders
Secondary Research
- Annual Reports
- White Paper
- Latest Press Release
- Industry Association
- Paid Database
- Investor Presentations

Step 4 - Data Triangulation
Involves using different sources of information in order to increase the validity of a study
These sources are likely to be stakeholders in a program - participants, other researchers, program staff, other community members, and so on.
Then we put all data in single framework & apply various statistical tools to find out the dynamic on the market.
During the analysis stage, feedback from the stakeholder groups would be compared to determine areas of agreement as well as areas of divergence