

Key Insights
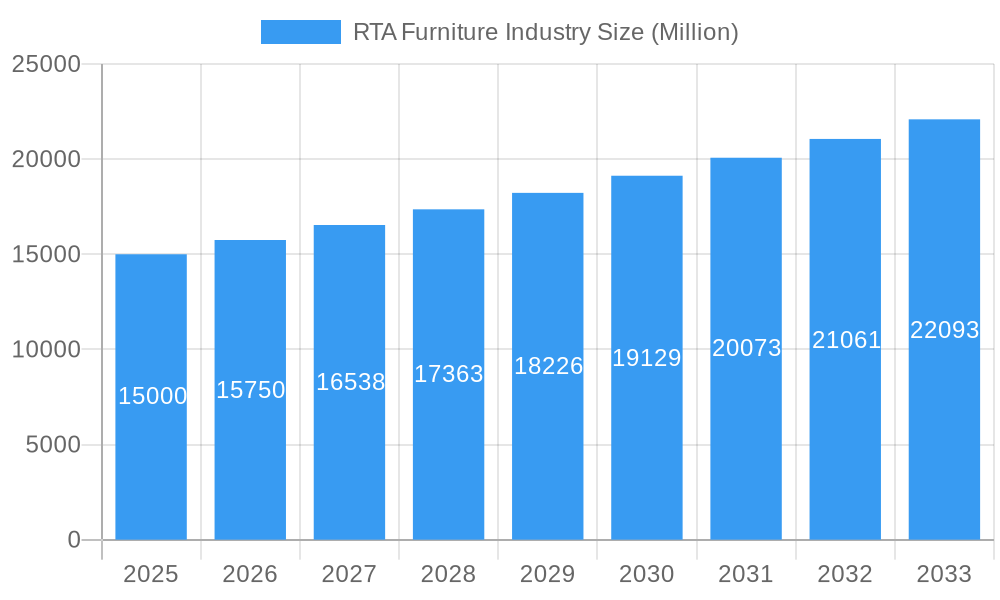
The global Ready-to-Assemble (RTA) furniture market is projected for significant expansion, driven by escalating consumer demand for affordable, convenient, and space-efficient furnishings. Key growth drivers include the burgeoning e-commerce landscape, offering enhanced accessibility and streamlined purchasing, and the increasing prevalence of urban living, necessitating adaptable and easily managed furniture solutions. The RTA segment's broad product portfolio, spanning from tables and chairs to sofas and storage units, caters to a diverse consumer base across various distribution channels, including online marketplaces, specialty retailers, and home centers. While the residential sector currently leads, the commercial sector presents a substantial growth avenue, fueled by the need for cost-effective and modular furniture in workspaces and hospitality. The market is forecasted to reach a size of 18353.4 million by 2025, with a Compound Annual Growth Rate (CAGR) of 7.3% from a base year of 2025.
RTA Furniture Industry Market Size (In Billion)
Despite a robust growth trajectory, the RTA furniture market navigates challenges such as intense competition, necessitating continuous product innovation and brand differentiation. Volatility in raw material prices and consumer concerns regarding product quality and assembly ease are also factors. However, manufacturers are actively mitigating these challenges through enhanced design, superior materials, and simplified assembly guides. Geographically, North America and Europe remain dominant regions, with the Asia-Pacific market exhibiting rapid growth. Future market success will be contingent on the industry's adaptability to evolving consumer preferences, commitment to sustainable practices, and the strategic integration of technology to elevate the customer experience. Targeted expansion into the commercial sector and fortified partnerships with e-commerce platforms will be critical for sustained market leadership.
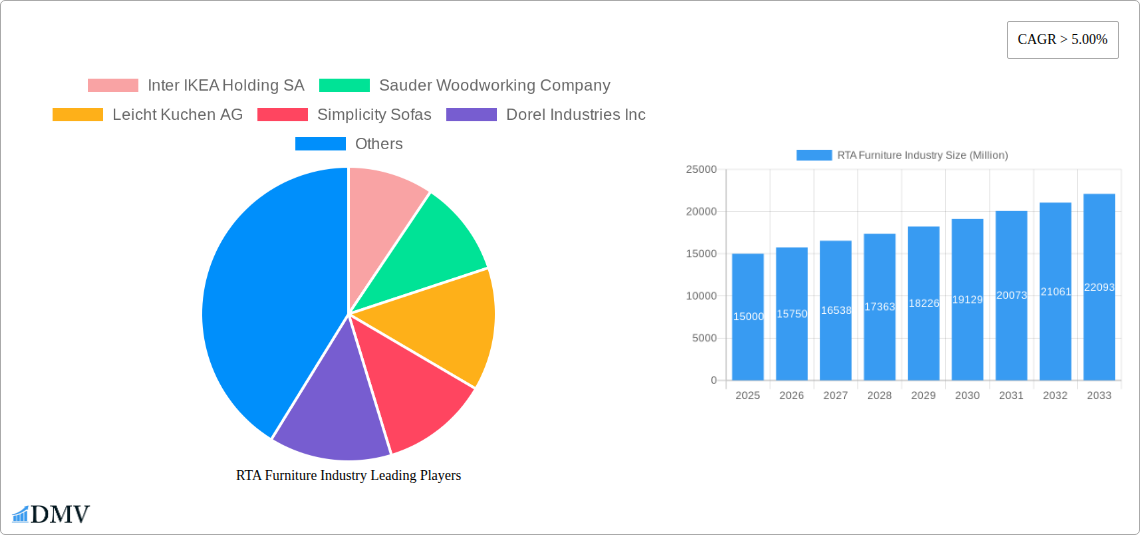
RTA Furniture Industry Company Market Share
Ready-to-Assemble (RTA) Furniture Industry: A Comprehensive Market Analysis 2019-2033
This insightful report provides a comprehensive analysis of the Ready-to-Assemble (RTA) furniture industry, projecting a market value exceeding $XX Million by 2033. The study covers the period 2019-2033, with 2025 as the base and estimated year. This report is invaluable for stakeholders seeking to understand market dynamics, competitive landscapes, and future growth opportunities within this dynamic sector.
RTA Furniture Industry Market Composition & Trends
This section meticulously examines the current state and future trajectory of the RTA furniture market. We delve into market concentration, analyzing the distribution of market share amongst key players like Inter IKEA Holding SA, Sauder Woodworking Company, Leicht Kuchen AG, Simplicity Sofas, Dorel Industries Inc, Bush Industries Inc, Flexsteel (Home Styles), Steinhoff Holding, South Shore Furniture, Whalen Furniture Manufacturing, and other significant players including Prepac Manufacturing Ltd, Venture Horizon Corporation, Nolte Group, Wellemobel GmbH, Tvilum, Alno Group, and Walker Edison Furniture Company LLC. The report also explores innovation catalysts, regulatory landscapes impacting the industry, the prevalence of substitute products, end-user preferences (residential vs. commercial), and the impact of mergers and acquisitions (M&A) activity. We analyze M&A deal values totaling $XX Million during the historical period, revealing significant consolidation within the sector. Market share distribution is analyzed, indicating a [XX]% market share for the top 5 players in 2025.
- Market Concentration: High/Medium/Low (Choose one based on analysis; provide supporting data)
- Innovation Catalysts: Focus on sustainable materials, smart furniture, and customizable options.
- Regulatory Landscape: Analysis of relevant safety, environmental, and labor regulations across key regions.
- Substitute Products: Examination of alternative furniture options and their impact on market share.
- End-User Profiles: Detailed segmentation of residential and commercial users, with insights into their purchasing behavior.
- M&A Activity: Analysis of recent mergers and acquisitions, their financial implications, and strategic rationale.
RTA Furniture Industry Industry Evolution
This section provides a detailed examination of the RTA furniture industry's evolution, covering market growth trajectories, technological advancements, and shifting consumer demands from 2019-2033. We will analyze the impact of e-commerce, changing lifestyles, and the increasing preference for convenience on market growth. The report will provide specific data points, including projected compound annual growth rates (CAGR) of [XX]% for the forecast period (2025-2033). We’ll track the adoption rate of new technologies, such as 3D printing and virtual reality for furniture design and sales. Further, we will explore the evolution of consumer preferences, focusing on trends like minimalist design, multi-functional furniture, and sustainable materials.
Leading Regions, Countries, or Segments in RTA Furniture Industry
This section identifies the dominant regions, countries, and segments within the RTA furniture market. Key drivers of dominance, such as investment trends and regulatory support, are outlined using bullet points, while in-depth analysis of dominance factors is provided in paragraph form. We'll analyze performance across different product categories (Tables, Chairs & Sofas, Storage, Beds, Other Products), distribution channels (Specialty Retailers, Flagship Stores, Home Centers, Online, Designers, Other Distribution Channels), and end-users (Residential, Commercial).
- Dominant Region/Country: [Specify region/country and provide reasons for dominance].
- Key Drivers for Dominance:
- [Bullet point 1: e.g., High disposable income and strong consumer demand]
- [Bullet point 2: e.g., Favorable government policies and incentives]
- [Bullet point 3: e.g., Strong logistics infrastructure]
- Segment Analysis: [In-depth analysis of the performance of each segment]
RTA Furniture Industry Product Innovations
This section details recent product innovations, their applications, and performance metrics. We will highlight unique selling propositions, focusing on features like improved durability, ease of assembly, and customizable design options. Technological advancements, such as the integration of smart technology and the use of sustainable materials, will also be examined. The increasing popularity of modular and multifunctional furniture is also analyzed in this context.
Propelling Factors for RTA Furniture Industry Growth
Several key factors are driving the growth of the RTA furniture industry. These include the increasing demand for affordable and convenient furniture solutions, the rising popularity of online shopping, and the growing adoption of sustainable and eco-friendly materials. Technological advancements in manufacturing and design have also contributed significantly to this growth, leading to improved product quality and affordability. The influence of favorable economic conditions and supportive government policies further accelerate this expansion.
Obstacles in the RTA Furniture Industry Market
The RTA furniture industry faces challenges such as intense competition, fluctuating raw material costs, and concerns about product quality and durability. Supply chain disruptions and logistical complexities add to these challenges, impacting manufacturing and delivery times. Regulatory hurdles and changing environmental standards also pose significant obstacles for businesses operating in this industry. The negative impact of these factors on profitability and market expansion will be quantitatively analyzed.
Future Opportunities in RTA Furniture Industry
Emerging opportunities for the RTA furniture industry include the expansion into new markets, especially in developing economies with growing middle classes. The adoption of new technologies such as augmented reality (AR) and virtual reality (VR) for online furniture visualization and sales presents significant potential. Furthermore, there's a clear opportunity to capitalize on the growing demand for sustainable and eco-friendly furniture, catering to environmentally conscious consumers.
Major Players in the RTA Furniture Industry Ecosystem
- Inter IKEA Holding SA
- Sauder Woodworking Company
- Leicht Kuchen AG
- Simplicity Sofas
- Dorel Industries Inc
- Bush Industries Inc
- Flexsteel (Home Styles)
- Prepac Manufacturing Ltd
- Venture Horizon Corporation
- Nolte Group
- Wellemobel GmbH
- Tvilum
- Alno Group
- Walker Edison Furniture Company LLC
- Steinhoff Holding
- South Shore Furniture
- Whalen Furniture Manufacturing
Key Developments in RTA Furniture Industry Industry
- [Date]: [Development - e.g., Launch of new sustainable furniture line by Company X] [Impact - e.g., Increased market share in eco-friendly segment]
- [Date]: [Development - e.g., Merger between Company Y and Company Z] [Impact - e.g., Enhanced market reach and product diversification]
- [Date]: [Development] [Impact]
- …and so on
Strategic RTA Furniture Industry Market Forecast
The RTA furniture industry is poised for continued growth, driven by several key factors including increasing urbanization, rising disposable incomes, and a shift towards smaller living spaces. Technological advancements, the expanding e-commerce market, and growing preference for convenient and affordable furniture are all contributing to this positive outlook. The market is projected to achieve significant growth during the forecast period, creating lucrative opportunities for established players and new entrants alike.
RTA Furniture Industry Segmentation
-
1. Product
- 1.1. Tables
- 1.2. Chairs and Sofas
- 1.3. Storage
- 1.4. Beds
- 1.5. Other Products
-
2. Distribution Channel
- 2.1. Specialty Retailers
- 2.2. Flagship Stores
- 2.3. Home Centers
- 2.4. Online
- 2.5. Designers
- 2.6. Other Distribution Channels
-
3. End User
- 3.1. Residential
- 3.2. Commercial
RTA Furniture Industry Segmentation By Geography
- 1. North America
- 2. Europe
- 3. Asia Pacific
- 4. Latin America
- 5. Middle East
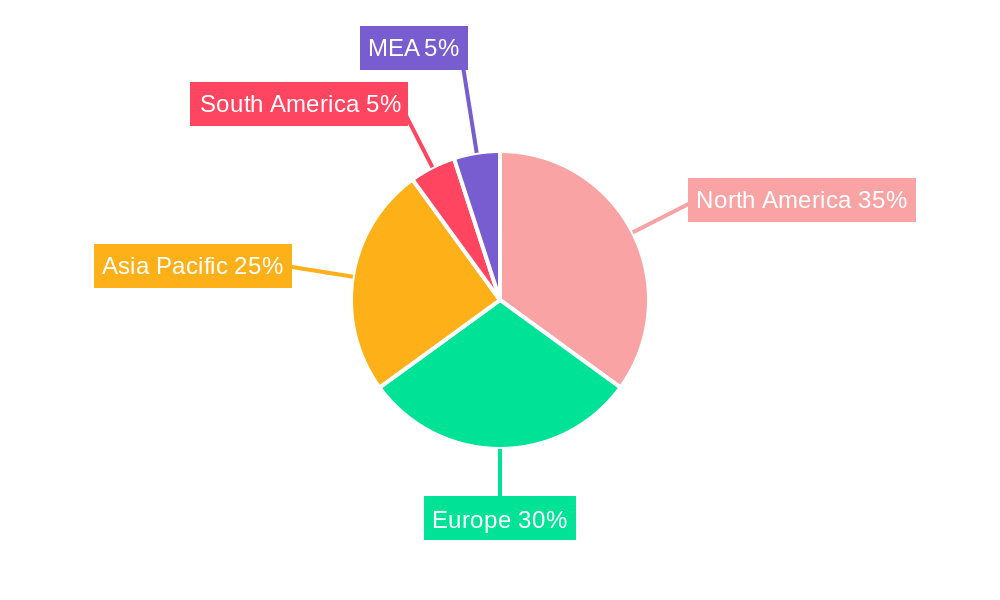
RTA Furniture Industry Regional Market Share
Geographic Coverage of RTA Furniture Industry
RTA Furniture Industry REPORT HIGHLIGHTS
| Aspects | Details |
|---|---|
| Study Period | 2020-2034 |
| Base Year | 2025 |
| Estimated Year | 2026 |
| Forecast Period | 2026-2034 |
| Historical Period | 2020-2025 |
| Growth Rate | CAGR of 7.3% from 2020-2034 |
| Segmentation |
|
Table of Contents
- 1. Introduction
- 1.1. Research Scope
- 1.2. Market Segmentation
- 1.3. Research Methodology
- 1.4. Definitions and Assumptions
- 2. Executive Summary
- 2.1. Introduction
- 3. Market Dynamics
- 3.1. Introduction
- 3.2. Market Drivers
- 3.2.1. Rise in E-commerce is Driving the Market; Rise in Construction and Real Estate Sector Drives the Furniture Market
- 3.3. Market Restrains
- 3.3.1. Economic Fluctuations; High Competition in the Furniture Market
- 3.4. Market Trends
- 3.4.1. Convenience of RTA furniture
- 4. Market Factor Analysis
- 4.1. Porters Five Forces
- 4.2. Supply/Value Chain
- 4.3. PESTEL analysis
- 4.4. Market Entropy
- 4.5. Patent/Trademark Analysis
- 5. Global RTA Furniture Industry Analysis, Insights and Forecast, 2020-2032
- 5.1. Market Analysis, Insights and Forecast - by Product
- 5.1.1. Tables
- 5.1.2. Chairs and Sofas
- 5.1.3. Storage
- 5.1.4. Beds
- 5.1.5. Other Products
- 5.2. Market Analysis, Insights and Forecast - by Distribution Channel
- 5.2.1. Specialty Retailers
- 5.2.2. Flagship Stores
- 5.2.3. Home Centers
- 5.2.4. Online
- 5.2.5. Designers
- 5.2.6. Other Distribution Channels
- 5.3. Market Analysis, Insights and Forecast - by End User
- 5.3.1. Residential
- 5.3.2. Commercial
- 5.4. Market Analysis, Insights and Forecast - by Region
- 5.4.1. North America
- 5.4.2. Europe
- 5.4.3. Asia Pacific
- 5.4.4. Latin America
- 5.4.5. Middle East
- 5.1. Market Analysis, Insights and Forecast - by Product
- 6. North America RTA Furniture Industry Analysis, Insights and Forecast, 2020-2032
- 6.1. Market Analysis, Insights and Forecast - by Product
- 6.1.1. Tables
- 6.1.2. Chairs and Sofas
- 6.1.3. Storage
- 6.1.4. Beds
- 6.1.5. Other Products
- 6.2. Market Analysis, Insights and Forecast - by Distribution Channel
- 6.2.1. Specialty Retailers
- 6.2.2. Flagship Stores
- 6.2.3. Home Centers
- 6.2.4. Online
- 6.2.5. Designers
- 6.2.6. Other Distribution Channels
- 6.3. Market Analysis, Insights and Forecast - by End User
- 6.3.1. Residential
- 6.3.2. Commercial
- 6.1. Market Analysis, Insights and Forecast - by Product
- 7. Europe RTA Furniture Industry Analysis, Insights and Forecast, 2020-2032
- 7.1. Market Analysis, Insights and Forecast - by Product
- 7.1.1. Tables
- 7.1.2. Chairs and Sofas
- 7.1.3. Storage
- 7.1.4. Beds
- 7.1.5. Other Products
- 7.2. Market Analysis, Insights and Forecast - by Distribution Channel
- 7.2.1. Specialty Retailers
- 7.2.2. Flagship Stores
- 7.2.3. Home Centers
- 7.2.4. Online
- 7.2.5. Designers
- 7.2.6. Other Distribution Channels
- 7.3. Market Analysis, Insights and Forecast - by End User
- 7.3.1. Residential
- 7.3.2. Commercial
- 7.1. Market Analysis, Insights and Forecast - by Product
- 8. Asia Pacific RTA Furniture Industry Analysis, Insights and Forecast, 2020-2032
- 8.1. Market Analysis, Insights and Forecast - by Product
- 8.1.1. Tables
- 8.1.2. Chairs and Sofas
- 8.1.3. Storage
- 8.1.4. Beds
- 8.1.5. Other Products
- 8.2. Market Analysis, Insights and Forecast - by Distribution Channel
- 8.2.1. Specialty Retailers
- 8.2.2. Flagship Stores
- 8.2.3. Home Centers
- 8.2.4. Online
- 8.2.5. Designers
- 8.2.6. Other Distribution Channels
- 8.3. Market Analysis, Insights and Forecast - by End User
- 8.3.1. Residential
- 8.3.2. Commercial
- 8.1. Market Analysis, Insights and Forecast - by Product
- 9. Latin America RTA Furniture Industry Analysis, Insights and Forecast, 2020-2032
- 9.1. Market Analysis, Insights and Forecast - by Product
- 9.1.1. Tables
- 9.1.2. Chairs and Sofas
- 9.1.3. Storage
- 9.1.4. Beds
- 9.1.5. Other Products
- 9.2. Market Analysis, Insights and Forecast - by Distribution Channel
- 9.2.1. Specialty Retailers
- 9.2.2. Flagship Stores
- 9.2.3. Home Centers
- 9.2.4. Online
- 9.2.5. Designers
- 9.2.6. Other Distribution Channels
- 9.3. Market Analysis, Insights and Forecast - by End User
- 9.3.1. Residential
- 9.3.2. Commercial
- 9.1. Market Analysis, Insights and Forecast - by Product
- 10. Middle East RTA Furniture Industry Analysis, Insights and Forecast, 2020-2032
- 10.1. Market Analysis, Insights and Forecast - by Product
- 10.1.1. Tables
- 10.1.2. Chairs and Sofas
- 10.1.3. Storage
- 10.1.4. Beds
- 10.1.5. Other Products
- 10.2. Market Analysis, Insights and Forecast - by Distribution Channel
- 10.2.1. Specialty Retailers
- 10.2.2. Flagship Stores
- 10.2.3. Home Centers
- 10.2.4. Online
- 10.2.5. Designers
- 10.2.6. Other Distribution Channels
- 10.3. Market Analysis, Insights and Forecast - by End User
- 10.3.1. Residential
- 10.3.2. Commercial
- 10.1. Market Analysis, Insights and Forecast - by Product
- 11. Competitive Analysis
- 11.1. Global Market Share Analysis 2025
- 11.2. Company Profiles
- 11.2.1 Inter IKEA Holding SA
- 11.2.1.1. Overview
- 11.2.1.2. Products
- 11.2.1.3. SWOT Analysis
- 11.2.1.4. Recent Developments
- 11.2.1.5. Financials (Based on Availability)
- 11.2.2 Sauder Woodworking Company
- 11.2.2.1. Overview
- 11.2.2.2. Products
- 11.2.2.3. SWOT Analysis
- 11.2.2.4. Recent Developments
- 11.2.2.5. Financials (Based on Availability)
- 11.2.3 Leicht Kuchen AG
- 11.2.3.1. Overview
- 11.2.3.2. Products
- 11.2.3.3. SWOT Analysis
- 11.2.3.4. Recent Developments
- 11.2.3.5. Financials (Based on Availability)
- 11.2.4 Simplicity Sofas
- 11.2.4.1. Overview
- 11.2.4.2. Products
- 11.2.4.3. SWOT Analysis
- 11.2.4.4. Recent Developments
- 11.2.4.5. Financials (Based on Availability)
- 11.2.5 Dorel Industries Inc
- 11.2.5.1. Overview
- 11.2.5.2. Products
- 11.2.5.3. SWOT Analysis
- 11.2.5.4. Recent Developments
- 11.2.5.5. Financials (Based on Availability)
- 11.2.6 Bush Industries Inc
- 11.2.6.1. Overview
- 11.2.6.2. Products
- 11.2.6.3. SWOT Analysis
- 11.2.6.4. Recent Developments
- 11.2.6.5. Financials (Based on Availability)
- 11.2.7 Flexsteel (Home Styles)
- 11.2.7.1. Overview
- 11.2.7.2. Products
- 11.2.7.3. SWOT Analysis
- 11.2.7.4. Recent Developments
- 11.2.7.5. Financials (Based on Availability)
- 11.2.8 Other Key Players (Prepac Manufacturing Ltd Venture Horizon Corporation Nolte Group Wellemobel GmbH Tvilum Alno Group Walker Edison Furniture Company LLC and others)**List Not Exhaustive
- 11.2.8.1. Overview
- 11.2.8.2. Products
- 11.2.8.3. SWOT Analysis
- 11.2.8.4. Recent Developments
- 11.2.8.5. Financials (Based on Availability)
- 11.2.9 Steinhoff Holding
- 11.2.9.1. Overview
- 11.2.9.2. Products
- 11.2.9.3. SWOT Analysis
- 11.2.9.4. Recent Developments
- 11.2.9.5. Financials (Based on Availability)
- 11.2.10 South Shore Furniture
- 11.2.10.1. Overview
- 11.2.10.2. Products
- 11.2.10.3. SWOT Analysis
- 11.2.10.4. Recent Developments
- 11.2.10.5. Financials (Based on Availability)
- 11.2.11 6 COMPETITIVE LANDSCAPE 6 1 MARKET CONCENTRATION OVERVIEW 6 2 COMPANY PROFILES
- 11.2.11.1. Overview
- 11.2.11.2. Products
- 11.2.11.3. SWOT Analysis
- 11.2.11.4. Recent Developments
- 11.2.11.5. Financials (Based on Availability)
- 11.2.12 Whalen Furniture Manufacturing
- 11.2.12.1. Overview
- 11.2.12.2. Products
- 11.2.12.3. SWOT Analysis
- 11.2.12.4. Recent Developments
- 11.2.12.5. Financials (Based on Availability)
- 11.2.1 Inter IKEA Holding SA
List of Figures
- Figure 1: Global RTA Furniture Industry Revenue Breakdown (million, %) by Region 2025 & 2033
- Figure 2: North America RTA Furniture Industry Revenue (million), by Product 2025 & 2033
- Figure 3: North America RTA Furniture Industry Revenue Share (%), by Product 2025 & 2033
- Figure 4: North America RTA Furniture Industry Revenue (million), by Distribution Channel 2025 & 2033
- Figure 5: North America RTA Furniture Industry Revenue Share (%), by Distribution Channel 2025 & 2033
- Figure 6: North America RTA Furniture Industry Revenue (million), by End User 2025 & 2033
- Figure 7: North America RTA Furniture Industry Revenue Share (%), by End User 2025 & 2033
- Figure 8: North America RTA Furniture Industry Revenue (million), by Country 2025 & 2033
- Figure 9: North America RTA Furniture Industry Revenue Share (%), by Country 2025 & 2033
- Figure 10: Europe RTA Furniture Industry Revenue (million), by Product 2025 & 2033
- Figure 11: Europe RTA Furniture Industry Revenue Share (%), by Product 2025 & 2033
- Figure 12: Europe RTA Furniture Industry Revenue (million), by Distribution Channel 2025 & 2033
- Figure 13: Europe RTA Furniture Industry Revenue Share (%), by Distribution Channel 2025 & 2033
- Figure 14: Europe RTA Furniture Industry Revenue (million), by End User 2025 & 2033
- Figure 15: Europe RTA Furniture Industry Revenue Share (%), by End User 2025 & 2033
- Figure 16: Europe RTA Furniture Industry Revenue (million), by Country 2025 & 2033
- Figure 17: Europe RTA Furniture Industry Revenue Share (%), by Country 2025 & 2033
- Figure 18: Asia Pacific RTA Furniture Industry Revenue (million), by Product 2025 & 2033
- Figure 19: Asia Pacific RTA Furniture Industry Revenue Share (%), by Product 2025 & 2033
- Figure 20: Asia Pacific RTA Furniture Industry Revenue (million), by Distribution Channel 2025 & 2033
- Figure 21: Asia Pacific RTA Furniture Industry Revenue Share (%), by Distribution Channel 2025 & 2033
- Figure 22: Asia Pacific RTA Furniture Industry Revenue (million), by End User 2025 & 2033
- Figure 23: Asia Pacific RTA Furniture Industry Revenue Share (%), by End User 2025 & 2033
- Figure 24: Asia Pacific RTA Furniture Industry Revenue (million), by Country 2025 & 2033
- Figure 25: Asia Pacific RTA Furniture Industry Revenue Share (%), by Country 2025 & 2033
- Figure 26: Latin America RTA Furniture Industry Revenue (million), by Product 2025 & 2033
- Figure 27: Latin America RTA Furniture Industry Revenue Share (%), by Product 2025 & 2033
- Figure 28: Latin America RTA Furniture Industry Revenue (million), by Distribution Channel 2025 & 2033
- Figure 29: Latin America RTA Furniture Industry Revenue Share (%), by Distribution Channel 2025 & 2033
- Figure 30: Latin America RTA Furniture Industry Revenue (million), by End User 2025 & 2033
- Figure 31: Latin America RTA Furniture Industry Revenue Share (%), by End User 2025 & 2033
- Figure 32: Latin America RTA Furniture Industry Revenue (million), by Country 2025 & 2033
- Figure 33: Latin America RTA Furniture Industry Revenue Share (%), by Country 2025 & 2033
- Figure 34: Middle East RTA Furniture Industry Revenue (million), by Product 2025 & 2033
- Figure 35: Middle East RTA Furniture Industry Revenue Share (%), by Product 2025 & 2033
- Figure 36: Middle East RTA Furniture Industry Revenue (million), by Distribution Channel 2025 & 2033
- Figure 37: Middle East RTA Furniture Industry Revenue Share (%), by Distribution Channel 2025 & 2033
- Figure 38: Middle East RTA Furniture Industry Revenue (million), by End User 2025 & 2033
- Figure 39: Middle East RTA Furniture Industry Revenue Share (%), by End User 2025 & 2033
- Figure 40: Middle East RTA Furniture Industry Revenue (million), by Country 2025 & 2033
- Figure 41: Middle East RTA Furniture Industry Revenue Share (%), by Country 2025 & 2033
List of Tables
- Table 1: Global RTA Furniture Industry Revenue million Forecast, by Product 2020 & 2033
- Table 2: Global RTA Furniture Industry Revenue million Forecast, by Distribution Channel 2020 & 2033
- Table 3: Global RTA Furniture Industry Revenue million Forecast, by End User 2020 & 2033
- Table 4: Global RTA Furniture Industry Revenue million Forecast, by Region 2020 & 2033
- Table 5: Global RTA Furniture Industry Revenue million Forecast, by Product 2020 & 2033
- Table 6: Global RTA Furniture Industry Revenue million Forecast, by Distribution Channel 2020 & 2033
- Table 7: Global RTA Furniture Industry Revenue million Forecast, by End User 2020 & 2033
- Table 8: Global RTA Furniture Industry Revenue million Forecast, by Country 2020 & 2033
- Table 9: Global RTA Furniture Industry Revenue million Forecast, by Product 2020 & 2033
- Table 10: Global RTA Furniture Industry Revenue million Forecast, by Distribution Channel 2020 & 2033
- Table 11: Global RTA Furniture Industry Revenue million Forecast, by End User 2020 & 2033
- Table 12: Global RTA Furniture Industry Revenue million Forecast, by Country 2020 & 2033
- Table 13: Global RTA Furniture Industry Revenue million Forecast, by Product 2020 & 2033
- Table 14: Global RTA Furniture Industry Revenue million Forecast, by Distribution Channel 2020 & 2033
- Table 15: Global RTA Furniture Industry Revenue million Forecast, by End User 2020 & 2033
- Table 16: Global RTA Furniture Industry Revenue million Forecast, by Country 2020 & 2033
- Table 17: Global RTA Furniture Industry Revenue million Forecast, by Product 2020 & 2033
- Table 18: Global RTA Furniture Industry Revenue million Forecast, by Distribution Channel 2020 & 2033
- Table 19: Global RTA Furniture Industry Revenue million Forecast, by End User 2020 & 2033
- Table 20: Global RTA Furniture Industry Revenue million Forecast, by Country 2020 & 2033
- Table 21: Global RTA Furniture Industry Revenue million Forecast, by Product 2020 & 2033
- Table 22: Global RTA Furniture Industry Revenue million Forecast, by Distribution Channel 2020 & 2033
- Table 23: Global RTA Furniture Industry Revenue million Forecast, by End User 2020 & 2033
- Table 24: Global RTA Furniture Industry Revenue million Forecast, by Country 2020 & 2033
Frequently Asked Questions
1. What is the projected Compound Annual Growth Rate (CAGR) of the RTA Furniture Industry?
The projected CAGR is approximately 7.3%.
2. Which companies are prominent players in the RTA Furniture Industry?
Key companies in the market include Inter IKEA Holding SA, Sauder Woodworking Company, Leicht Kuchen AG, Simplicity Sofas, Dorel Industries Inc, Bush Industries Inc, Flexsteel (Home Styles), Other Key Players (Prepac Manufacturing Ltd Venture Horizon Corporation Nolte Group Wellemobel GmbH Tvilum Alno Group Walker Edison Furniture Company LLC and others)**List Not Exhaustive, Steinhoff Holding, South Shore Furniture, 6 COMPETITIVE LANDSCAPE 6 1 MARKET CONCENTRATION OVERVIEW 6 2 COMPANY PROFILES, Whalen Furniture Manufacturing.
3. What are the main segments of the RTA Furniture Industry?
The market segments include Product, Distribution Channel, End User.
4. Can you provide details about the market size?
The market size is estimated to be USD 18353.4 million as of 2022.
5. What are some drivers contributing to market growth?
Rise in E-commerce is Driving the Market; Rise in Construction and Real Estate Sector Drives the Furniture Market.
6. What are the notable trends driving market growth?
Convenience of RTA furniture.
7. Are there any restraints impacting market growth?
Economic Fluctuations; High Competition in the Furniture Market.
8. Can you provide examples of recent developments in the market?
N/A
9. What pricing options are available for accessing the report?
Pricing options include single-user, multi-user, and enterprise licenses priced at USD 4750, USD 5250, and USD 8750 respectively.
10. Is the market size provided in terms of value or volume?
The market size is provided in terms of value, measured in million.
11. Are there any specific market keywords associated with the report?
Yes, the market keyword associated with the report is "RTA Furniture Industry," which aids in identifying and referencing the specific market segment covered.
12. How do I determine which pricing option suits my needs best?
The pricing options vary based on user requirements and access needs. Individual users may opt for single-user licenses, while businesses requiring broader access may choose multi-user or enterprise licenses for cost-effective access to the report.
13. Are there any additional resources or data provided in the RTA Furniture Industry report?
While the report offers comprehensive insights, it's advisable to review the specific contents or supplementary materials provided to ascertain if additional resources or data are available.
14. How can I stay updated on further developments or reports in the RTA Furniture Industry?
To stay informed about further developments, trends, and reports in the RTA Furniture Industry, consider subscribing to industry newsletters, following relevant companies and organizations, or regularly checking reputable industry news sources and publications.
Methodology
Step 1 - Identification of Relevant Samples Size from Population Database


Step 2 - Approaches for Defining Global Market Size (Value, Volume* & Price*)

Note*: In applicable scenarios
Step 3 - Data Sources
Primary Research
- Web Analytics
- Survey Reports
- Research Institute
- Latest Research Reports
- Opinion Leaders
Secondary Research
- Annual Reports
- White Paper
- Latest Press Release
- Industry Association
- Paid Database
- Investor Presentations

Step 4 - Data Triangulation
Involves using different sources of information in order to increase the validity of a study
These sources are likely to be stakeholders in a program - participants, other researchers, program staff, other community members, and so on.
Then we put all data in single framework & apply various statistical tools to find out the dynamic on the market.
During the analysis stage, feedback from the stakeholder groups would be compared to determine areas of agreement as well as areas of divergence