

Key Insights
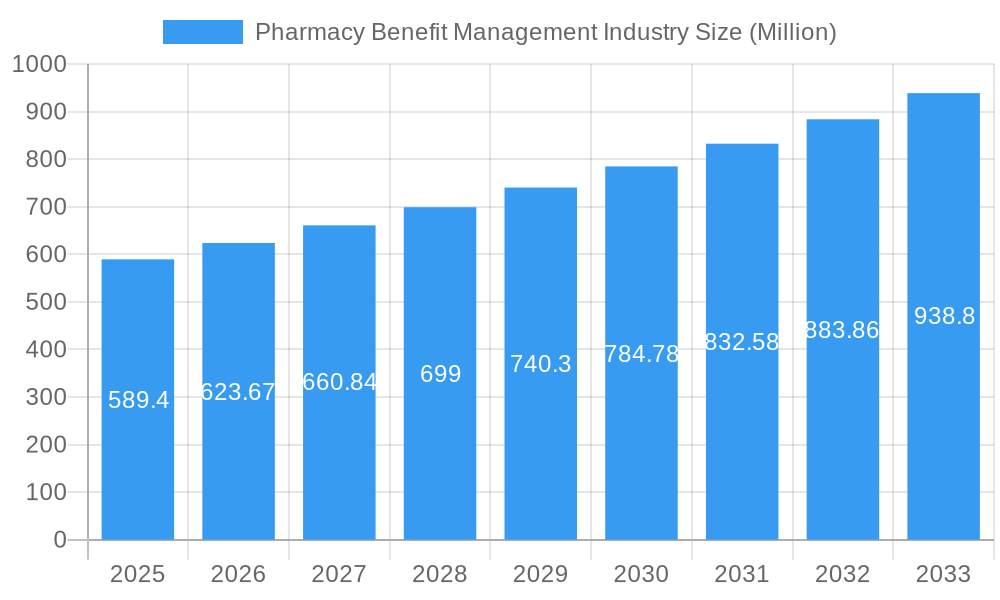
The Pharmacy Benefit Management (PBM) industry, valued at $589.40 million in 2025, is experiencing robust growth, projected to expand at a Compound Annual Growth Rate (CAGR) of 5.64% from 2025 to 2033. This growth is fueled by several key drivers. The increasing prevalence of chronic diseases necessitates sophisticated medication management, driving demand for PBM services. Simultaneously, the rising adoption of value-based care models incentivizes efficient drug utilization and cost containment, placing PBMs at the forefront of healthcare cost optimization. Technological advancements, including AI-driven analytics and improved data management tools, further enhance PBM capabilities, leading to more precise medication adherence programs and reduced administrative burdens for payers and providers. Expansion of government health programs and employer-sponsored plans contributes significantly to market growth, with a notable increase in the adoption of specialty pharmacy services and complex formulary management solutions. Competition among established players like Express Scripts, CVS Health, and Optum, coupled with the emergence of innovative technology companies, is shaping the market landscape, pushing for continuous improvement and efficiency.
Pharmacy Benefit Management Industry Market Size (In Million)
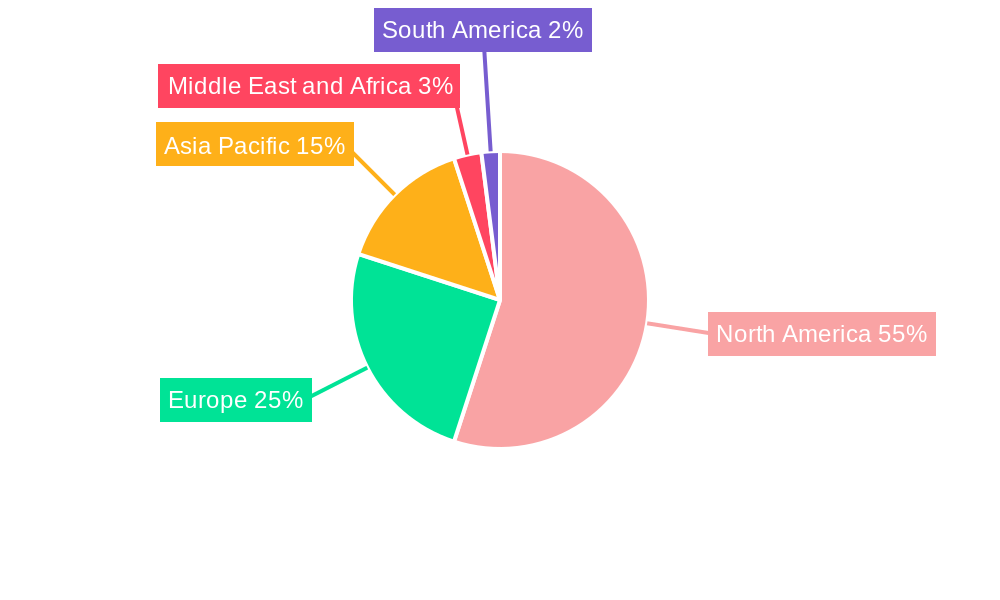
The PBM market is segmented by service type (specialty pharmacy, drug formulary management, benefit plan design, and other services), business model (government, employer-sponsored, and health insurance programs), and end-user (pharmacy benefit management organizations, mail-order pharmacies, retail pharmacies, and others). North America currently dominates the market due to high healthcare expenditure and advanced healthcare infrastructure, however, growth in Asia-Pacific and other regions is anticipated due to rising healthcare awareness and increasing government initiatives to improve healthcare access and affordability. Market restraints include regulatory scrutiny related to pricing transparency and potential conflicts of interest, alongside concerns around data privacy and security. However, industry players are proactively addressing these challenges through strategic partnerships, technological innovation, and enhanced transparency measures to ensure sustained and responsible growth.
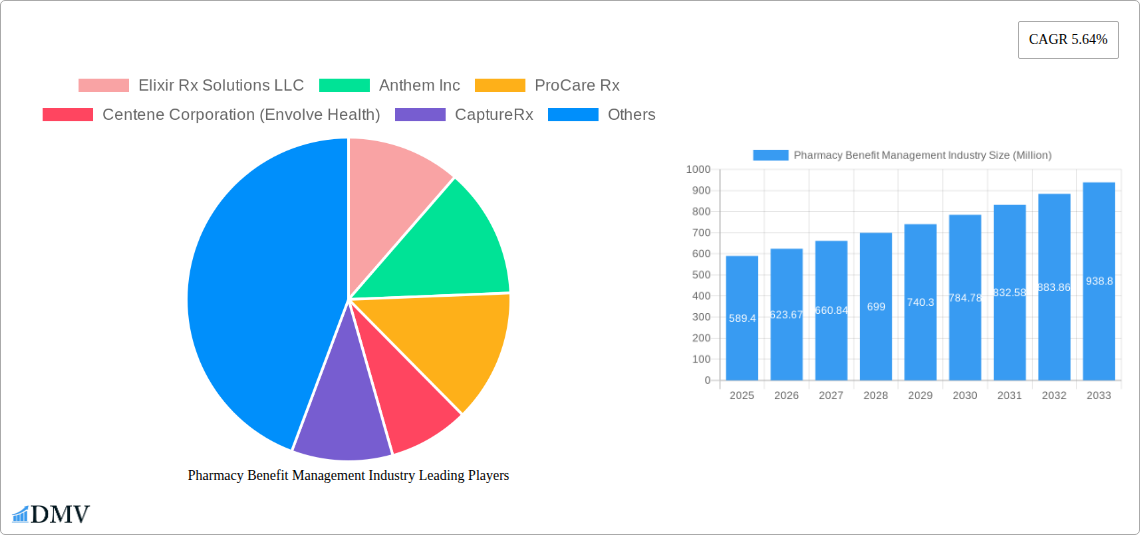
Pharmacy Benefit Management Industry Company Market Share
Pharmacy Benefit Management (PBM) Industry Market Report: 2019-2033
This comprehensive report provides an in-depth analysis of the Pharmacy Benefit Management (PBM) industry, projecting a market value of $xx Million by 2033. It covers market composition, key players, technological advancements, and future growth opportunities, offering invaluable insights for stakeholders across the PBM ecosystem. The study period spans 2019-2033, with 2025 as the base and estimated year. The forecast period is 2025-2033, and the historical period is 2019-2024.
Pharmacy Benefit Management Industry Market Composition & Trends
The PBM market is characterized by a moderately concentrated landscape, with key players such as CVS Health, Express Scripts, and Optum Inc. holding significant market share. However, smaller, specialized PBMs are also emerging, creating a dynamic competitive environment. Market share distribution in 2025 is estimated as follows: CVS Health (xx%), Express Scripts (xx%), OptumRx (xx%), and others (xx%). Innovation is driven by advancements in technology, such as AI-powered drug utilization review and personalized medication management. The regulatory landscape, including the Affordable Care Act and state-level regulations, significantly influences market dynamics. Substitute products, such as direct-to-consumer telemedicine services, pose a growing challenge. M&A activities have been significant, with total deal values exceeding $xx Million in the last five years. Notable deals include [Insert Specific Deal Examples if available, otherwise replace with "multiple significant acquisitions across the industry"]. End-users are primarily Pharmacy Benefit Management Organizations (PBMs), mail-order pharmacies, and retail pharmacies.
- Market Concentration: Moderately concentrated, with top players holding significant share.
- Innovation Catalysts: Technological advancements in AI, data analytics, and personalized medicine.
- Regulatory Landscape: Significant influence from the Affordable Care Act and state-level regulations.
- Substitute Products: Growing competition from direct-to-consumer telehealth services.
- M&A Activity: High level of M&A activity, driving market consolidation. Total deal value exceeding $xx Million in the last 5 years.
- End-User Profile: PBMs, Mail-order Pharmacies, Retail Pharmacies, Other End-Users
Pharmacy Benefit Management Industry Industry Evolution
The PBM industry has experienced consistent growth over the past decade, driven by factors such as an aging population, rising prevalence of chronic diseases, and increasing healthcare spending. The market witnessed a Compound Annual Growth Rate (CAGR) of xx% during 2019-2024 and is projected to grow at a CAGR of xx% from 2025 to 2033, reaching $xx Million. Technological advancements, including the use of big data analytics for improved drug utilization management and the integration of telepharmacy services, are reshaping the industry. Shifting consumer demands for greater transparency, cost control, and personalized healthcare experiences are also driving innovation. The adoption rate of advanced analytics tools in PBM is estimated to be xx% in 2025.
Leading Regions, Countries, or Segments in Pharmacy Benefit Management Industry
The North American market (US and Canada) dominates the global PBM landscape, driven by high healthcare expenditure, a large insured population, and advanced healthcare infrastructure. Within the US, specific segments showcasing strong growth include:
- By Service: Specialty Pharmacy (driven by the rising prevalence of complex and expensive treatments), Drug Formulatory Management (fueled by the need for cost-effective formularies), and Benefit Plan Design and Consultation (due to increasing demand for customized plans).
- By Business Model: Employer-Sponsored Programs (due to the substantial portion of the population receiving health insurance through their employers) and Government Health Programs (due to the large scale of government-funded healthcare initiatives such as Medicare and Medicaid).
- By End-User: Pharmacy Benefit Management Organizations (PBMs) due to their crucial role in managing prescription drug benefits.
Key drivers in these dominant regions/segments include significant investments in technology, favorable regulatory frameworks, and strong support from government healthcare initiatives. The high concentration of insured individuals and extensive healthcare infrastructure in North America contributes heavily to its dominant market position.
Pharmacy Benefit Management Industry Product Innovations
Recent innovations include AI-driven medication adherence programs, personalized formulary management tools, and integrated telehealth platforms for remote prescription management. These innovations aim to improve patient outcomes, enhance efficiency, and reduce overall healthcare costs. Unique selling propositions emphasize enhanced data analytics capabilities, streamlined workflows, and improved patient engagement. Technological advancements in areas such as machine learning and blockchain technology are further enhancing the functionalities and security of PBM solutions.
Propelling Factors for Pharmacy Benefit Management Industry Growth
Technological advancements such as AI and machine learning are enabling personalized medicine and improved drug utilization management, boosting efficiency and lowering costs. The aging population and rising prevalence of chronic illnesses create a growing demand for PBM services. Favorable regulatory policies, including those promoting interoperability and data sharing, encourage industry growth.
Obstacles in the Pharmacy Benefit Management Industry Market
Regulatory scrutiny and price transparency mandates create challenges for PBM profitability. Supply chain disruptions, exacerbated by global events, can impact drug availability and cost. Intense competition among established PBMs and the emergence of new players create pricing pressures. These factors combined are estimated to cause a xx% reduction in profit margins for the industry in 2025.
Future Opportunities in Pharmacy Benefit Management Industry
Expansion into emerging markets with growing healthcare infrastructure offers significant growth potential. The integration of blockchain technology for secure prescription drug tracking enhances transparency and reduces fraud. The growing focus on preventative care and personalized medicine creates opportunities for customized PBM services.
Major Players in the Pharmacy Benefit Management Industry Ecosystem
- Elixir Rx Solutions LLC
- Anthem Inc
- ProCare Rx
- Centene Corporation (Envolve Health)
- CaptureRx
- Abarca Health
- Optum Inc
- Benecard Services LLC
- Express Scripts Holding Company
- SS&C Technologies Inc
- Change Healthcare
- Cigna
- CVS Health
Key Developments in Pharmacy Benefit Management Industry Industry
- October 2022: Omnicell, Inc. launched Specialty Pharmacy Services, expanding its offerings into the specialty pharmacy market segment. This move increases competition and adds another comprehensive offering to the market.
- March 2022: ProdigyRx launched its business operations, focusing on PBM services and clinical solutions for workers' compensation, expanding the reach of PBM services into a new market segment.
Strategic Pharmacy Benefit Management Industry Market Forecast
The PBM industry is poised for continued growth driven by technological innovation, an expanding market for specialty pharmaceuticals, and increasing demand for personalized medication management. Future opportunities include the development of AI-powered solutions for drug discovery and personalized medicine, alongside the expansion into new geographic markets. This will create a significant market opportunity, with projections suggesting continued substantial growth in the coming years.
Pharmacy Benefit Management Industry Segmentation
-
1. Service
- 1.1. Specialty Pharmacy
- 1.2. Drug Formulatory Management
- 1.3. Benefit Plan Design and Consultation
- 1.4. Other Services
-
2. Business Model
- 2.1. Government Health Programs
- 2.2. Employer-Sponsored Programs
- 2.3. Health Insurance Management
-
3. End User
- 3.1. Pharmacy Benefit Management Organization
- 3.2. Mail Order Pharmacies
- 3.3. Retail Pharmacies
- 3.4. Other End Users
Pharmacy Benefit Management Industry Segmentation By Geography
-
1. North America
- 1.1. United States
- 1.2. Canada
- 1.3. Mexico
-
2. Europe
- 2.1. Germany
- 2.2. United Kingdom
- 2.3. France
- 2.4. Italy
- 2.5. Spain
- 2.6. Rest of Europe
-
3. Asia Pacific
- 3.1. China
- 3.2. Japan
- 3.3. India
- 3.4. Australia
- 3.5. South Korea
- 3.6. Rest of Asia Pacific
-
4. Middle East and Africa
- 4.1. GCC
- 4.2. South Africa
- 4.3. Rest of Middle East and Africa
-
5. South America
- 5.1. Brazil
- 5.2. Argentina
- 5.3. Rest of South America
Pharmacy Benefit Management Industry Regional Market Share
Geographic Coverage of Pharmacy Benefit Management Industry
Pharmacy Benefit Management Industry REPORT HIGHLIGHTS
| Aspects | Details |
|---|---|
| Study Period | 2020-2034 |
| Base Year | 2025 |
| Estimated Year | 2026 |
| Forecast Period | 2026-2034 |
| Historical Period | 2020-2025 |
| Growth Rate | CAGR of 5.64% from 2020-2034 |
| Segmentation |
|
Table of Contents
- 1. Introduction
- 1.1. Research Scope
- 1.2. Market Segmentation
- 1.3. Research Objective
- 1.4. Definitions and Assumptions
- 2. Executive Summary
- 2.1. Market Snapshot
- 3. Market Dynamics
- 3.1. Market Drivers
- 3.2. Market Restrains
- 3.3. Market Trends
- 3.4. Market Opportunities
- 4. Market Factor Analysis
- 4.1. Porters Five Forces
- 4.1.1. Bargaining Power of Suppliers
- 4.1.2. Bargaining Power of Buyers
- 4.1.3. Threat of New Entrants
- 4.1.4. Threat of Substitutes
- 4.1.5. Competitive Rivalry
- 4.2. PESTEL analysis
- 4.3. BCG Analysis
- 4.3.1. Stars (High Growth, High Market Share)
- 4.3.2. Cash Cows (Low Growth, High Market Share)
- 4.3.3. Question Mark (High Growth, Low Market Share)
- 4.3.4. Dogs (Low Growth, Low Market Share)
- 4.4. Ansoff Matrix Analysis
- 4.5. Supply Chain Analysis
- 4.6. Regulatory Landscape
- 4.7. Current Market Potential and Opportunity Assessment (TAM–SAM–SOM Framework)
- 4.8. DMV Analyst Note
- 4.1. Porters Five Forces
- 5. Market Analysis, Insights and Forecast 2021-2033
- 5.1. Market Analysis, Insights and Forecast - by Service
- 5.1.1. Specialty Pharmacy
- 5.1.2. Drug Formulatory Management
- 5.1.3. Benefit Plan Design and Consultation
- 5.1.4. Other Services
- 5.2. Market Analysis, Insights and Forecast - by Business Model
- 5.2.1. Government Health Programs
- 5.2.2. Employer-Sponsored Programs
- 5.2.3. Health Insurance Management
- 5.3. Market Analysis, Insights and Forecast - by End User
- 5.3.1. Pharmacy Benefit Management Organization
- 5.3.2. Mail Order Pharmacies
- 5.3.3. Retail Pharmacies
- 5.3.4. Other End Users
- 5.4. Market Analysis, Insights and Forecast - by Region
- 5.4.1. North America
- 5.4.2. Europe
- 5.4.3. Asia Pacific
- 5.4.4. Middle East and Africa
- 5.4.5. South America
- 5.1. Market Analysis, Insights and Forecast - by Service
- 6. Global Pharmacy Benefit Management Industry Analysis, Insights and Forecast, 2021-2033
- 6.1. Market Analysis, Insights and Forecast - by Service
- 6.1.1. Specialty Pharmacy
- 6.1.2. Drug Formulatory Management
- 6.1.3. Benefit Plan Design and Consultation
- 6.1.4. Other Services
- 6.2. Market Analysis, Insights and Forecast - by Business Model
- 6.2.1. Government Health Programs
- 6.2.2. Employer-Sponsored Programs
- 6.2.3. Health Insurance Management
- 6.3. Market Analysis, Insights and Forecast - by End User
- 6.3.1. Pharmacy Benefit Management Organization
- 6.3.2. Mail Order Pharmacies
- 6.3.3. Retail Pharmacies
- 6.3.4. Other End Users
- 6.1. Market Analysis, Insights and Forecast - by Service
- 7. North America Pharmacy Benefit Management Industry Analysis, Insights and Forecast, 2020-2032
- 7.1. Market Analysis, Insights and Forecast - by Service
- 7.1.1. Specialty Pharmacy
- 7.1.2. Drug Formulatory Management
- 7.1.3. Benefit Plan Design and Consultation
- 7.1.4. Other Services
- 7.2. Market Analysis, Insights and Forecast - by Business Model
- 7.2.1. Government Health Programs
- 7.2.2. Employer-Sponsored Programs
- 7.2.3. Health Insurance Management
- 7.3. Market Analysis, Insights and Forecast - by End User
- 7.3.1. Pharmacy Benefit Management Organization
- 7.3.2. Mail Order Pharmacies
- 7.3.3. Retail Pharmacies
- 7.3.4. Other End Users
- 7.1. Market Analysis, Insights and Forecast - by Service
- 8. Europe Pharmacy Benefit Management Industry Analysis, Insights and Forecast, 2020-2032
- 8.1. Market Analysis, Insights and Forecast - by Service
- 8.1.1. Specialty Pharmacy
- 8.1.2. Drug Formulatory Management
- 8.1.3. Benefit Plan Design and Consultation
- 8.1.4. Other Services
- 8.2. Market Analysis, Insights and Forecast - by Business Model
- 8.2.1. Government Health Programs
- 8.2.2. Employer-Sponsored Programs
- 8.2.3. Health Insurance Management
- 8.3. Market Analysis, Insights and Forecast - by End User
- 8.3.1. Pharmacy Benefit Management Organization
- 8.3.2. Mail Order Pharmacies
- 8.3.3. Retail Pharmacies
- 8.3.4. Other End Users
- 8.1. Market Analysis, Insights and Forecast - by Service
- 9. Asia Pacific Pharmacy Benefit Management Industry Analysis, Insights and Forecast, 2020-2032
- 9.1. Market Analysis, Insights and Forecast - by Service
- 9.1.1. Specialty Pharmacy
- 9.1.2. Drug Formulatory Management
- 9.1.3. Benefit Plan Design and Consultation
- 9.1.4. Other Services
- 9.2. Market Analysis, Insights and Forecast - by Business Model
- 9.2.1. Government Health Programs
- 9.2.2. Employer-Sponsored Programs
- 9.2.3. Health Insurance Management
- 9.3. Market Analysis, Insights and Forecast - by End User
- 9.3.1. Pharmacy Benefit Management Organization
- 9.3.2. Mail Order Pharmacies
- 9.3.3. Retail Pharmacies
- 9.3.4. Other End Users
- 9.1. Market Analysis, Insights and Forecast - by Service
- 10. Middle East and Africa Pharmacy Benefit Management Industry Analysis, Insights and Forecast, 2020-2032
- 10.1. Market Analysis, Insights and Forecast - by Service
- 10.1.1. Specialty Pharmacy
- 10.1.2. Drug Formulatory Management
- 10.1.3. Benefit Plan Design and Consultation
- 10.1.4. Other Services
- 10.2. Market Analysis, Insights and Forecast - by Business Model
- 10.2.1. Government Health Programs
- 10.2.2. Employer-Sponsored Programs
- 10.2.3. Health Insurance Management
- 10.3. Market Analysis, Insights and Forecast - by End User
- 10.3.1. Pharmacy Benefit Management Organization
- 10.3.2. Mail Order Pharmacies
- 10.3.3. Retail Pharmacies
- 10.3.4. Other End Users
- 10.1. Market Analysis, Insights and Forecast - by Service
- 11. South America Pharmacy Benefit Management Industry Analysis, Insights and Forecast, 2020-2032
- 11.1. Market Analysis, Insights and Forecast - by Service
- 11.1.1. Specialty Pharmacy
- 11.1.2. Drug Formulatory Management
- 11.1.3. Benefit Plan Design and Consultation
- 11.1.4. Other Services
- 11.2. Market Analysis, Insights and Forecast - by Business Model
- 11.2.1. Government Health Programs
- 11.2.2. Employer-Sponsored Programs
- 11.2.3. Health Insurance Management
- 11.3. Market Analysis, Insights and Forecast - by End User
- 11.3.1. Pharmacy Benefit Management Organization
- 11.3.2. Mail Order Pharmacies
- 11.3.3. Retail Pharmacies
- 11.3.4. Other End Users
- 11.1. Market Analysis, Insights and Forecast - by Service
- 12. Competitive Analysis
- 12.1. Company Profiles
- 12.1.1 Elixir Rx Solutions LLC
- 12.1.1.1. Company Overview
- 12.1.1.2. Products
- 12.1.1.3. Company Financials
- 12.1.1.4. SWOT Analysis
- 12.1.2 Anthem Inc
- 12.1.2.1. Company Overview
- 12.1.2.2. Products
- 12.1.2.3. Company Financials
- 12.1.2.4. SWOT Analysis
- 12.1.3 ProCare Rx
- 12.1.3.1. Company Overview
- 12.1.3.2. Products
- 12.1.3.3. Company Financials
- 12.1.3.4. SWOT Analysis
- 12.1.4 Centene Corporation (Envolve Health)
- 12.1.4.1. Company Overview
- 12.1.4.2. Products
- 12.1.4.3. Company Financials
- 12.1.4.4. SWOT Analysis
- 12.1.5 CaptureRx
- 12.1.5.1. Company Overview
- 12.1.5.2. Products
- 12.1.5.3. Company Financials
- 12.1.5.4. SWOT Analysis
- 12.1.6 Abarca Health
- 12.1.6.1. Company Overview
- 12.1.6.2. Products
- 12.1.6.3. Company Financials
- 12.1.6.4. SWOT Analysis
- 12.1.7 Optum Inc
- 12.1.7.1. Company Overview
- 12.1.7.2. Products
- 12.1.7.3. Company Financials
- 12.1.7.4. SWOT Analysis
- 12.1.8 Benecard Services LLC
- 12.1.8.1. Company Overview
- 12.1.8.2. Products
- 12.1.8.3. Company Financials
- 12.1.8.4. SWOT Analysis
- 12.1.9 Express Scripts Holding Company
- 12.1.9.1. Company Overview
- 12.1.9.2. Products
- 12.1.9.3. Company Financials
- 12.1.9.4. SWOT Analysis
- 12.1.10 SS&C Technologies Inc
- 12.1.10.1. Company Overview
- 12.1.10.2. Products
- 12.1.10.3. Company Financials
- 12.1.10.4. SWOT Analysis
- 12.1.11 Change Healthcare
- 12.1.11.1. Company Overview
- 12.1.11.2. Products
- 12.1.11.3. Company Financials
- 12.1.11.4. SWOT Analysis
- 12.1.12 Cigna
- 12.1.12.1. Company Overview
- 12.1.12.2. Products
- 12.1.12.3. Company Financials
- 12.1.12.4. SWOT Analysis
- 12.1.13 CVS Health
- 12.1.13.1. Company Overview
- 12.1.13.2. Products
- 12.1.13.3. Company Financials
- 12.1.13.4. SWOT Analysis
- 12.1.1 Elixir Rx Solutions LLC
- 12.2. Market Entropy
- 12.2.1 Company's Key Areas Served
- 12.2.2 Recent Developments
- 12.3. Company Market Share Analysis 2025
- 12.3.1 Top 5 Companies Market Share Analysis
- 12.3.2 Top 3 Companies Market Share Analysis
- 12.4. List of Potential Customers
- 13. Research Methodology
List of Figures
- Figure 1: Global Pharmacy Benefit Management Industry Revenue Breakdown (Million, %) by Region 2025 & 2033
- Figure 2: North America Pharmacy Benefit Management Industry Revenue (Million), by Service 2025 & 2033
- Figure 3: North America Pharmacy Benefit Management Industry Revenue Share (%), by Service 2025 & 2033
- Figure 4: North America Pharmacy Benefit Management Industry Revenue (Million), by Business Model 2025 & 2033
- Figure 5: North America Pharmacy Benefit Management Industry Revenue Share (%), by Business Model 2025 & 2033
- Figure 6: North America Pharmacy Benefit Management Industry Revenue (Million), by End User 2025 & 2033
- Figure 7: North America Pharmacy Benefit Management Industry Revenue Share (%), by End User 2025 & 2033
- Figure 8: North America Pharmacy Benefit Management Industry Revenue (Million), by Country 2025 & 2033
- Figure 9: North America Pharmacy Benefit Management Industry Revenue Share (%), by Country 2025 & 2033
- Figure 10: Europe Pharmacy Benefit Management Industry Revenue (Million), by Service 2025 & 2033
- Figure 11: Europe Pharmacy Benefit Management Industry Revenue Share (%), by Service 2025 & 2033
- Figure 12: Europe Pharmacy Benefit Management Industry Revenue (Million), by Business Model 2025 & 2033
- Figure 13: Europe Pharmacy Benefit Management Industry Revenue Share (%), by Business Model 2025 & 2033
- Figure 14: Europe Pharmacy Benefit Management Industry Revenue (Million), by End User 2025 & 2033
- Figure 15: Europe Pharmacy Benefit Management Industry Revenue Share (%), by End User 2025 & 2033
- Figure 16: Europe Pharmacy Benefit Management Industry Revenue (Million), by Country 2025 & 2033
- Figure 17: Europe Pharmacy Benefit Management Industry Revenue Share (%), by Country 2025 & 2033
- Figure 18: Asia Pacific Pharmacy Benefit Management Industry Revenue (Million), by Service 2025 & 2033
- Figure 19: Asia Pacific Pharmacy Benefit Management Industry Revenue Share (%), by Service 2025 & 2033
- Figure 20: Asia Pacific Pharmacy Benefit Management Industry Revenue (Million), by Business Model 2025 & 2033
- Figure 21: Asia Pacific Pharmacy Benefit Management Industry Revenue Share (%), by Business Model 2025 & 2033
- Figure 22: Asia Pacific Pharmacy Benefit Management Industry Revenue (Million), by End User 2025 & 2033
- Figure 23: Asia Pacific Pharmacy Benefit Management Industry Revenue Share (%), by End User 2025 & 2033
- Figure 24: Asia Pacific Pharmacy Benefit Management Industry Revenue (Million), by Country 2025 & 2033
- Figure 25: Asia Pacific Pharmacy Benefit Management Industry Revenue Share (%), by Country 2025 & 2033
- Figure 26: Middle East and Africa Pharmacy Benefit Management Industry Revenue (Million), by Service 2025 & 2033
- Figure 27: Middle East and Africa Pharmacy Benefit Management Industry Revenue Share (%), by Service 2025 & 2033
- Figure 28: Middle East and Africa Pharmacy Benefit Management Industry Revenue (Million), by Business Model 2025 & 2033
- Figure 29: Middle East and Africa Pharmacy Benefit Management Industry Revenue Share (%), by Business Model 2025 & 2033
- Figure 30: Middle East and Africa Pharmacy Benefit Management Industry Revenue (Million), by End User 2025 & 2033
- Figure 31: Middle East and Africa Pharmacy Benefit Management Industry Revenue Share (%), by End User 2025 & 2033
- Figure 32: Middle East and Africa Pharmacy Benefit Management Industry Revenue (Million), by Country 2025 & 2033
- Figure 33: Middle East and Africa Pharmacy Benefit Management Industry Revenue Share (%), by Country 2025 & 2033
- Figure 34: South America Pharmacy Benefit Management Industry Revenue (Million), by Service 2025 & 2033
- Figure 35: South America Pharmacy Benefit Management Industry Revenue Share (%), by Service 2025 & 2033
- Figure 36: South America Pharmacy Benefit Management Industry Revenue (Million), by Business Model 2025 & 2033
- Figure 37: South America Pharmacy Benefit Management Industry Revenue Share (%), by Business Model 2025 & 2033
- Figure 38: South America Pharmacy Benefit Management Industry Revenue (Million), by End User 2025 & 2033
- Figure 39: South America Pharmacy Benefit Management Industry Revenue Share (%), by End User 2025 & 2033
- Figure 40: South America Pharmacy Benefit Management Industry Revenue (Million), by Country 2025 & 2033
- Figure 41: South America Pharmacy Benefit Management Industry Revenue Share (%), by Country 2025 & 2033
List of Tables
- Table 1: Global Pharmacy Benefit Management Industry Revenue Million Forecast, by Service 2020 & 2033
- Table 2: Global Pharmacy Benefit Management Industry Revenue Million Forecast, by Business Model 2020 & 2033
- Table 3: Global Pharmacy Benefit Management Industry Revenue Million Forecast, by End User 2020 & 2033
- Table 4: Global Pharmacy Benefit Management Industry Revenue Million Forecast, by Region 2020 & 2033
- Table 5: Global Pharmacy Benefit Management Industry Revenue Million Forecast, by Service 2020 & 2033
- Table 6: Global Pharmacy Benefit Management Industry Revenue Million Forecast, by Business Model 2020 & 2033
- Table 7: Global Pharmacy Benefit Management Industry Revenue Million Forecast, by End User 2020 & 2033
- Table 8: Global Pharmacy Benefit Management Industry Revenue Million Forecast, by Country 2020 & 2033
- Table 9: United States Pharmacy Benefit Management Industry Revenue (Million) Forecast, by Application 2020 & 2033
- Table 10: Canada Pharmacy Benefit Management Industry Revenue (Million) Forecast, by Application 2020 & 2033
- Table 11: Mexico Pharmacy Benefit Management Industry Revenue (Million) Forecast, by Application 2020 & 2033
- Table 12: Global Pharmacy Benefit Management Industry Revenue Million Forecast, by Service 2020 & 2033
- Table 13: Global Pharmacy Benefit Management Industry Revenue Million Forecast, by Business Model 2020 & 2033
- Table 14: Global Pharmacy Benefit Management Industry Revenue Million Forecast, by End User 2020 & 2033
- Table 15: Global Pharmacy Benefit Management Industry Revenue Million Forecast, by Country 2020 & 2033
- Table 16: Germany Pharmacy Benefit Management Industry Revenue (Million) Forecast, by Application 2020 & 2033
- Table 17: United Kingdom Pharmacy Benefit Management Industry Revenue (Million) Forecast, by Application 2020 & 2033
- Table 18: France Pharmacy Benefit Management Industry Revenue (Million) Forecast, by Application 2020 & 2033
- Table 19: Italy Pharmacy Benefit Management Industry Revenue (Million) Forecast, by Application 2020 & 2033
- Table 20: Spain Pharmacy Benefit Management Industry Revenue (Million) Forecast, by Application 2020 & 2033
- Table 21: Rest of Europe Pharmacy Benefit Management Industry Revenue (Million) Forecast, by Application 2020 & 2033
- Table 22: Global Pharmacy Benefit Management Industry Revenue Million Forecast, by Service 2020 & 2033
- Table 23: Global Pharmacy Benefit Management Industry Revenue Million Forecast, by Business Model 2020 & 2033
- Table 24: Global Pharmacy Benefit Management Industry Revenue Million Forecast, by End User 2020 & 2033
- Table 25: Global Pharmacy Benefit Management Industry Revenue Million Forecast, by Country 2020 & 2033
- Table 26: China Pharmacy Benefit Management Industry Revenue (Million) Forecast, by Application 2020 & 2033
- Table 27: Japan Pharmacy Benefit Management Industry Revenue (Million) Forecast, by Application 2020 & 2033
- Table 28: India Pharmacy Benefit Management Industry Revenue (Million) Forecast, by Application 2020 & 2033
- Table 29: Australia Pharmacy Benefit Management Industry Revenue (Million) Forecast, by Application 2020 & 2033
- Table 30: South Korea Pharmacy Benefit Management Industry Revenue (Million) Forecast, by Application 2020 & 2033
- Table 31: Rest of Asia Pacific Pharmacy Benefit Management Industry Revenue (Million) Forecast, by Application 2020 & 2033
- Table 32: Global Pharmacy Benefit Management Industry Revenue Million Forecast, by Service 2020 & 2033
- Table 33: Global Pharmacy Benefit Management Industry Revenue Million Forecast, by Business Model 2020 & 2033
- Table 34: Global Pharmacy Benefit Management Industry Revenue Million Forecast, by End User 2020 & 2033
- Table 35: Global Pharmacy Benefit Management Industry Revenue Million Forecast, by Country 2020 & 2033
- Table 36: GCC Pharmacy Benefit Management Industry Revenue (Million) Forecast, by Application 2020 & 2033
- Table 37: South Africa Pharmacy Benefit Management Industry Revenue (Million) Forecast, by Application 2020 & 2033
- Table 38: Rest of Middle East and Africa Pharmacy Benefit Management Industry Revenue (Million) Forecast, by Application 2020 & 2033
- Table 39: Global Pharmacy Benefit Management Industry Revenue Million Forecast, by Service 2020 & 2033
- Table 40: Global Pharmacy Benefit Management Industry Revenue Million Forecast, by Business Model 2020 & 2033
- Table 41: Global Pharmacy Benefit Management Industry Revenue Million Forecast, by End User 2020 & 2033
- Table 42: Global Pharmacy Benefit Management Industry Revenue Million Forecast, by Country 2020 & 2033
- Table 43: Brazil Pharmacy Benefit Management Industry Revenue (Million) Forecast, by Application 2020 & 2033
- Table 44: Argentina Pharmacy Benefit Management Industry Revenue (Million) Forecast, by Application 2020 & 2033
- Table 45: Rest of South America Pharmacy Benefit Management Industry Revenue (Million) Forecast, by Application 2020 & 2033
Frequently Asked Questions
1. What is the projected Compound Annual Growth Rate (CAGR) of the Pharmacy Benefit Management Industry?
The projected CAGR is approximately 5.64%.
2. Which companies are prominent players in the Pharmacy Benefit Management Industry?
Key companies in the market include Elixir Rx Solutions LLC, Anthem Inc, ProCare Rx, Centene Corporation (Envolve Health), CaptureRx, Abarca Health, Optum Inc, Benecard Services LLC, Express Scripts Holding Company, SS&C Technologies Inc, Change Healthcare, Cigna, CVS Health.
3. What are the main segments of the Pharmacy Benefit Management Industry?
The market segments include Service, Business Model, End User.
4. Can you provide details about the market size?
The market size is estimated to be USD 589.40 Million as of 2022.
5. What are some drivers contributing to market growth?
Rising Inclination Towards Pharmacy Benefit Management System (PBMS); Increasing Health Expenditure; Growing Demand for Prescription Products.
6. What are the notable trends driving market growth?
Specialty Pharmacy Segment is Expected to Witness Significant Growth Over the Forecast Period.
7. Are there any restraints impacting market growth?
Reluctance To Adopt Pharmacy Automation Systems and Stringent Regulatory Procedures on Confidentiality.
8. Can you provide examples of recent developments in the market?
October 2022: Omnicell, Inc., a provider of medication management and adherence tools for health systems and pharmacies, launched Specialty Pharmacy Services, a comprehensive offering designed to help health systems launch and/or optimize a fully managed, hospital-owned specialty pharmacy.
9. What pricing options are available for accessing the report?
Pricing options include single-user, multi-user, and enterprise licenses priced at USD 4750, USD 5250, and USD 8750 respectively.
10. Is the market size provided in terms of value or volume?
The market size is provided in terms of value, measured in Million.
11. Are there any specific market keywords associated with the report?
Yes, the market keyword associated with the report is "Pharmacy Benefit Management Industry," which aids in identifying and referencing the specific market segment covered.
12. How do I determine which pricing option suits my needs best?
The pricing options vary based on user requirements and access needs. Individual users may opt for single-user licenses, while businesses requiring broader access may choose multi-user or enterprise licenses for cost-effective access to the report.
13. Are there any additional resources or data provided in the Pharmacy Benefit Management Industry report?
While the report offers comprehensive insights, it's advisable to review the specific contents or supplementary materials provided to ascertain if additional resources or data are available.
14. How can I stay updated on further developments or reports in the Pharmacy Benefit Management Industry?
To stay informed about further developments, trends, and reports in the Pharmacy Benefit Management Industry, consider subscribing to industry newsletters, following relevant companies and organizations, or regularly checking reputable industry news sources and publications.
Methodology
Step 1 - Identification of Relevant Samples Size from Population Database


Step 2 - Approaches for Defining Global Market Size (Value, Volume* & Price*)

Note*: In applicable scenarios
Step 3 - Data Sources
Primary Research
- Web Analytics
- Survey Reports
- Research Institute
- Latest Research Reports
- Opinion Leaders
Secondary Research
- Annual Reports
- White Paper
- Latest Press Release
- Industry Association
- Paid Database
- Investor Presentations

Step 4 - Data Triangulation
Involves using different sources of information in order to increase the validity of a study
These sources are likely to be stakeholders in a program - participants, other researchers, program staff, other community members, and so on.
Then we put all data in single framework & apply various statistical tools to find out the dynamic on the market.
During the analysis stage, feedback from the stakeholder groups would be compared to determine areas of agreement as well as areas of divergence