

Key Insights
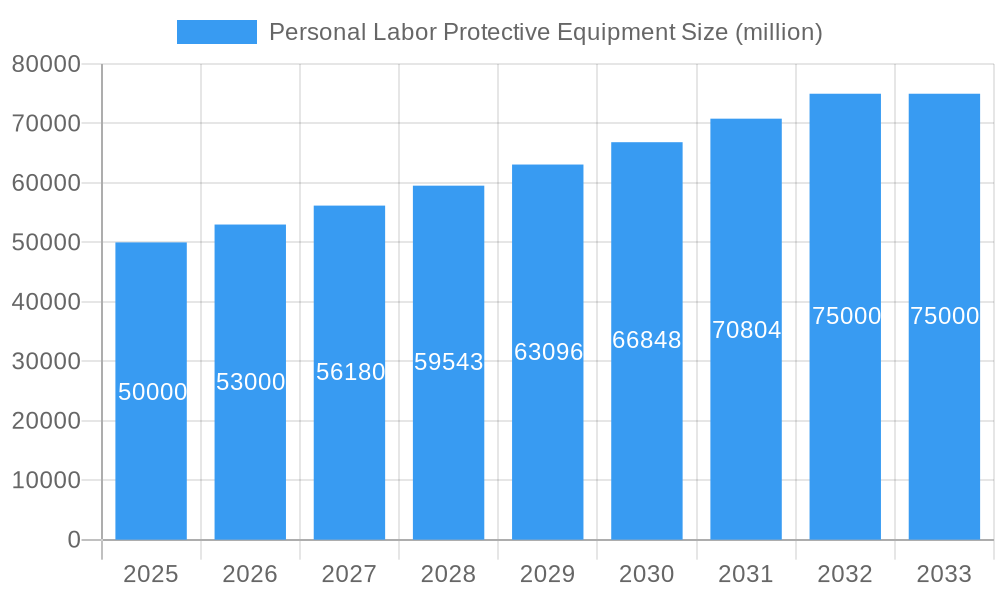
The global market for Personal Labor Protective Equipment (PLPE) is experiencing robust growth, driven by increasing industrialization, stringent safety regulations across various sectors, and a heightened awareness of workplace safety. The market, estimated at $50 billion in 2025, is projected to exhibit a Compound Annual Growth Rate (CAGR) of 6% from 2025 to 2033, reaching approximately $75 billion by 2033. Key drivers include the expanding manufacturing and construction sectors in developing economies, coupled with the rising adoption of advanced PLPE incorporating smart technologies and improved ergonomics. Trends such as the increasing demand for disposable PLPE due to hygiene concerns and the growing preference for customized protective solutions further contribute to market expansion. However, factors such as fluctuating raw material prices and economic downturns can act as restraints, potentially impacting growth trajectory in certain periods. The market is segmented by product type (e.g., gloves, respirators, eye protection, head protection, footwear), end-user industry (e.g., manufacturing, construction, healthcare), and geography. Major players like 3M, Honeywell, Unicharm, Kimberly-Clark, and KOWA are shaping the market through innovation, strategic partnerships, and expansion into new markets. The competitive landscape is characterized by both established players and emerging regional manufacturers. Regional variations in market growth are expected, with North America and Europe holding significant market share due to established safety regulations and high industrial activity, while Asia-Pacific is anticipated to demonstrate substantial growth potential fueled by rapid industrialization and increasing construction activity.
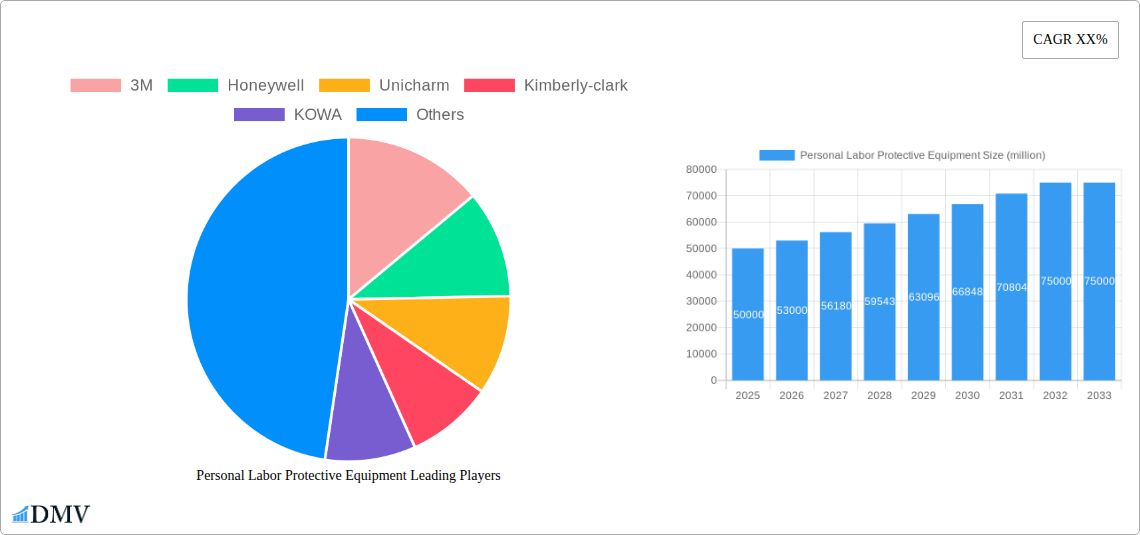
Personal Labor Protective Equipment Market Size (In Billion)
The competitive intensity within the PLPE market is expected to increase further with both organic growth strategies such as product innovation and technological advancements, and inorganic growth strategies including mergers and acquisitions, further shaping market dynamics. Companies are also focusing on enhancing supply chain resilience and adopting sustainable manufacturing practices to improve their market positioning. This evolving landscape presents significant opportunities for businesses capable of adapting to changing consumer preferences, adhering to strict safety standards, and demonstrating a commitment to sustainability. Specific regional growth rates will vary based on factors including economic growth, infrastructure development, and the implementation and enforcement of safety regulations.
Personal Labor Protective Equipment Company Market Share
Personal Labor Protective Equipment Market Report: A Comprehensive Analysis (2019-2033)
This insightful report provides a comprehensive analysis of the Personal Labor Protective Equipment (PPE) market, projecting a market value exceeding $XX million by 2033. The study covers the period 2019-2033, with a focus on the forecast period 2025-2033 and a base year of 2025. This in-depth analysis is crucial for stakeholders seeking to understand market dynamics, identify growth opportunities, and make informed strategic decisions within this vital sector. Key players such as 3M, Honeywell, Unicharm, and Kimberly-Clark are extensively profiled.
Personal Labor Protective Equipment Market Composition & Trends
This section delves into the competitive landscape, analyzing market concentration, innovation drivers, and regulatory influences shaping the PPE market. We examine the interplay of various factors, including substitute products, end-user profiles, and the impact of mergers and acquisitions (M&A) activities on market dynamics.
- Market Concentration: The global PPE market exhibits a moderately concentrated structure, with the top five players commanding approximately xx% of the market share in 2024. This share is projected to xx% by 2033.
- Innovation Catalysts: The increasing demand for advanced PPE materials and technologies, driven by stringent safety regulations and evolving workplace hazards, is fostering innovation. This includes advancements in nanotechnology, smart sensors, and ergonomic designs.
- Regulatory Landscape: Stringent government regulations concerning workplace safety and the increasing enforcement of standards are major drivers shaping market growth. Variations in regulatory frameworks across different regions are also analyzed.
- Substitute Products: The availability of substitute products with comparable functionalities is evaluated, assessing their potential impact on market share and growth trajectories.
- End-User Profiles: The report segments the market by end-user industries, including construction, manufacturing, healthcare, and oil & gas, providing a detailed analysis of their specific PPE requirements and spending patterns.
- M&A Activities: The report analyzes significant M&A deals within the PPE sector during the historical period (2019-2024), with an estimated total transaction value exceeding $XX million. This includes analyzing the strategic rationale behind these deals and their impact on market consolidation.
Personal Labor Protective Equipment Industry Evolution
This section traces the evolution of the PPE industry, examining market growth trajectories, technological advancements, and evolving consumer demands. We analyze the historical growth rate (2019-2024) and project the Compound Annual Growth Rate (CAGR) for the forecast period (2025-2033) at xx%. This analysis incorporates factors such as technological innovations in materials science, improved design for enhanced comfort and protection, and shifting consumer preferences toward more sustainable and eco-friendly PPE solutions. The growing awareness of occupational health and safety, coupled with rising disposable incomes in developing economies, further contributes to market growth.
Leading Regions, Countries, or Segments in Personal Labor Protective Equipment
This section identifies the leading regions and segments within the PPE market. The report highlights the dominance of [Region Name], driven by a confluence of factors such as robust industrial growth, strong regulatory frameworks, and significant investments in infrastructure development.
- Key Drivers for [Region Name]'s Dominance:
- High industrial output across various sectors.
- Stringent safety regulations and enforcement.
- Significant government investments in infrastructure projects.
- Growing awareness of worker safety and health.
[Further detailed analysis of [Region Name]'s dominance will follow, potentially including specific country-level breakdowns and segmental analysis]. Analysis of other key regions and segments such as North America, Europe, and Asia Pacific will also be provided with supporting data.
Personal Labor Protective Equipment Product Innovations
Recent innovations in PPE have focused on enhancing comfort, durability, and protective capabilities. Smart PPE incorporating sensors for real-time health monitoring and improved material technologies offering greater flexibility and breathability are reshaping the market. These advancements cater to evolving workplace demands and address worker concerns regarding comfort and safety. This section explores specific examples of such innovations, along with their unique selling propositions and performance metrics.
Propelling Factors for Personal Labor Protective Equipment Growth
Several factors contribute to the growth of the PPE market. Stringent safety regulations, increasing industrialization, and rising awareness of workplace hazards are key drivers. Furthermore, technological advancements leading to improved PPE designs and materials, coupled with increasing disposable incomes in emerging markets, fuel demand. The impact of government initiatives promoting workplace safety also plays a significant role in market expansion.
Obstacles in the Personal Labor Protective Equipment Market
Despite the growth potential, the PPE market faces challenges. Regulatory complexities and variations across regions can create compliance hurdles for manufacturers. Supply chain disruptions, particularly in raw material sourcing, can lead to production delays and price fluctuations. Furthermore, intense competition and the entry of new players add pressure on profit margins.
Future Opportunities in Personal Labor Protective Equipment
Future opportunities lie in expanding into new markets, particularly in developing economies experiencing rapid industrialization. The development of specialized PPE for emerging industries and integrating advanced technologies like IoT and AI for enhanced safety and monitoring are key growth areas. Sustainable and eco-friendly PPE solutions are gaining traction, presenting significant growth potential.
Major Players in the Personal Labor Protective Equipment Ecosystem
- 3M
- Honeywell
- Unicharm
- Kimberly-Clark
- KOWA
- UVEX
- CM
- Te Yin
- Japan Vilene Company
- Hakugen
- Shanghai Dasheng
- McKesson
- wuerth
Key Developments in Personal Labor Protective Equipment Industry
- [Month, Year]: 3M launches a new line of advanced respirators incorporating innovative filtration technology.
- [Month, Year]: Honeywell acquires a smaller PPE manufacturer, expanding its market reach and product portfolio.
- [Month, Year]: New European Union regulations on PPE come into effect, impacting the market.
- [Month, Year]: A major supply chain disruption affects the availability of certain raw materials.
- [Month, Year]: A significant M&A deal reshapes the competitive landscape. (Further key developments with year/month and impact analysis would be added here)
Strategic Personal Labor Protective Equipment Market Forecast
The PPE market is poised for sustained growth driven by ongoing industrialization, stringent safety regulations, and technological advancements. The rising awareness of occupational health and safety, coupled with the increasing demand for advanced PPE solutions, presents significant opportunities for market players. This report provides a valuable resource for strategic planning and investment decisions within the PPE industry. The long-term outlook is optimistic, with strong potential for expansion in both developed and emerging markets.
Personal Labor Protective Equipment Segmentation
-
1. Application
- 1.1. Online Store
- 1.2. Offline Store
-
2. Types
- 2.1. Eye Protection
- 2.2. Gowns
- 2.3. Aprons
- 2.4. Boots or closed-toe work shoes
- 2.5. Others
Personal Labor Protective Equipment Segmentation By Geography
-
1. North America
- 1.1. United States
- 1.2. Canada
- 1.3. Mexico
-
2. South America
- 2.1. Brazil
- 2.2. Argentina
- 2.3. Rest of South America
-
3. Europe
- 3.1. United Kingdom
- 3.2. Germany
- 3.3. France
- 3.4. Italy
- 3.5. Spain
- 3.6. Russia
- 3.7. Benelux
- 3.8. Nordics
- 3.9. Rest of Europe
-
4. Middle East & Africa
- 4.1. Turkey
- 4.2. Israel
- 4.3. GCC
- 4.4. North Africa
- 4.5. South Africa
- 4.6. Rest of Middle East & Africa
-
5. Asia Pacific
- 5.1. China
- 5.2. India
- 5.3. Japan
- 5.4. South Korea
- 5.5. ASEAN
- 5.6. Oceania
- 5.7. Rest of Asia Pacific

Personal Labor Protective Equipment Regional Market Share
Geographic Coverage of Personal Labor Protective Equipment
Personal Labor Protective Equipment REPORT HIGHLIGHTS
| Aspects | Details |
|---|---|
| Study Period | 2020-2034 |
| Base Year | 2025 |
| Estimated Year | 2026 |
| Forecast Period | 2026-2034 |
| Historical Period | 2020-2025 |
| Growth Rate | CAGR of XX% from 2020-2034 |
| Segmentation |
|
Table of Contents
- 1. Introduction
- 1.1. Research Scope
- 1.2. Market Segmentation
- 1.3. Research Methodology
- 1.4. Definitions and Assumptions
- 2. Executive Summary
- 2.1. Introduction
- 3. Market Dynamics
- 3.1. Introduction
- 3.2. Market Drivers
- 3.3. Market Restrains
- 3.4. Market Trends
- 4. Market Factor Analysis
- 4.1. Porters Five Forces
- 4.2. Supply/Value Chain
- 4.3. PESTEL analysis
- 4.4. Market Entropy
- 4.5. Patent/Trademark Analysis
- 5. Global Personal Labor Protective Equipment Analysis, Insights and Forecast, 2020-2032
- 5.1. Market Analysis, Insights and Forecast - by Application
- 5.1.1. Online Store
- 5.1.2. Offline Store
- 5.2. Market Analysis, Insights and Forecast - by Types
- 5.2.1. Eye Protection
- 5.2.2. Gowns
- 5.2.3. Aprons
- 5.2.4. Boots or closed-toe work shoes
- 5.2.5. Others
- 5.3. Market Analysis, Insights and Forecast - by Region
- 5.3.1. North America
- 5.3.2. South America
- 5.3.3. Europe
- 5.3.4. Middle East & Africa
- 5.3.5. Asia Pacific
- 5.1. Market Analysis, Insights and Forecast - by Application
- 6. North America Personal Labor Protective Equipment Analysis, Insights and Forecast, 2020-2032
- 6.1. Market Analysis, Insights and Forecast - by Application
- 6.1.1. Online Store
- 6.1.2. Offline Store
- 6.2. Market Analysis, Insights and Forecast - by Types
- 6.2.1. Eye Protection
- 6.2.2. Gowns
- 6.2.3. Aprons
- 6.2.4. Boots or closed-toe work shoes
- 6.2.5. Others
- 6.1. Market Analysis, Insights and Forecast - by Application
- 7. South America Personal Labor Protective Equipment Analysis, Insights and Forecast, 2020-2032
- 7.1. Market Analysis, Insights and Forecast - by Application
- 7.1.1. Online Store
- 7.1.2. Offline Store
- 7.2. Market Analysis, Insights and Forecast - by Types
- 7.2.1. Eye Protection
- 7.2.2. Gowns
- 7.2.3. Aprons
- 7.2.4. Boots or closed-toe work shoes
- 7.2.5. Others
- 7.1. Market Analysis, Insights and Forecast - by Application
- 8. Europe Personal Labor Protective Equipment Analysis, Insights and Forecast, 2020-2032
- 8.1. Market Analysis, Insights and Forecast - by Application
- 8.1.1. Online Store
- 8.1.2. Offline Store
- 8.2. Market Analysis, Insights and Forecast - by Types
- 8.2.1. Eye Protection
- 8.2.2. Gowns
- 8.2.3. Aprons
- 8.2.4. Boots or closed-toe work shoes
- 8.2.5. Others
- 8.1. Market Analysis, Insights and Forecast - by Application
- 9. Middle East & Africa Personal Labor Protective Equipment Analysis, Insights and Forecast, 2020-2032
- 9.1. Market Analysis, Insights and Forecast - by Application
- 9.1.1. Online Store
- 9.1.2. Offline Store
- 9.2. Market Analysis, Insights and Forecast - by Types
- 9.2.1. Eye Protection
- 9.2.2. Gowns
- 9.2.3. Aprons
- 9.2.4. Boots or closed-toe work shoes
- 9.2.5. Others
- 9.1. Market Analysis, Insights and Forecast - by Application
- 10. Asia Pacific Personal Labor Protective Equipment Analysis, Insights and Forecast, 2020-2032
- 10.1. Market Analysis, Insights and Forecast - by Application
- 10.1.1. Online Store
- 10.1.2. Offline Store
- 10.2. Market Analysis, Insights and Forecast - by Types
- 10.2.1. Eye Protection
- 10.2.2. Gowns
- 10.2.3. Aprons
- 10.2.4. Boots or closed-toe work shoes
- 10.2.5. Others
- 10.1. Market Analysis, Insights and Forecast - by Application
- 11. Competitive Analysis
- 11.1. Global Market Share Analysis 2025
- 11.2. Company Profiles
- 11.2.1 3M
- 11.2.1.1. Overview
- 11.2.1.2. Products
- 11.2.1.3. SWOT Analysis
- 11.2.1.4. Recent Developments
- 11.2.1.5. Financials (Based on Availability)
- 11.2.2 Honeywell
- 11.2.2.1. Overview
- 11.2.2.2. Products
- 11.2.2.3. SWOT Analysis
- 11.2.2.4. Recent Developments
- 11.2.2.5. Financials (Based on Availability)
- 11.2.3 Unicharm
- 11.2.3.1. Overview
- 11.2.3.2. Products
- 11.2.3.3. SWOT Analysis
- 11.2.3.4. Recent Developments
- 11.2.3.5. Financials (Based on Availability)
- 11.2.4 Kimberly-clark
- 11.2.4.1. Overview
- 11.2.4.2. Products
- 11.2.4.3. SWOT Analysis
- 11.2.4.4. Recent Developments
- 11.2.4.5. Financials (Based on Availability)
- 11.2.5 KOWA
- 11.2.5.1. Overview
- 11.2.5.2. Products
- 11.2.5.3. SWOT Analysis
- 11.2.5.4. Recent Developments
- 11.2.5.5. Financials (Based on Availability)
- 11.2.6 UVEX
- 11.2.6.1. Overview
- 11.2.6.2. Products
- 11.2.6.3. SWOT Analysis
- 11.2.6.4. Recent Developments
- 11.2.6.5. Financials (Based on Availability)
- 11.2.7 CM
- 11.2.7.1. Overview
- 11.2.7.2. Products
- 11.2.7.3. SWOT Analysis
- 11.2.7.4. Recent Developments
- 11.2.7.5. Financials (Based on Availability)
- 11.2.8 Te Yin
- 11.2.8.1. Overview
- 11.2.8.2. Products
- 11.2.8.3. SWOT Analysis
- 11.2.8.4. Recent Developments
- 11.2.8.5. Financials (Based on Availability)
- 11.2.9 Japan Vilene Company
- 11.2.9.1. Overview
- 11.2.9.2. Products
- 11.2.9.3. SWOT Analysis
- 11.2.9.4. Recent Developments
- 11.2.9.5. Financials (Based on Availability)
- 11.2.10 Hakugen
- 11.2.10.1. Overview
- 11.2.10.2. Products
- 11.2.10.3. SWOT Analysis
- 11.2.10.4. Recent Developments
- 11.2.10.5. Financials (Based on Availability)
- 11.2.11 Shanghai Dasheng
- 11.2.11.1. Overview
- 11.2.11.2. Products
- 11.2.11.3. SWOT Analysis
- 11.2.11.4. Recent Developments
- 11.2.11.5. Financials (Based on Availability)
- 11.2.12 McKesson
- 11.2.12.1. Overview
- 11.2.12.2. Products
- 11.2.12.3. SWOT Analysis
- 11.2.12.4. Recent Developments
- 11.2.12.5. Financials (Based on Availability)
- 11.2.13 wuerth
- 11.2.13.1. Overview
- 11.2.13.2. Products
- 11.2.13.3. SWOT Analysis
- 11.2.13.4. Recent Developments
- 11.2.13.5. Financials (Based on Availability)
- 11.2.1 3M
List of Figures
- Figure 1: Global Personal Labor Protective Equipment Revenue Breakdown (million, %) by Region 2025 & 2033
- Figure 2: Global Personal Labor Protective Equipment Volume Breakdown (K, %) by Region 2025 & 2033
- Figure 3: North America Personal Labor Protective Equipment Revenue (million), by Application 2025 & 2033
- Figure 4: North America Personal Labor Protective Equipment Volume (K), by Application 2025 & 2033
- Figure 5: North America Personal Labor Protective Equipment Revenue Share (%), by Application 2025 & 2033
- Figure 6: North America Personal Labor Protective Equipment Volume Share (%), by Application 2025 & 2033
- Figure 7: North America Personal Labor Protective Equipment Revenue (million), by Types 2025 & 2033
- Figure 8: North America Personal Labor Protective Equipment Volume (K), by Types 2025 & 2033
- Figure 9: North America Personal Labor Protective Equipment Revenue Share (%), by Types 2025 & 2033
- Figure 10: North America Personal Labor Protective Equipment Volume Share (%), by Types 2025 & 2033
- Figure 11: North America Personal Labor Protective Equipment Revenue (million), by Country 2025 & 2033
- Figure 12: North America Personal Labor Protective Equipment Volume (K), by Country 2025 & 2033
- Figure 13: North America Personal Labor Protective Equipment Revenue Share (%), by Country 2025 & 2033
- Figure 14: North America Personal Labor Protective Equipment Volume Share (%), by Country 2025 & 2033
- Figure 15: South America Personal Labor Protective Equipment Revenue (million), by Application 2025 & 2033
- Figure 16: South America Personal Labor Protective Equipment Volume (K), by Application 2025 & 2033
- Figure 17: South America Personal Labor Protective Equipment Revenue Share (%), by Application 2025 & 2033
- Figure 18: South America Personal Labor Protective Equipment Volume Share (%), by Application 2025 & 2033
- Figure 19: South America Personal Labor Protective Equipment Revenue (million), by Types 2025 & 2033
- Figure 20: South America Personal Labor Protective Equipment Volume (K), by Types 2025 & 2033
- Figure 21: South America Personal Labor Protective Equipment Revenue Share (%), by Types 2025 & 2033
- Figure 22: South America Personal Labor Protective Equipment Volume Share (%), by Types 2025 & 2033
- Figure 23: South America Personal Labor Protective Equipment Revenue (million), by Country 2025 & 2033
- Figure 24: South America Personal Labor Protective Equipment Volume (K), by Country 2025 & 2033
- Figure 25: South America Personal Labor Protective Equipment Revenue Share (%), by Country 2025 & 2033
- Figure 26: South America Personal Labor Protective Equipment Volume Share (%), by Country 2025 & 2033
- Figure 27: Europe Personal Labor Protective Equipment Revenue (million), by Application 2025 & 2033
- Figure 28: Europe Personal Labor Protective Equipment Volume (K), by Application 2025 & 2033
- Figure 29: Europe Personal Labor Protective Equipment Revenue Share (%), by Application 2025 & 2033
- Figure 30: Europe Personal Labor Protective Equipment Volume Share (%), by Application 2025 & 2033
- Figure 31: Europe Personal Labor Protective Equipment Revenue (million), by Types 2025 & 2033
- Figure 32: Europe Personal Labor Protective Equipment Volume (K), by Types 2025 & 2033
- Figure 33: Europe Personal Labor Protective Equipment Revenue Share (%), by Types 2025 & 2033
- Figure 34: Europe Personal Labor Protective Equipment Volume Share (%), by Types 2025 & 2033
- Figure 35: Europe Personal Labor Protective Equipment Revenue (million), by Country 2025 & 2033
- Figure 36: Europe Personal Labor Protective Equipment Volume (K), by Country 2025 & 2033
- Figure 37: Europe Personal Labor Protective Equipment Revenue Share (%), by Country 2025 & 2033
- Figure 38: Europe Personal Labor Protective Equipment Volume Share (%), by Country 2025 & 2033
- Figure 39: Middle East & Africa Personal Labor Protective Equipment Revenue (million), by Application 2025 & 2033
- Figure 40: Middle East & Africa Personal Labor Protective Equipment Volume (K), by Application 2025 & 2033
- Figure 41: Middle East & Africa Personal Labor Protective Equipment Revenue Share (%), by Application 2025 & 2033
- Figure 42: Middle East & Africa Personal Labor Protective Equipment Volume Share (%), by Application 2025 & 2033
- Figure 43: Middle East & Africa Personal Labor Protective Equipment Revenue (million), by Types 2025 & 2033
- Figure 44: Middle East & Africa Personal Labor Protective Equipment Volume (K), by Types 2025 & 2033
- Figure 45: Middle East & Africa Personal Labor Protective Equipment Revenue Share (%), by Types 2025 & 2033
- Figure 46: Middle East & Africa Personal Labor Protective Equipment Volume Share (%), by Types 2025 & 2033
- Figure 47: Middle East & Africa Personal Labor Protective Equipment Revenue (million), by Country 2025 & 2033
- Figure 48: Middle East & Africa Personal Labor Protective Equipment Volume (K), by Country 2025 & 2033
- Figure 49: Middle East & Africa Personal Labor Protective Equipment Revenue Share (%), by Country 2025 & 2033
- Figure 50: Middle East & Africa Personal Labor Protective Equipment Volume Share (%), by Country 2025 & 2033
- Figure 51: Asia Pacific Personal Labor Protective Equipment Revenue (million), by Application 2025 & 2033
- Figure 52: Asia Pacific Personal Labor Protective Equipment Volume (K), by Application 2025 & 2033
- Figure 53: Asia Pacific Personal Labor Protective Equipment Revenue Share (%), by Application 2025 & 2033
- Figure 54: Asia Pacific Personal Labor Protective Equipment Volume Share (%), by Application 2025 & 2033
- Figure 55: Asia Pacific Personal Labor Protective Equipment Revenue (million), by Types 2025 & 2033
- Figure 56: Asia Pacific Personal Labor Protective Equipment Volume (K), by Types 2025 & 2033
- Figure 57: Asia Pacific Personal Labor Protective Equipment Revenue Share (%), by Types 2025 & 2033
- Figure 58: Asia Pacific Personal Labor Protective Equipment Volume Share (%), by Types 2025 & 2033
- Figure 59: Asia Pacific Personal Labor Protective Equipment Revenue (million), by Country 2025 & 2033
- Figure 60: Asia Pacific Personal Labor Protective Equipment Volume (K), by Country 2025 & 2033
- Figure 61: Asia Pacific Personal Labor Protective Equipment Revenue Share (%), by Country 2025 & 2033
- Figure 62: Asia Pacific Personal Labor Protective Equipment Volume Share (%), by Country 2025 & 2033
List of Tables
- Table 1: Global Personal Labor Protective Equipment Revenue million Forecast, by Application 2020 & 2033
- Table 2: Global Personal Labor Protective Equipment Volume K Forecast, by Application 2020 & 2033
- Table 3: Global Personal Labor Protective Equipment Revenue million Forecast, by Types 2020 & 2033
- Table 4: Global Personal Labor Protective Equipment Volume K Forecast, by Types 2020 & 2033
- Table 5: Global Personal Labor Protective Equipment Revenue million Forecast, by Region 2020 & 2033
- Table 6: Global Personal Labor Protective Equipment Volume K Forecast, by Region 2020 & 2033
- Table 7: Global Personal Labor Protective Equipment Revenue million Forecast, by Application 2020 & 2033
- Table 8: Global Personal Labor Protective Equipment Volume K Forecast, by Application 2020 & 2033
- Table 9: Global Personal Labor Protective Equipment Revenue million Forecast, by Types 2020 & 2033
- Table 10: Global Personal Labor Protective Equipment Volume K Forecast, by Types 2020 & 2033
- Table 11: Global Personal Labor Protective Equipment Revenue million Forecast, by Country 2020 & 2033
- Table 12: Global Personal Labor Protective Equipment Volume K Forecast, by Country 2020 & 2033
- Table 13: United States Personal Labor Protective Equipment Revenue (million) Forecast, by Application 2020 & 2033
- Table 14: United States Personal Labor Protective Equipment Volume (K) Forecast, by Application 2020 & 2033
- Table 15: Canada Personal Labor Protective Equipment Revenue (million) Forecast, by Application 2020 & 2033
- Table 16: Canada Personal Labor Protective Equipment Volume (K) Forecast, by Application 2020 & 2033
- Table 17: Mexico Personal Labor Protective Equipment Revenue (million) Forecast, by Application 2020 & 2033
- Table 18: Mexico Personal Labor Protective Equipment Volume (K) Forecast, by Application 2020 & 2033
- Table 19: Global Personal Labor Protective Equipment Revenue million Forecast, by Application 2020 & 2033
- Table 20: Global Personal Labor Protective Equipment Volume K Forecast, by Application 2020 & 2033
- Table 21: Global Personal Labor Protective Equipment Revenue million Forecast, by Types 2020 & 2033
- Table 22: Global Personal Labor Protective Equipment Volume K Forecast, by Types 2020 & 2033
- Table 23: Global Personal Labor Protective Equipment Revenue million Forecast, by Country 2020 & 2033
- Table 24: Global Personal Labor Protective Equipment Volume K Forecast, by Country 2020 & 2033
- Table 25: Brazil Personal Labor Protective Equipment Revenue (million) Forecast, by Application 2020 & 2033
- Table 26: Brazil Personal Labor Protective Equipment Volume (K) Forecast, by Application 2020 & 2033
- Table 27: Argentina Personal Labor Protective Equipment Revenue (million) Forecast, by Application 2020 & 2033
- Table 28: Argentina Personal Labor Protective Equipment Volume (K) Forecast, by Application 2020 & 2033
- Table 29: Rest of South America Personal Labor Protective Equipment Revenue (million) Forecast, by Application 2020 & 2033
- Table 30: Rest of South America Personal Labor Protective Equipment Volume (K) Forecast, by Application 2020 & 2033
- Table 31: Global Personal Labor Protective Equipment Revenue million Forecast, by Application 2020 & 2033
- Table 32: Global Personal Labor Protective Equipment Volume K Forecast, by Application 2020 & 2033
- Table 33: Global Personal Labor Protective Equipment Revenue million Forecast, by Types 2020 & 2033
- Table 34: Global Personal Labor Protective Equipment Volume K Forecast, by Types 2020 & 2033
- Table 35: Global Personal Labor Protective Equipment Revenue million Forecast, by Country 2020 & 2033
- Table 36: Global Personal Labor Protective Equipment Volume K Forecast, by Country 2020 & 2033
- Table 37: United Kingdom Personal Labor Protective Equipment Revenue (million) Forecast, by Application 2020 & 2033
- Table 38: United Kingdom Personal Labor Protective Equipment Volume (K) Forecast, by Application 2020 & 2033
- Table 39: Germany Personal Labor Protective Equipment Revenue (million) Forecast, by Application 2020 & 2033
- Table 40: Germany Personal Labor Protective Equipment Volume (K) Forecast, by Application 2020 & 2033
- Table 41: France Personal Labor Protective Equipment Revenue (million) Forecast, by Application 2020 & 2033
- Table 42: France Personal Labor Protective Equipment Volume (K) Forecast, by Application 2020 & 2033
- Table 43: Italy Personal Labor Protective Equipment Revenue (million) Forecast, by Application 2020 & 2033
- Table 44: Italy Personal Labor Protective Equipment Volume (K) Forecast, by Application 2020 & 2033
- Table 45: Spain Personal Labor Protective Equipment Revenue (million) Forecast, by Application 2020 & 2033
- Table 46: Spain Personal Labor Protective Equipment Volume (K) Forecast, by Application 2020 & 2033
- Table 47: Russia Personal Labor Protective Equipment Revenue (million) Forecast, by Application 2020 & 2033
- Table 48: Russia Personal Labor Protective Equipment Volume (K) Forecast, by Application 2020 & 2033
- Table 49: Benelux Personal Labor Protective Equipment Revenue (million) Forecast, by Application 2020 & 2033
- Table 50: Benelux Personal Labor Protective Equipment Volume (K) Forecast, by Application 2020 & 2033
- Table 51: Nordics Personal Labor Protective Equipment Revenue (million) Forecast, by Application 2020 & 2033
- Table 52: Nordics Personal Labor Protective Equipment Volume (K) Forecast, by Application 2020 & 2033
- Table 53: Rest of Europe Personal Labor Protective Equipment Revenue (million) Forecast, by Application 2020 & 2033
- Table 54: Rest of Europe Personal Labor Protective Equipment Volume (K) Forecast, by Application 2020 & 2033
- Table 55: Global Personal Labor Protective Equipment Revenue million Forecast, by Application 2020 & 2033
- Table 56: Global Personal Labor Protective Equipment Volume K Forecast, by Application 2020 & 2033
- Table 57: Global Personal Labor Protective Equipment Revenue million Forecast, by Types 2020 & 2033
- Table 58: Global Personal Labor Protective Equipment Volume K Forecast, by Types 2020 & 2033
- Table 59: Global Personal Labor Protective Equipment Revenue million Forecast, by Country 2020 & 2033
- Table 60: Global Personal Labor Protective Equipment Volume K Forecast, by Country 2020 & 2033
- Table 61: Turkey Personal Labor Protective Equipment Revenue (million) Forecast, by Application 2020 & 2033
- Table 62: Turkey Personal Labor Protective Equipment Volume (K) Forecast, by Application 2020 & 2033
- Table 63: Israel Personal Labor Protective Equipment Revenue (million) Forecast, by Application 2020 & 2033
- Table 64: Israel Personal Labor Protective Equipment Volume (K) Forecast, by Application 2020 & 2033
- Table 65: GCC Personal Labor Protective Equipment Revenue (million) Forecast, by Application 2020 & 2033
- Table 66: GCC Personal Labor Protective Equipment Volume (K) Forecast, by Application 2020 & 2033
- Table 67: North Africa Personal Labor Protective Equipment Revenue (million) Forecast, by Application 2020 & 2033
- Table 68: North Africa Personal Labor Protective Equipment Volume (K) Forecast, by Application 2020 & 2033
- Table 69: South Africa Personal Labor Protective Equipment Revenue (million) Forecast, by Application 2020 & 2033
- Table 70: South Africa Personal Labor Protective Equipment Volume (K) Forecast, by Application 2020 & 2033
- Table 71: Rest of Middle East & Africa Personal Labor Protective Equipment Revenue (million) Forecast, by Application 2020 & 2033
- Table 72: Rest of Middle East & Africa Personal Labor Protective Equipment Volume (K) Forecast, by Application 2020 & 2033
- Table 73: Global Personal Labor Protective Equipment Revenue million Forecast, by Application 2020 & 2033
- Table 74: Global Personal Labor Protective Equipment Volume K Forecast, by Application 2020 & 2033
- Table 75: Global Personal Labor Protective Equipment Revenue million Forecast, by Types 2020 & 2033
- Table 76: Global Personal Labor Protective Equipment Volume K Forecast, by Types 2020 & 2033
- Table 77: Global Personal Labor Protective Equipment Revenue million Forecast, by Country 2020 & 2033
- Table 78: Global Personal Labor Protective Equipment Volume K Forecast, by Country 2020 & 2033
- Table 79: China Personal Labor Protective Equipment Revenue (million) Forecast, by Application 2020 & 2033
- Table 80: China Personal Labor Protective Equipment Volume (K) Forecast, by Application 2020 & 2033
- Table 81: India Personal Labor Protective Equipment Revenue (million) Forecast, by Application 2020 & 2033
- Table 82: India Personal Labor Protective Equipment Volume (K) Forecast, by Application 2020 & 2033
- Table 83: Japan Personal Labor Protective Equipment Revenue (million) Forecast, by Application 2020 & 2033
- Table 84: Japan Personal Labor Protective Equipment Volume (K) Forecast, by Application 2020 & 2033
- Table 85: South Korea Personal Labor Protective Equipment Revenue (million) Forecast, by Application 2020 & 2033
- Table 86: South Korea Personal Labor Protective Equipment Volume (K) Forecast, by Application 2020 & 2033
- Table 87: ASEAN Personal Labor Protective Equipment Revenue (million) Forecast, by Application 2020 & 2033
- Table 88: ASEAN Personal Labor Protective Equipment Volume (K) Forecast, by Application 2020 & 2033
- Table 89: Oceania Personal Labor Protective Equipment Revenue (million) Forecast, by Application 2020 & 2033
- Table 90: Oceania Personal Labor Protective Equipment Volume (K) Forecast, by Application 2020 & 2033
- Table 91: Rest of Asia Pacific Personal Labor Protective Equipment Revenue (million) Forecast, by Application 2020 & 2033
- Table 92: Rest of Asia Pacific Personal Labor Protective Equipment Volume (K) Forecast, by Application 2020 & 2033
Frequently Asked Questions
1. What is the projected Compound Annual Growth Rate (CAGR) of the Personal Labor Protective Equipment?
The projected CAGR is approximately XX%.
2. Which companies are prominent players in the Personal Labor Protective Equipment?
Key companies in the market include 3M, Honeywell, Unicharm, Kimberly-clark, KOWA, UVEX, CM, Te Yin, Japan Vilene Company, Hakugen, Shanghai Dasheng, McKesson, wuerth.
3. What are the main segments of the Personal Labor Protective Equipment?
The market segments include Application, Types.
4. Can you provide details about the market size?
The market size is estimated to be USD XXX million as of 2022.
5. What are some drivers contributing to market growth?
N/A
6. What are the notable trends driving market growth?
N/A
7. Are there any restraints impacting market growth?
N/A
8. Can you provide examples of recent developments in the market?
N/A
9. What pricing options are available for accessing the report?
Pricing options include single-user, multi-user, and enterprise licenses priced at USD 4350.00, USD 6525.00, and USD 8700.00 respectively.
10. Is the market size provided in terms of value or volume?
The market size is provided in terms of value, measured in million and volume, measured in K.
11. Are there any specific market keywords associated with the report?
Yes, the market keyword associated with the report is "Personal Labor Protective Equipment," which aids in identifying and referencing the specific market segment covered.
12. How do I determine which pricing option suits my needs best?
The pricing options vary based on user requirements and access needs. Individual users may opt for single-user licenses, while businesses requiring broader access may choose multi-user or enterprise licenses for cost-effective access to the report.
13. Are there any additional resources or data provided in the Personal Labor Protective Equipment report?
While the report offers comprehensive insights, it's advisable to review the specific contents or supplementary materials provided to ascertain if additional resources or data are available.
14. How can I stay updated on further developments or reports in the Personal Labor Protective Equipment?
To stay informed about further developments, trends, and reports in the Personal Labor Protective Equipment, consider subscribing to industry newsletters, following relevant companies and organizations, or regularly checking reputable industry news sources and publications.
Methodology
Step 1 - Identification of Relevant Samples Size from Population Database


Step 2 - Approaches for Defining Global Market Size (Value, Volume* & Price*)

Note*: In applicable scenarios
Step 3 - Data Sources
Primary Research
- Web Analytics
- Survey Reports
- Research Institute
- Latest Research Reports
- Opinion Leaders
Secondary Research
- Annual Reports
- White Paper
- Latest Press Release
- Industry Association
- Paid Database
- Investor Presentations

Step 4 - Data Triangulation
Involves using different sources of information in order to increase the validity of a study
These sources are likely to be stakeholders in a program - participants, other researchers, program staff, other community members, and so on.
Then we put all data in single framework & apply various statistical tools to find out the dynamic on the market.
During the analysis stage, feedback from the stakeholder groups would be compared to determine areas of agreement as well as areas of divergence